CLEO Collaboration
Search for via fully reconstructed decays
Abstract
We report a search for the decay in a sample of events collected with the CLEO-c detector. No signals are observed in any of the 11 exclusive decay modes studied, or in their sum. Product branching fraction upper limits are determined as a function of for the 11 individual modes.
pacs:
13.20.Gd, 13.25.Gv, 13.40.HqI Introduction
The first radially excited S-wave spin singlet state in the charmonium system, , was observed by the Belle Collaboration in the decay process PhysRevLett.89.102001 . It was confirmed by the CLEO cleo2004fusion and BaBar babar2004fusion Collaborations in the two-photon fusion process and by the BaBar Collaboration in the double-charmonium production process babar2005jpsicc . These observations, which give an average mass , are inconsistent with a previous measurement of CB_etac2s based on an inclusive measurement of the decay process . By measuring the inclusive photon spectrum in a sample of decays collected with the CLEO III detector, the CLEO Collaboration set an upper limit of at 90 confidence level (C.L.) for an mass of 3594 MeV/ cleo2004photon .
Theoretical predictions for the branching fraction of based on potential model calculations fall in a range of M1Theory for . A phenomenological prediction, based on assuming that the matrix element governing is the same as that for , is given by
| (1) |
where [] is the photon energy for the [] transition, [] is the [] full width, and is the weighted average of the value listed by the Particle Data Group (PDG) PDG2008 and a recent CLEO measurement Mitchell:CLEOjpsitoetac . Using the PDG values for , , , and leads to a prediction of .
In this paper we describe a search for production through using a sample of decays collected with the CLEO-c detector. We attempt to fully reconstruct the in 11 exclusive decay modes: (composed of the decay modes and ), , , , , , , , , , and , where the is reconstructed in , , and decays. For a specific decay mode , the yield of events, , in a sample of decays, , is given by
| (2) |
where is the efficiency for fully reconstructing the hadronic decay and the 50 MeV transition photon. The main experimental challenge is background from low-energy photons. By searching for exclusive decays to specific final states, it may be possible to observe decays through modes other than , determine the product branching fractions in Eq. (2), and obtain improved measurements of properties.
II Data Sample and Event Selection
We use an annihilation data sample with an integrated luminosity of 51.8 pb-1 taken at the mass, . The data were produced with the symmetric electron-position beams delivered by the Cornell Electron Storage Ring (CESR) and collected by the CLEO-c detector CLEOcDet . CLEO-c is an approximately cylindrically symmetric detector that provides a solid angle coverage of 93%. The charged particle tracking system, consisting of a six-layer wire vertex detector (ZD) and a 47-layer wire drift chamber (DR), provides a momentum resolution of 0.6 for tracks with transverse momenta of 1 GeV/. An electromagnetic calorimeter (CC) consisting of 7784 cesium iodide crystals detects electromagnetic showers with an energy resolution for photons of 2.2 at and at 100 MeV. Charged particle identification (PID) information is obtained by measuring ionization energy loss () in the DR and with a Ring Imaging Cherenkov (RICH) detector. The RICH detector is located between the DR and CC and covers , where is defined with respect to the positron beam. All of the detector components described here reside within a 1.0 T magnetic field aligned with the beam axis.
Reconstructed events are required to have the appropriate number of charged tracks for the exclusive process being investigated and therefore to have zero net charge. Charged tracks not associated with a decay are required to have an impact parameter within 5 mm of the annihilation interaction point (IP) and within 5 cm of the IP along the beam axis. The charged pions used to form candidates are constrained to a common vertex, which is required to be displaced from the IP by at least 3 standard deviations as determined from the net momentum of the pair, and are required to have an invariant mass within 10 MeV/ of the mass.
PID information from and the RICH detector is combined to discriminate between pions and kaons. Separation is achieved by a requirement on the variable , where is the number of standard deviations of separation between the measured and the mean expectation for a particular particle hypothesis, and is the likelihood for a particular particle hypothesis using information from the RICH detector. We require kaon candidates to have , while pion candidates are required to have . If there is no information for the track from the RICH detector, the number of Cherenkov photons associated with the track is less than 3, or the momentum of the track is less than 700 MeV/, then only information is used. If a decay mode includes two charged kaons, then only one kaon is required to pass the criterion.
Transition photon candidates are required to be detected in the region of the CC that gives the best performance (, “barrel”), to have a lateral shower shape consistent with that of a photon, to be not associated with a charged track traversing the CC, and to have a minimum energy of 30 MeV. The candidates are reconstructed in the and decay modes, with the invariant mass required to be within 10 MeV/ of the nominal mass [. The is reconstructed from the decay process with , with the invariant mass required to be within 10 MeV/ of . Photon pairs forming a () candidate are selected from both the barrel and endcap () regions of the CC. They are required to have a two-photon invariant mass within 3 standard deviations of the nominal mass, approximately 18 (36) MeV/ for the (), and are kinematically constrained to the () mass for subsequent event reconstruction.
Monte Carlo (MC) simulations, which have been extensively tested with independent data samples, are used to determine detector efficiencies and to study backgrounds. The MC samples are generated with EVTGEN EVTGEN and a GEANT-based GEANT detector simulation. Radiation emitted from charged particles, i.e., final state radiation (FSR), is simulated with the PHOTOS package PHOTOS . For signal MC samples, the generated angular distribution of the vector to vector-pseudoscalar transition is , while the is decayed according to phase space. MC samples consisting of generic decays (10 times the data size) and a “continuum” sample of events, consisting of an integrated luminosity of 259 pb-1 (5 times the data size), are used to study possible backgrounds. The generic MC sample is generated using the available branching fractions for the , , , and decays PDG2007 , with unmeasured decay modes simulated by JETSET JETSET . The continuum sample is generated using JETSET models and has been validated with a data sample consisting of 20.6 pb-1 collected at .
Transitions from the resonance to other low-lying charmonium states are a potentially large background for . In particular, decays to the via and transitions and transition photons from need to be suppressed. Selection criteria to suppress these decays were designed and efficiencies and background-rejection fractions determined with signal and background MC samples, respectively. In what follows, efficiency loss and background rejection are determined from the differences in the yields with and without the requirement being investigated.
For the hadronic final states , , , , and , events are rejected if any pair originating from the IP has a recoil mass within 20 MeV/ of or if the invariant mass of the other hadrons is within 30 MeV/ of . Efficiency losses for are 0.1% for both criteria, and backgrounds are reduced by 10% and 1% for the recoil and invariant mass criteria, respectively. The efficiency loss for is 0.4% (0.6%) for the recoil (invariant) mass criterion, while the background is reduced by 26% (4%). Efficiency losses for are 1.0% for both criteria, and backgrounds are reduced by 57% and 34% for the recoil and invariant mass criteria, respectively. Efficiency losses for and are 5.5% and backgrounds are reduced by two-thirds for the recoil mass criterion while, for the invariant mass criterion, the efficiency loss is 5.6% [6.3%] and the background is reduced by 33% [51%] for [].
In order to suppress the much more abundant decays in the final state, events are rejected if the recoil mass of any pair originating from the IP has a value greater than = 3067 MeV/. The efficiency loss for this criterion is 0.7%, while it reduces the background by 96%.
To suppress decays, events are rejected if the recoil mass is within 40 MeV/ of for , and within 20 MeV/ of for , . Efficiency losses are 0.5% for both decays, while backgrounds are reduced by two-thirds.
For the final state, events are rejected if the recoil mass determined from the higher energy photon used in forming the candidate is within 20 MeV/ of or , or within 30 MeV/ of . The efficiency loss is 4%, while the background is reduced by 38%. The same photon recoil mass requirements are used for the lower energy photon in decays for the and final states. The efficiency loss is 24% (27%) for (), while the background is reduced by 83% (71%).
The invariant mass of the hadronic decay, , for all modes is required to be between and 100 MeV below it, i.e., with . Requiring rejects events with a direct decay combined with a low-energy shower, while requiring rejects hadronic decays of the state. The efficiency loss is largest for modes with only two charged tracks (6.6% for , 2.7% for , and 2.4% for ), while it is less than 1.7% for all other modes. The background rejection ranges from 21% for the mode to 67% for the mode.
Kinematic fitting is used to optimize signal detection and reject background. The sum of the four-momenta of the reconstructed hadronic decay and the transition photon candidate is constrained to the initial four-momentum. The requirement on the per degree of freedom (/d.o.f.) for this total event fit is optimized mode by mode by evaluating the figure of merit . The accepted signal () is determined by processing a sample of signal MC events that was generated with an assumed branching fraction of M1Phenom (smaller than our current phenomenological estimate) and the arbitrary assumption that the branching fraction for each decay to light hadrons is . The generic and continuum background MC samples, scaled to our data sample size, are used to compute the corresponding background (). The /d.o.f. requirements derived from this study are listed in Table 1. In addition, the reconstructed particles originating from the IP are constrained to a common vertex, and the per degree of freedom of this vertex fit is required to be less than 10 for all modes.
| Channel | /d.o.f. | |
|---|---|---|
| 3.5 | ||
| 4.0 | ||
| — | ||
| 4.5 | ||
| 5.0 | ||
| 4.0 | ||
| 2.5 | ||
| 4.0 | ||
| 4.0 | ||
| 2.0 | ||
| 3.0 | ||
| — | ||
| 3.5 | ||
| 5.0 | ||
| — | ||
| 3.0 |
Additional selection criteria have been developed for suppression of low-energy shower backgrounds. These showers are associated with bremsstrahlung radiation emitted from charged pions in the reconstructed hadronic decays (FSR) and showers created from nuclear reactions of charged pions and kaons in the CC (“split-off” showers). The /d.o.f. requirement for the total event fit suppresses some split-off showers, but it does not provide effective suppression of FSR since the energy momentum is balanced in a fully reconstructed hadronic decay with FSR. FSR can be suppressed by requiring that the opening angle between a charged pion at the IP and the transition photon candidate be greater than some value. Split-off showers can be suppressed by requiring the transition photon candidate to be some distance away from a charged track entering the CC. The specific selection criteria are optimized using the same procedure described above.
While all decay modes are evaluated for additional background shower suppression, FSR suppression is found to be useful only for the and hadronic final states, for which the angle between a charged pion and candidate photon is required to be greater than 0.376 rad. The efficiency loss is 13.0% (11.1%) for the () mode, while the background is reduced by 41% (48%). Split-off suppression is only applied to the and hadronic final states, for which the distance between the charged track and candidate photon shower is required to be greater than 45 and 35 cm, respectively. The efficiency loss is 7.7% (2.2%) for the ( ) mode, while the background is reduced by 32% (18%).
III Yield Determination Procedure and Cross-Checks
Searches for the transition are performed by studying the measured shower energy of the transition photon candidate without adjustment from the total event kinematic fit. Signal yields are determined by performing a binned log-likelihood fit of the CC shower energy distribution with a Breit-Wigner function convoluted with a MC-determined detector resolution function for the signal shape and a background shape composed of the events from the background MC samples that pass the event selection criteria. The mean and width of the Breit-Wigner function are fixed to and PDG2008 . Any monochromatic shower energy distribution reconstructed in the CC has a low-side tail caused by losses sustained in interactions prior to entering the CC and from leakage outside the CsI crystals. For that reason, the Crystal Ball function CBfunction is used to parameterize the detector resolution, with parameters determined from the signal MC samples.
The procedure for determining the yields has been studied and tested with two closely related processes. Reconstructed decays are used to test the signal fitting procedure. To assess the reliability of the MC samples for determining the shape of the background shower energy distribution, we investigate the process with the decaying to , , , or . These modes have mixtures of final state hadrons very similar to our signal channels and no additional photons, so the calorimeter response should closely resemble the backgrounds in the signal region. More details on these studies are provided in Ref. KaiyanThesis .

For the decay study, the previously described event selection criteria for the , , , and hadronic final states are applied with the exceptions that the recoil mass and hadronic decay suppression criteria are not applied and that at least one pair is required to have a recoil mass within 20 MeV/ of . Three different background shapes were studied: a first-order polynomial, the energy distribution of showers from the background MC samples that pass the selection criteria (one free parameter for the normalization), and events from the same background MC samples partitioned into separate distributions for showers identified as being split-off showers and for all others (two free parameters, the normalization of each distribution). Figure 1 shows the fits of the measured shower energy distributions with the backgrounds predicted by the MC with one free parameter and no special treatment of split-off showers. The /d.o.f. are 25.1/20, 11.7/20, 11.7/20, and 39.7/20 for the , and decays, respectively. The background MC samples are found to adequately reproduce the behavior observed in data, with no clear improvement when split-off showers are treated separately. Therefore, we use the shower energy distributions from the background MC samples with a single normalization parameter in fitting the signal region.
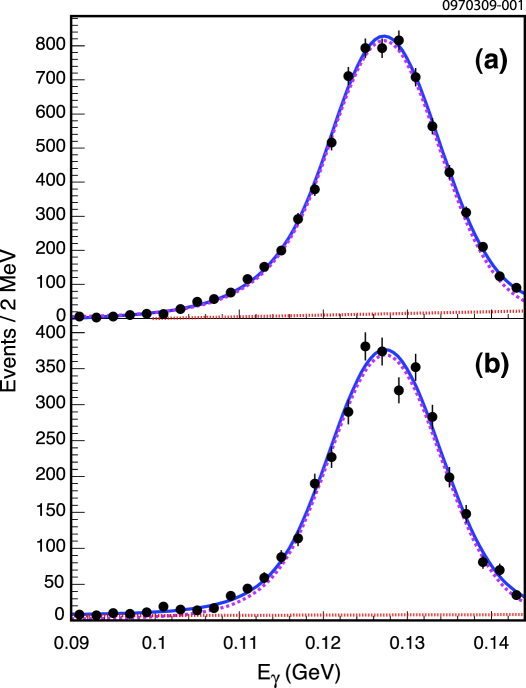
For the study, the event selection criteria are applied, except that the transition photon is required to be in the energy range of and no requirement is applied. Figure 2 shows the shower energy distributions for the and final states. The transition photon signal is well fitted, validating the MC-determined resolution function. Table 2 lists the number of signal events observed and, for comparison, the number of events expected for our sample using branching fractions from the PDG PDG2007 . The efficiencies are determined from signal MC samples for each hadronic final state, where the generated angular distribution of the decay is (which assumes a pure E1 transition EichtenE1 ), while the is decayed according to phase space. The energy resolution for the transition photon, determined from the signal MC samples, is 6.2 MeV. Since the substructure of the decays and the systematic uncertainties of these measurements are not evaluated, these yields are presented only as a cross-check of the yield determination procedure and not as measurements of the decays.
| Channel | ||||
|---|---|---|---|---|
| — | — | — | ||
| — | — | — | ||
| — | — | — | ||
| — | ||||
The numbers of observed events listed in Table 2 are consistent with the PDG PDG2007 , with the exception of the final state. The value listed by the PDG for comes from one measurement BESIchic2 . The same paper presents a measurement for that leads to an expectation of observed events, well below both the PDG expectation and our measurement. The ratios of the current yields to those derived from Ref. BESIchic2 are and for the and final states, respectively. Our observed yield for the final state is consistent with the current PDG value for , which is determined from a 28-parameter fit using properties of the and . While further measurements may clarify the discrepancy, we conclude that the study satisfactorily validates our yield determination procedure.
IV Yield Determinations
Figures 3 - 5 show the measured energy distributions of the transition photon candidates in the signal region. The photon energy resolution in this region, determined from the signal MC samples, is 4.6 MeV. No significant signal is observed in any mode. The decay mode is the only mode in which an excess above background is present. We have investigated other aspects of the events in the signal region and found that this excess, which has a statistical significance of slightly more than 3 standard deviations, is most likely caused by an upward fluctuation of the background KaiyanThesis .
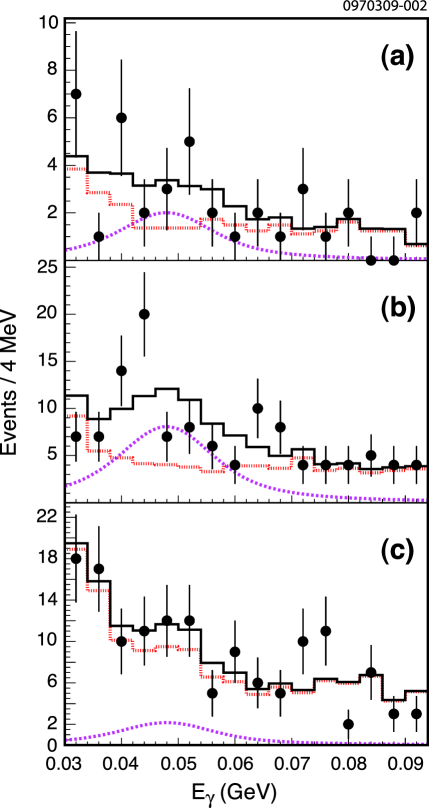


For the final states that do not include an decay, the signal yield upper limits are determined by finding the value corresponding to of the probability distribution determined from the measurement, restricted to physically allowed values. The yield measurements are listed in Table 3.
| /d.o.f. | Systematic uncertainties (%) | () | |||||||||
|---|---|---|---|---|---|---|---|---|---|---|---|
| Channel | A | B | C | D | E | Other | Total | (90% C.L.) | |||
| 9.7/14 | 15.2 | 16.9 | 12.2 | 13.3 | 8.2 | 5.6 | 30.7 | 14.5 | |||
| 14.1/14 | 2.5 | 6.1 | 11.8 | 11.7 | 4.4 | 5.0 | 19.1 | 14.6 | |||
| 11.2/14 | 16.6 | 20.4 | 14.6 | 12.1 | 3.6 | 5.1 | 33.0 | 13.2 | |||
| 9.2/14 | 7.7 | 32.6 | 7.1 | 13.8 | 4.4 | 4.5 | 37.2 | 9.6 | |||
| 13.8/14 | 22.7 | 15.2 | 29.7 | 24.5 | 0.9 | 7.2 | 47.8 | 43.0 | |||
| 13.2/14 | 0.8 | 6.8 | 14.8 | 11.0 | 4.3 | 5.3 | 20.8 | 9.7 | |||
| 11.9/14 | 13.2 | 17.8 | 16.3 | 5.6 | 5.2 | 5.0 | 29.0 | 15.2 | |||
For the final states that include an decay, which have very low statistics, the method of Feldman and Cousins FeldmanCousins is used and only 90% confidence level upper limits are determined. The shower energy distribution is divided into two regions: a signal region () corresponding to one full width about the mass PDG2008 and a sideband region (). The sideband region is fitted with the shape from the background MC samples and the resulting normalization is used to compute the number of background events in the signal region, listed as in Table 4. The number of observed events in the signal region is given as .
| Systematic uncertainties (%) | ||||||||
|---|---|---|---|---|---|---|---|---|
| Channel | (90% C.L.) | A | B | C | Other | Total | (90% C.L.) | |
| 75.4 | 6.1 | 46.5 | 3.0 | 8.1 | 47.7 | 4.3 | ||
| 115.7 | 9.2 | 29.8 | 3.9 | 7.6 | 32.3 | 5.9 | ||
| 287.9 | 8.9 | 24.5 | 3.7 | 7.4 | 27.3 | 14.2 | ||
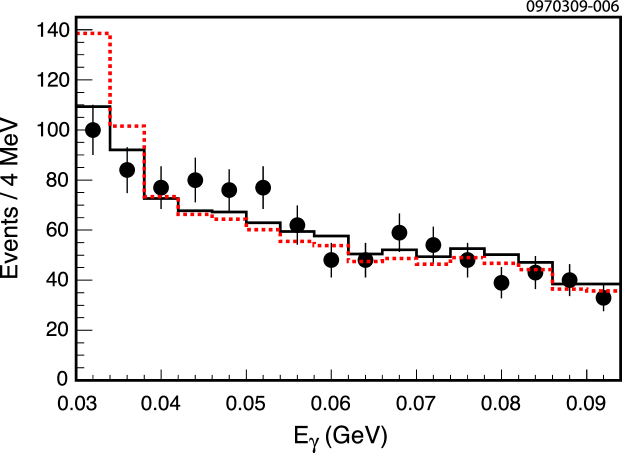
Figure 6 shows the summed shower energy distribution for the ten decay channels. The background distribution in Fig. 6 (dotted histogram) has been constructed by adding mode-by-mode background-only fits. It shows a visible overestimate compared to the data distribution in the lowest energy bins, which we attribute to the modeling of the split-off distribution. The alternative treatment using the two-parameter background MC fit described in Sec. III (solid histogram) reproduces the low-energy range noticeably better. While there may be a small excess in the signal region above the estimated background with the two assumed background shapes, the statistical significance is less than 3 standard deviations and is dependent on the background shape.
V Sources of Systematic Uncertainty
The sources of systematic uncertainty in our measurements of branching fractions have been evaluated by reanalyzing the and candidate samples with alternative procedures. They are listed in Tables 3 and 4 and described in detail below. All individual uncertainties not explicitly listed in the tables are combined in quadrature and listed as “Other.” The uncertainty in the number of decays in our sample (2% numpsi2s ) also affects the branching fraction determinations. Other uncertainties in the detection efficiencies that have been evaluated include those associated with trigger decisions (1%), reconstruction of the transition photon (2%) and other particles, and PID.
The particle reconstruction and PID uncertainties have been estimated using 281 pb-1 of data collected at the peak of the resonance DHadPaper . Reconstruction uncertainties are determined by detecting all particles in an event except the particle being investigated, determining the efficiency for reconstructing the particle in data and MC simulations, and taking the difference as the systematic uncertainty. These studies find uncertainties of 0.3% per charged pion, 0.6% per charged kaon, 1.8% per , and 2.0% for reconstruction of the decays of and . The uncertainties associated with PID are determined by comparing the efficiency differences between data and MC simulations after applying the PID criteria. The uncertainties are found to be 0.25% (0.3%) per charged pion (kaon).
The uncertainties determined from studying decays described below are found one by one by removing the selection criterion being investigated, redetermining the efficiency-corrected yield, and taking the relative difference between this and the nominal case as the systematic uncertainty. For suppression using the recoil mass, the uncertainties for the , , and final states are 2.4%, 2.2%, and 1.3%, respectively; they are less than 1% for other modes. For suppression using the invariant mass of the decay products, the uncertainties for the and hadronic final states are 1.0% and 1.5%, respectively; they are less than 1% for other modes. An uncertainty of 2.4% is assigned to the requirement on the angle between the initial pion momentum and the candidate photon based on studies of decays. An uncertainty of 0.8% is assigned to the requirement on the distance between a transition photon candidate and the nearest track in the CC based on studies of decays. An uncertainty of 2.3% is assigned for suppressing transition photons from decays in selecting and candidates by studying . An uncertainty of 1.3% is conservatively assigned for the requirement on the vertex fit by taking the uncertainty from the decay mode with the largest discrepancy. An uncertainty of 4.0% (2.2%) is conservatively assigned to the full event fit by taking the largest deviation from the decay mode with (without) a or decay.
The uncertainties associated with the detector resolution and minimum shower energy for the signal region are determined by varying these parameters in the study of decays. The uncertainties are assigned by recalculating the efficiency-corrected yield and taking the difference from the nominal case. The detector resolution uncertainty is determined by individually varying the width of the core Gaussian and the transition point between the core Gaussian and the power law tail of the Crystal Ball function by 1 standard deviation, resulting in a total uncertainty of 1.0%. An uncertainty of is assigned to the minimum photon energy requirement by increasing the lower bound from 90 to 110 MeV, corresponding to the same difference (18 MeV) between the minimum energy and the mass in the signal region.
The uncertainties associated with selecting and decays based on the invariant mass of the decay products and the recoil mass used for suppression are determined by studying decays. The individual uncertainties are assessed by varying the respective mass range to double the detection inefficiency, redetermining the efficiency-corrected yield, and assigning the difference between this and the nominal result as the systematic uncertainty. An uncertainty of 1.3% is assigned for the invariant mass selection range in the and decay modes. An uncertainty of 1.2% is assigned to the invariant mass selection range for the decay mode. Uncertainties of 3.7% and 0.2% are assigned to the recoil mass suppression range for the and decays, respectively, comprising the decay mode.
The largest systematic uncertainties in all decay modes arise from the selection criterion, the parameterization of the background shape, and the uncertainty in the mass, which are listed as separate entries in Tables 3 and 4. They are estimated by varying the criterion being investigated, redetermining the efficiency-corrected yield upper limit in the signal region, and assigning the difference between this and the nominal result as the systematic uncertainty. The uncertainty associated with the criterion is determined by removing the cut. The uncertainty arising from the background modeling for the decay modes without an decay is determined by replacing the background determined from the background MC samples with a first-order polynomial. The uncertainty arising from the background modeling for the decay modes with an decay is determined by lowering the overall background yield in the signal region by 1 standard deviation based on the data yield in the sideband region. The effect of the uncertainty of the mass is determined by 1 standard deviation variations of the mass, , in the fits of the measured shower energy distributions and the determination of the detection efficiencies, with the larger discrepancy from the two cases being assigned as the systematic uncertainty.
Additional systematic uncertainties in decay modes without an decay arise from the signal region range and the nonresonant component of the background, which are listed as separate entries in Table 3. The uncertainty associated with the maximum boundary of the signal region is assessed by varying the boundary by 8 MeV, with the larger deviation from nominal of the two cases being assigned as the systematic uncertainty. The uncertainty associated with the minimum boundary of the signal region described above is combined in quadrature to obtain the signal region uncertainties listed in Table 3. The uncertainty arising from the nonresonant component of the background was investigated by determining the ratio of event yields in the 20.6 pb-1 of off-resonance data collected at = 3.67 GeV with the yields from a 5 times luminosity continuum MC sample generated at the same center-of-mass energy. The same event selection criteria were applied as for the signal search with the exception that was redefined as . The uncertainty was assessed by repeating the fits of the signal region but with the continuum MC component of the background fixed to the ratio found in the off-resonance data sample study. The difference between the signal yields from this and the nominal result was assigned as the systematic uncertainty. No systematic uncertainties were applied to the decay modes due to the small amount of nonresonant background.
Tables 3 and 4 summarize the total systematic uncertainties. The individual uncertainties are treated as uncorrelated and are combined in quadrature to obtain the overall systematic uncertainties in the product branching fraction upper limits. The total uncertainty for composite decay modes is determined by weighting the total systematic uncertainty of each constituent decay mode by its branching fraction.
In addition to these sources of error, the partial width for a direct M1 radiative transition between and is related to the matrix element governing the spin-flip transition and the energy of the transition photon by
| (3) |
This implies a signal shape given by a Breit-Wigner times function, rather than the Breit-Wigner function that was used for our fits. We studied the effect of using this modified signal shape on the product branching fractions with the following procedure. For the determination of yields in modes without an decay, the signal regions were fitted with Breit-Wigner times functions convoluted with Crystal Ball detector resolution signal shapes and the histogram backgrounds used in the nominal results. The nominal yields were used for modes with an decay. The efficiency for each mode was determined by applying the nominal event selection criteria to signal MC samples generated with signal shapes that were Breit-Wigner distributions multiplied by . Since there is no obvious choice of damping function as there was for the ground state resonance Mitchell:CLEOjpsitoetac , we use an arbitrary cutoff on the maximum allowed photon energy. With this procedure, we find deviations in the product branching fractions that are on the order of, and in some cases greater than, the other uncertainties. Because of the arbitrary cutoff, it is difficult to assign a systematic uncertainty to this effect, and we have chosen not to include it.
VI Branching Fraction Results
The upper limits on the number of signal events are used to set upper limits on the product branching fractions. The product branching fraction for each decay mode is determined by Eq. (2), where is the number of signal events and . Because no statistically significant signals are observed in any of our ten decay channels, we use the efficiency-corrected yields to set upper limits on the product branching fractions. Systematic uncertainties are determined and combined as described in Sec. V and added to the statistically calculated product branching fraction upper limits. The final results are given in Tables 3 and 4.
Upper limits for the product branching fraction are also determined as a function of the full width, for which the current world average is PDG2008 . Separate signal MC samples with 7 and 21 MeV/ were generated in the same manner as the nominal MC samples. The measured shower energy distributions are fitted in the same manner as for the standard yield determination procedure, but with the resolution functions determined from these MC samples and the full width of the signal shape adjusted to match the full width being investigated. The linear extrapolation of the product branching fraction as a function of is listed in Table 5 for each decay mode.
| Channel | ||
|---|---|---|
| 6.6 | 0.56 | |
| 6.5 | 0.58 | |
| 4.0 | 0.74 | |
| 3.1 | 0.50 | |
| 15.5 | 2.09 | |
| 5.2 | 0.34 | |
| 8.5 | 0.51 | |
| 2.9 | 0.09 | |
| 4.1 | 0.13 | |
| 10.0 | 0.31 |
VII Search for
In addition to searching for decays to light hadrons, a search for the decay process is also performed. The four hadronic final states of , , , and plus a candidate transition photon are used for this study. The selection criteria are the same as described above, except that the rejection criterion based on the recoil mass is removed and we require the hadronic decay products not associated with the dipion transition to be within 40 MeV/ of . Information from the recoil mass is not used since the distribution is broadened by the intrinsic widths of the and . Figure 7(a) shows the invariant mass of the candidates.
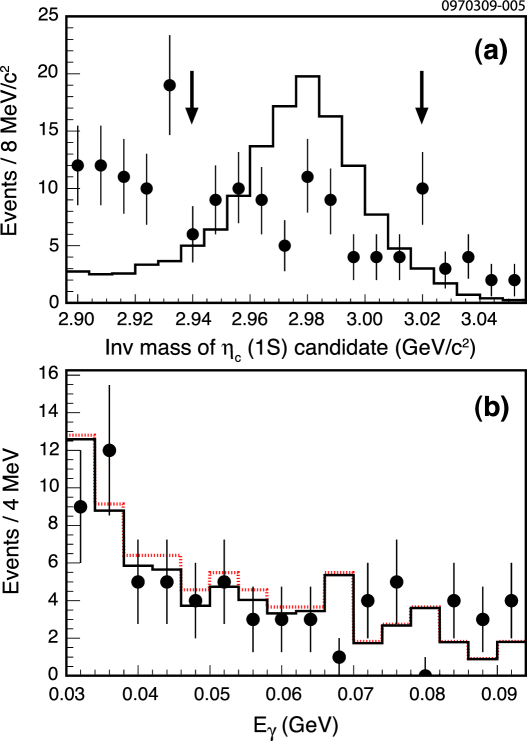
Figure 7(b) shows the measured shower energy distribution after applying the selection criterion. No evidence of a signal is observed. The /d.o.f. of the fit is 19.5/14. The number of signal events is , corresponding to an upper limit of (90% C.L.).
The upper limit on the product branching fraction is determined by
| (4) |
where, for a given final state , is the detection efficiency and is the branching fraction for the decay. The signal efficiency for each decay mode is determined from signal MC samples. The decay is generated in the same manner as described in Sec. II. The decay is generated according to phase space with the parameters and PDG2007 . The individual values used to determine are listed in Table 6.
| Decay Mode | (%) | (%) | (%) |
|---|---|---|---|
Several sources of systematic uncertainty in the measurement have been evaluated. The uncertainty due to the invariant mass range used to select candidates is determined by tightening the mass range to double the detection inefficiency, redetermining the product branching fraction upper limit, and assigning the relative difference between this and the nominal result as the systematic uncertainty. The effect of the uncertainty of the full width is determined by generating separate signal MC samples with 23 and 30 MeV, i.e., 1 standard deviation variations of PDG2007 , to redetermine the detection efficiencies and repeating the yield determination procedure with the resolution functions determined from these MC samples. The uncertainties associated with the criterion, background parameterization, uncertainty, signal region, and nonresonant background component are evaluated by performing the procedures described in Sec. V. The systematic uncertainties associated with the number of decays, trigger efficiency, particle reconstruction, PID, full event and vertex fitting, and the suppression of transitions to other charmonium states for these specific final states are assigned as described in Sec. V. Table 7 lists the individual contributions to the total systematic uncertainty of the product branching fraction.
| Source | Uncertainty (%) |
|---|---|
| Nonresonant background | 28.6 |
| 22.0 | |
| Signal region | 20.7 |
| 14.0 | |
| 11.1 | |
| 7.9 | |
| 4.1 | |
| Background parameterization | 1.5 |
| Other | 5.5 |
| Total | 46.5 |
The product branching fraction for , assuming and including statistical and systematic uncertainties, is (90% C.L.). Expressed as a function of , the upper limit is .
VIII Summary and Conclusions
In summary, we do not observe the transition with any of the ten exclusive decays to light hadrons. We also do not observe evidence for the decay process . Our original objectives for measuring the properties of the cannot be achieved with this data sample, and only upper limits for the product branching fractions are obtained.
The BaBar Collaboration recently reported a branching fraction of Aubert:2008kp , where the systematic uncertainty is dominated by the inclusive measurement of InclEtac2S . Using the central value of and our 90% confidence level upper limit of leads to , which is larger than the phenomenological prediction of .
The measurement can also be used to determine upper limits of hadronic decays based on published searches. The two-photon fusion result reported by the CLEO Collaboration cleo2004fusion and the measurement lead to a two-photon partial width of keV. Using this value of with the recent two-photon fusion upper limits for production from the Belle Collaboration BelleGG , we find and (90% C.L.). These upper limits are an order of magnitude smaller than the branching fractions obtained by assuming that the partial widths for decays are the same as for , i.e., and , where the first error is the uncertainty from the branching fraction and the second error is the uncertainty from PDG2008 .
IX Acknowledgments
We gratefully acknowledge the effort of the CESR staff in providing us with excellent luminosity and running conditions. D. Cronin-Hennessy and A. Ryd thank the A.P. Sloan Foundation. This work was supported by the National Science Foundation, the U.S. Department of Energy, the Natural Sciences and Engineering Research Council of Canada, and the U.K. Science and Technology Facilities Council.
References
- (1) S.-K. Choi et al. (Belle Collaboration), Phys. Rev. Lett. 89, 102001 (2002).
- (2) D. M. Asner et al. (CLEO Collaboration), Phys. Rev. Lett. 92, 142001 (2004).
- (3) B. Aubert et al. (BaBar Collaboration), Phys. Rev. Lett. 92, 142002 (2004).
- (4) B. Aubert et al. (BaBar Collaboration), Phys. Rev. D 72, 031101 (2005).
- (5) C. Edwards et al. (Crystal Ball Collaboration), Phys. Rev. Lett. 48, 70 (1982).
- (6) S. B. Athar et al. (CLEO Collaboration), Phys. Rev. D 70, 112002 (2004).
- (7) E. Eichten, K. Gottfried, T. Kinoshita, K. D. Lane, and T. M. Yan, Phys. Rev. D 17, 3090 (1978); V. Zambetakis and N. Byers, Phys. Rev. D 28, 2908 (1983); H. Grotch, D. A. Owen, and K. J. Sebastian, Phys. Rev. D 30, 1924 (1984); S. Godfrey and N. Isgur, Phys. Rev. D 32, 189 (1985); X. Zhang, K. J. Sebastian, and H. Grotch, Phys. Rev. D 44, 1606 (1991); E. Eichten, K. Lane, and C. Quigg, Phys. Rev. Lett. 89, 162002 (2002); D. Ebert, R. N. Faustov, and V. O. Galkin, Phys. Rev. D 67, 014027 (2003); T. A. Lähde, Nucl. Phys A 714, 183 (2003); T. Barnes, S. Godfrey, and E. S. Swanson, Phys. Rev. D 72, 054026 (2005); S. F. Radford and W. W. Repko, Phys. Rev. D 75, 074031 (2007).
- (8) C. Amsler et al. (Particle Data Group), Phys. Lett. B 667, 1 (2008).
- (9) R. E. Mitchell et al. (CLEO Collaboration), Phys. Rev. Lett. 102, 011801 (2009).
- (10) R. A. Briere et al. (CLEO-c/CESR-c Taskforces CLEO-c Collaboration), Cornell University LEPP Report No. CLNS 01/1742 (2001) unpublished; Y. Kubota et al., Nucl. Instrum. Methods Phys. Res., Sect. A 320, 66 (1992); D. Peterson et al., Nucl. Instrum. Methods Phys. Res., Sect. A 478, 142 (2002); M. Artuso et al., Nucl. Instrum. Methods Phys. Res., Sect. A 554, 147 (2005).
- (11) D.J. Lange, Nucl. Instrum. Methods Phys. Res., Sect. A 462, 152 (2001).
- (12) R. Brun et al., GEANT 3.21, CERN Program Library Long Writeup W5013 (1993) unpublished.
- (13) E. Barberio and Z. Was, Comp. Phys. Commun. 79, 291 (1994).
- (14) W.-M. Yao et al. (Particle Data Group), J. of Phys. G 33, 1 (2006) and 2007 partial update for the 2008 edition.
- (15) T. Sjöstrand et al., Comp. Phys. Commun. 135, 238 (2001).
- (16) E. Eichten, S. Godfrey, H. Mahlke, and J. L. Rosner, Rev. Mod. Phys. 80, 1161 (2008).
- (17) T. Skwarnicki, Ph. D. thesis, Institute of Nuclear Physics, Krakow, Poland, 1986, Appendix E, DESY F31-86-02 (1986).
- (18) K. Gao, Ph. D. thesis, University of Minnesota, 2008, arXiv:0909.2812[hep-ex].
- (19) E. Eichten et al., Phys. Rev. Lett. 34, 369 (1975).
- (20) J. Z. Bai et al. (BES Collaboration), Phys. Rev. D 60, 072001 (1999).
- (21) G. J. Feldman and R. D. Cousins, Phys. Rev. D 57, 3873 (1998).
- (22) H. Mendez et al. (CLEO Collaboration), Phys. Rev. D 78, 011102 (2008).
- (23) S. Dobbs et al. (CLEO Collaboration), Phys. Rev. D 76, 112001 (2007).
- (24) B. Aubert et al. (BaBar Collaboration), Phys. Rev. D 78, 012006 (2008).
- (25) B. Aubert et al. (BaBar Collaboration), Phys. Rev. Lett. 96, 052002 (2006).
- (26) S. Uehara et al. (Belle Collaboration), Eur. Phys. J. C 53, 1 (2008). They report and at 90% C.L.