Statistics of polymer adsorption under shear flow
Abstract
Using non-equilibrium Brownian dynamics computer simulations, we have investigated the steady state statistics of a polymer chain under three different shear environments: i) linear shear flow in the bulk (no walls), ii) shear vorticity normal to the adsorbing wall, iii) shear gradient normal to the adsorbing wall. The statistical distribution of the chain end-to-end distance and its orientational angles are calculated within our monomer-resolved computer simulations. Over a wide range of shear rates, this distribution can be mapped onto a simple theoretical finite-extensible-nonlinear-elastic dumbbell model with fitted anisotropic effective spring constants. The tails of the angular distribution functions are consistent with scaling predictions borrowed from the bulk dumbbell model. Finally, the frequency of the characteristic periodic tumbling motion has been investigated by simulation as well and was found to be sublinear with the shear rate for the three set-ups, which extends earlier results done in experiments and simulations for free and tethered polymer molecules without adsorption.
I Introduction
Adsorption of macromolecules in flowing fluids arises in countless practical or potential applications. For instance the process of implanting bio-tissues happens in the shear flow field of the blood stream and represents a key challenge Ratner_ARBE2004 in the cure of disabilities due to malfunctioning organs. In gene therapy, the transport of DNA to a desired target site is an another big challenge. Felgner_SCI_Am97_276 The control of proteins changing their biofunctionality during adsorption to surfaces Rusmini_BM2007 is also a quite interesting topic for biotechnical application. Furthermore, the influence of adsorption under flow is important in microfluidic devices. Pfohl For example, shear flow generates stretched polymer chains which can be used for microcircuit construction from single molecules. Braun_Nature98_391 ; Knobloch
Experimentally, polymers under shear flow have been investigated for many decades. Kotaka_JCP66_45 ; Huppler_TSR67_11 ; Tiu_RA95_34 ; Marko_MM95_28 ; Rivetti_JMB96_264 ; Smith_sci99_283 ; Ladoux_EPL_2000 ; Minko_JACS_02_124 ; Kirwan_NanoL04_4 ; Shaqfeh_JNNFM05_130_1 ; PNAS_Schneider2007_104 ; He_SoMa09 Due to both an elongational and a rotational components stemming from the flow inhomogeneity, the dynamics or statistics of sheared molecules is complex. Tumbling motion was recently addressed experimentally in the bulk, Schroeder_PRL_2005 ; Teixeira_MM05_38 ; Gerashchenko_PRL_2006 but not for adsorbed polymers.
On the theoretical side, Hinch has developed a theory for a continuous flexible string under shear flow, Hinch_JFM76_74 and also examined the effect of weak Brownian motion on the polymer. Hinch_JFM76_75 Recently, analysing the statistics of the chain end-to-end extension and orientation, Chertkov and co-workers have addressed the polymer tumbling motion under shear flow. Chertkov_JFM05_531 Furthermore, Winkler has analytically studied the dynamics of semiflexible polymers under the influence of shear flow. Winkler_PRL06_97_128301 Numerical studies based on a simple polymer dumbbell in linear shear flows have been carried out to analyze the cyclic motion by Celani et al. Celani_EPL05_464 and Puliafito et al. Puliafito_PD05_211 . As far as computer simulations on the tumbling motion are concerned, free chains Schroeder_PRL_2005 ; Aust_MM02_35_8621 ; Liu_P04_45_1383 and end-tethered polymers Rafael_PRL_2006 ; Mueller_EPL08_81_28002 and confined polymers in microchannels Winkler_EPL08_83_34007 were considered.
Although the statistics of the polymer end-to-end extension and angular orientation have been investigated experimentally and theoretically in the past, most of the relative work is essentially focused on the bulk case. In this paper, our main goal is to address these properties for an adsorbed polymer chain under linear shear flow. For a pulled adsorbed chain, a simulation study was recently performed in ref Serr_EPL07_78_68006 . The problem of the adsorbed case is more complex than in the bulk since adsorption will interfere and compete with tumbling motion in the shear flow. Moreover, the chain conformational behaviour will depend on the direction of the shear flow relative to the adsorbing substrate. For a planar adsorbing wall, there are two basic possibilities for the shear flow direction: the shear gradient can be directed either perpendicular or parallel to the adsorbing wall.
In this work, we consider these two cases in conjunction with the bulk system as a reference and calculate the probability distribution function (PDF) of the chain extension by using monomer-resolved Brownian dynamics computer simulations. We find that the PDF of the polymer chain extension can be mapped by a simple theoretical finite-extensible-nonlinear-elastic (FENE) dumbbell model via two fit parameters, namely an effective shear rate and an effective spring constant. The tails of the angular PDFs obtained by the simulations are in good agreement with theoretical predictions stemming from the bulk. Surprisingly, they fit even better than in the bulk for a wide shear rate regime when the shear gradient is directed parallel to the adsorbing wall. For the situation where the shear gradient is perpendicular to the wall, disturbances of the bulk fluctuations due to wall adsorption lead to significant deviations from a simple dumbbell model. We also explore the inner bond-bond angles of the chain and the frequency of the characteristic periodic tumbling motion which was found to be sublinear with the shear rate. This extends earlier experimental and simulation studies for free and tethered polymer molecules without adsorption.
The outline of this article is as follows: Section II describes the details of the simulation model. Section III contains the results, in which section III.1 deals with the statistics of the chain extension; III.2 shows the angular degrees of freedom (for in-adsorption-plane and off-adsorption-plane orientations, respectively); III.3 is discussing the shear rate dependency of the bond-bond angle; and the last part III.4 is devoted to analysis of the tumbling motion frequency. Finally, a summary of our work is presented and discussed in section IV.
II The model
This section provides details about our polymer chain model employed in non-equilibrium Brownian dynamics (BD) computer simulations. Doyle_MM98_31_5474 ; Neelov_MTS95_4_119 The macromolecular chain is made up of a linear sequence of coarse-grained bead-spring monomers, which are labeled . Thereby, the equation of motion of the -th monomer located at a position at time is given by the finite integration scheme
| (1) |
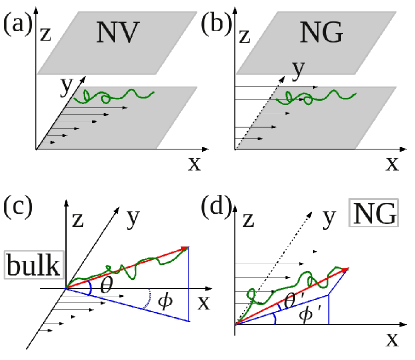
where is the updated bead position at a later time . Hydrodynamic interactions are neglected. Hoda_JCP07_127_234902 We now explain in details all the constitutive terms of Eq. (1). , and stand for the free diffusion constant, Boltzmann’s constant and the absolute temperature, respectively. The vector is the total conservative force that will be fully described later. is the Gaussian stochastic displacement with zero mean and variance for each Cartesian component. The last term in Eq. 1 stems from the contribution of the shear flow being in the -direction, with denoting the corresponding unit vector, and the shear rate. in Eq. 1 can be either or depending on the chosen shear gradient direction. More precisely, (i) refers to a normal vorticity (NV) direction perpendicular to the adsorbing wall, as sketched in Fig. 1(a); (ii) corresponds to a normal gradient (NG), see Fig. 1(b). In other words, the shear gradient is in-plane with the adsorbing wall for the NV case whereas it becomes off-plane for the NG case. The aforementioned conservative force has three contributions:
-
1.
Steric effects (monomer-monomer and wall-monomer repulsive interactions) are taken into account via a truncated and shifted purely repulsive Lennard-Jones potential of the form
(2) with a cutoff at its minimum . Here the bead diameter and the strength of the interaction represent the energy and length units, respectively.
-
2.
The “spring” is modeled via a finite extensible nonlinear elastic (FENE) Kremer_Grest potential to ensure the connectivity between adjacent beads along the backbone, which is given by
(3) where the FENE cut-off (i.e. the allowed maximum bond length) is set to and the spring constant is .
-
3.
To mimic the adsorption process, a strongly attractive wall defining the -plane at is considered. Thereby, we employed a Van der Waals-like attractive potential
(4) with . A more detailed modeling for a realistic surface was used e.g.in ref Andrienko_MM05_38_5810 .
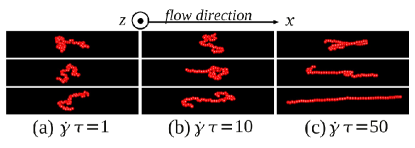
The BD time step is set to , where sets the time unit. Typically BD time steps are used for data production, during which the first steps are for the chain relaxation. [Note 1] 11footnotetext: Given the strong adsorption, the NG case (normal shear gradient) requires more computational time for good statistics, so that even BD steps were used. Simulation snapshots are viewed in Fig. 2.
III Results
III.1 Statistics of the polymer extension
We consider a single polymer chain which is advected by a shear flow and stretched by velocity inhomogeneity. The degree of the polymer stretching is characterized by the chain’s end-to-end distance , for which we have calculated the probability distribution function (PDF) under different shear flow geometries.
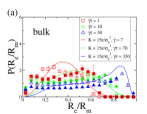
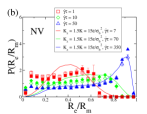
The normalized PDF of the rescaled size extension , where is the fully stretched chain length, is plotted in Fig. 3 for three typical selected shear rates () for three geometries: (a) bulk, (b) NV, in-plane shear gradient and (c) NG, vertical shear gradient. [Note 2] 22footnotetext: In the figures of the results section, all the error bars were calculated using five (for the bulk case) and ten (for NV and NG) independent simulation runs.
A general feature is that upon increasing the shear rate, chain stretching is always favored. In terms of size distribution, this shear-rate induced stretching manifests itself either as a shift of the peak to larger sizes (see Fig. 3(a,b)), and/or as a thickening of the tail (see Fig.3(c)). The strongest stretching, at prescribed reduced shear rate , is obtained for the NV case. This feature can be simply explained as follows. The NV case, due to the rather strong adsorption, leads to a chain swelling (in the lateral dimensions) compared to the bulk conformations already at equilibrium (i.e., without shear flow). To elucidate this idea, we have also systematically shown the purely two-dimensional case (filled symbols) in Fig. 3(a,b) as a reference. Moreover, for the NV case, the shear flow deforms the polymer chain much more efficiently than in the NG case, where the shear rate gradient direction is off plane. Clearly, deformations occur in the NG case because of temperature-induced fluctuations in the heights of the monomers.
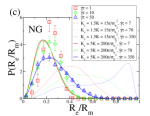
To broaden our understanding of the statistics of the polymer chain under shear flow, we have additionally considered the well known so-called FENE-dumbbell model. Celani_EPL05_464 The equation, describing the evolution of the end-to-end vector of a FENE-dumbbell (i.e., a dimer), is given by
| (5) |
where is the FENE force; is the Gaussian term as in eq. 1; is the (or ) component (or ) of assuming the shear gradient applied in the (or ) direction. To take adsorption into account in the most simple and physically sound manner within the dumbbell model, we have introduced anisotropic FENE-spring constants such that in the bulk and for NV and NG cases. The stochastic equation (5) was solved by using a straightforward one-particle BD scheme integration. One has to bear in mind that this dumbbell approach is certainly relevant in the limit of strong stretching, where the degrees of freedom of “inner” monomers of a real polymer chain would be indeed heavily reduced, but can not be suitable at low shear rates where the real chain size is dictated by the complicated distribution of the monomers.
By choosing a suitable choice of parameters (effective spring constant(s), effective shear rate) for the dumbbell model, one could always perfectly match any PDF of the fully monomer resolved chain (results not shown). However, in order to make the comparison more physical between the dumbbell model and the fully monomer resolved chain, we kept the spring dumbbell constant fixed as well as the ratio between the shear rates, see Fig. 3 (). Given the very crude representation of the chain via a dumbbell, Fig. 3(a,b) shows a remarkable good agreement between BD data and the dumbbell model, especially at high shear rates and/or large chain size. The good agreement between these two approaches in Fig. 3(b) for the NV case also demonstrates that the idea of mimicking the adsorption with a larger dumbbell-spring constant in the -direction is fruitful. Nonetheless, the NG case is too complex to be captured by our simple dumbbell model. Indeed, physically, the deformation in this situation is due to the -fluctuations of the chain-monomers which can not be suitably approximated by a dumbbell. However, if we consider a stiffer (effective) dumbbell with for the NG case, we can recover again a good agreement with the BD data, see Fig. 3(c).
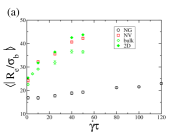
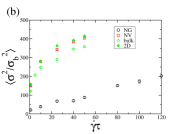
To further characterize the statistics of the adsorbed chain under shear flow, we have calculated the first three moments of the end-to-end size distributions (the PDF in Figure 3), which are (i) the mean value , (ii) the variance , and (iii) the normalized third moment (so-called skewness, ).
The mean value of the end-to-end distance is obtained as follows
| (6) |
where is the absolute value of the end-to-end vector in the th configuration and the sum runs over the total number of the configurations . Figure 4(a) shows that grows with increasing (), as expected. Nevertheless, in the NG case, the shear rate dependency of the end to end distance is relatively weak compared to the other flow geometries.
The second moment, which describes the degree of broadening about the mean value, is defined as follows
| (7) |
Figure 4(b) clearly shows that the variance grows with increasing shear rate. This effect is actually due to the tumbling (more on that later) allowing the chain to cyclically stretch and recover its coil-like conformation. Thereby, the higher the shear rate the more stretched the chain can be, and consequently the larger the variance becomes. In the NG case, where stretching at prescribed shear rate is much weaker, the broadening of the size distribution is reduced accordingly.
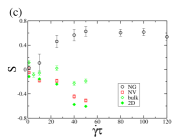
The skewness , a central quantity in probability theory and statistics, skewness is defined as , where is the third moment with respect to the mean, and is the standard deviation. Explicitly, the skewness was computed as follows
| (8) |
It provides a quantitative and simple measure of the asymmetry of the probability distribution function. Hence, the qualitative difference between the PDF in the NG model (see Fig. 3(c)) and those found in the other cases (see Fig. 3(a)(b)) can be rationalized in terms of the value as well as the sign of , see Fig. 4(c). For the shear gradient normal to the wall (NG), Fig. 4(c) shows that is positive and increases with shear rate. The positivity of () is a signature of the statistical preponderance of the coil-sized chain configurations in the NG model. On the other hand, the skewness becomes negative and decreases (i.e., its magnitude increases) with growing shear rate in the NV model. This feature clearly indicates the preponderance of stretched chain conformations.
III.2 Statistics of the polymer end-to-end vector orientations
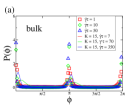
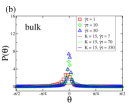
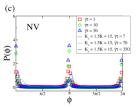
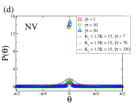
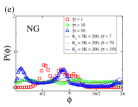
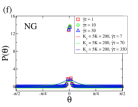
We now address the angular degrees of freedom of the end-to-end polymer chain vector, namely and (depicted in Fig. 1(c)), or and (depicted in Fig. 1(d)), with respect to the prescribed shear flow -direction as well as the shear gradient direction. Whereas corresponds to the usual azimuthal angle, is not the polar angle but rather the angle formed between and the plane containing the shear- and the gradient-direction, see Fig. 1(c,d). Thereby we have kept the same (well established) definitions used in earlier publications. Hinch_JFM72_52 ; Chertkov_JFM05_531 The results for the angular distribution functions are shown in Fig. 5. As far as the azimuthal angle distribution is concerned, BD simulation data as well as the dumbbell model show a strong probability peaks in the vicinity of in the bulk (Fig. 5(a)) and the NV case (Fig. 5(c)). Interestingly the corresponding peak heights are not identical and, in fact, decrease with growing angles. The simple underlying physical mechanism accounting for this effect is that the torque, (resulting from the shear gradient Schroeder_PRL_2005 ), exerted on the chain favors more the conformations with than those with . This finding of the asymmetry in , although unexplained, was also reported in the earlier work of Celani et al. Celani_EPL05_464 . Moreover, the larger the shear rate , the narrower the density probability becomes around the flow (-axis) direction, see Fig. 5(a,c). However, the PDFs are somewhat different for the NG case, see Fig. 5(e), due to the shear gradient direction being off-plane hereby.
As far as the PDFs are concerned, the shear flow induces a concentrated distribution around for all shear flow geometries, see Fig. 5(b,d,f). [Note 3] 33footnotetext: Note that the symmetry of the shear flow imposes a symmetry of about . The narrowness of the peak increases again with the shear rate, as expected.
In a general manner, the agreement between our simulation data and the dumbbell model (see Fig. 5) is not as satisfactory as that found for the size distribution (compare with Fig. 3). This is quite acceptable, given the crudeness of the dumbbell model. Nonetheless, the essential feature of strong depletion zones in the angular PDFs, are qualitatively well captured by this dumbbell model.
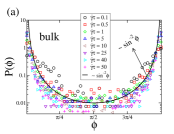
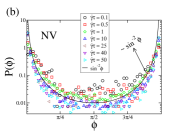
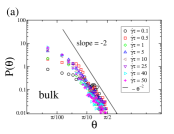
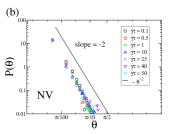
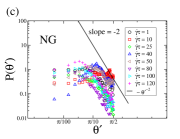
The angular distribution functions were also recently studied analytically by Chertkov et al. Chertkov_JFM05_531 for a linear dumbbell in the bulk. It was thereby found to obey the following scaling law Chertkov_JFM05_531 , which was experimentally confirmed by Gerashchenko and Steinberg. Gerashchenko_PRL_2006 To establish a comparison between our simulation data and this theoretical prediction, the PDFs are plotted for a wider range of the shear rate on a linear-logarithmic plane in Fig. 6. A good agreement is found between the simulation and the scaling prediction. This is a remarkable result, since a simple harmonic dumbbell model can capture the correct scaling behavior of of a full chain.
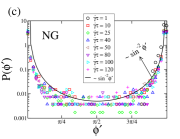
Concerning the distribution function, Chertkov et al. Chertkov_JFM05_531 have also shown a scaling behavior for the tail of the form within the framework of a linear dumbbell in the bulk. Comparison in the past with experimental results Gerashchenko_PRL_2006 demonstrated already an excellent agreement. Our results for the -PDF can be found in Fig. 7. The scaling prediction is again in remarkable good agreement with our BD data. Interestingly, the agreement seems to be even better for the NV case, where not only the tail is dictated by but the full -range. This suggests that the algebraic decay is even more relevant for (nearly) two-dimensional systems.
III.3 Bond-bond angle statistics
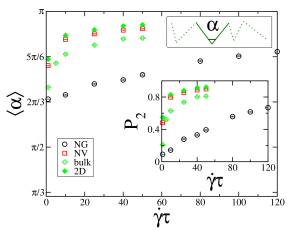
To characterize the intra chain property under shear flow, we have considered the bond-bond angles (BBAs). This is a complementary approach to investigate the chain stretching and coiling features. The results are depicted in Fig. 8. In a first low shear rate window (), there is a rather strong shear rate dependency for the NV, bulk, and 2D cases. Typically, this describes the relevance of coiled conformations. At higher shear rates, this dependency becomes much weaker and a plateau-like regime (about ) is observed. This feature, is the signature of strongly stretched polymer chains. As far as the NG case is concerned, the shear rate dependency is much weaker as expected. This result is fully consistent with the positive skewness reported in Fig. 4(c) for a wide range of the shear rate. A complementary observable provided by the following order parameter he_MM07_40_6721 is also shown as an inset in Fig. 8.
| (9) |
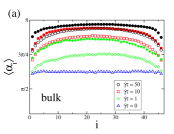
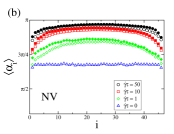
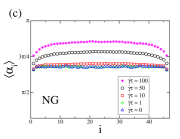
We now would like to address the local bond-bond angles, which physically characterizes the degree of local chain stretching. The mean BBA is plotted vs. the monomer position index () in Fig. 9. As expected, a symmetry around the chain center is revealed, see Fig. 9. The two chain ends are always looser and the local stretching, is smoothly increasing upon approaching the center of the chain. Besides, the local chain stretching increases with growing shear rate, see Fig. 9.
III.4 Tumbling
The tumbling process of the chain under shear flow is the mechanism by which energy is transferring, or in other words, the polymer cyclically absorbs (stretching) and releases (collapsing) energy from and to the surrounding fluid. This particular polymer motion in shear flow has been thoroughly studied in the past. Teixeira_MM05_38 ; Schroeder_PRL_2005 ; Rafael_PRL_2006 All these studies address the bulk case Teixeira_MM05_38 ; Schroeder_PRL_2005 or grafted polymer chains, Rafael_PRL_2006 but without considering the problem of adsorption. In this work, the frequency of this cyclic motion is calculated for the three geometries (bulk, NV and NG) via the Fourier transform of the time-dependent radius of gyration, which is
| (10) |
where is the chain center of mass at time . The first main peak position of the resulting Fourier transform of (not shown here) is chosen as the tumbling frequency.
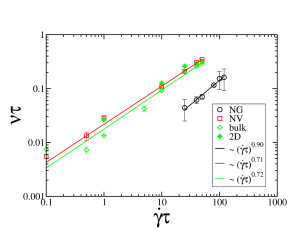
Figure 10 displays the reduced tumbling frequency () as a function of the reduced shear rate . The purely 2D case is also shown as a reference. Thereby, scaling behaviors of the form
are observed , with for NG, NV, and bulk, respectively. Hence, the bulk and NV cases, exhibit (within statistical uncertainties) an identical scaling behavior for the tumbling frequency. The value found for the exponent is in very good agreement with the one reported by Schroeder et al. Schroeder_PRL_2005 (), based on the angular power spectral frequency, for Brownian rods in the bulk. As expected the NG case exhibits a different scaling behavior (here ) due to the chain adsorption that weakens the effect of the velocity gradient in the normal direction.
To understand the physical origin of the observed scaling behaviour of the tumbling frequency in Fig. 10, we are going to employ the arguments advocated by Teixeira et al. Teixeira_MM05_38 . By decomposing the tumbling motion into typical time periods: (i) a stretching phase (), (ii) an alignment along the shear direction (), (iii) a flip motion (), and (iv) a collapse event (), we can write an expression for the tumbling frequency Schroeder_PRL_2005 ; Teixeira_MM05_38
| (11) |
The three processes of polymer stretching, aligning and collapsing being advection-driven, Teixeira et al. Teixeira_MM05_38 have shown that , , and scale like , where is the average chain extension in the -flow-direction and is the chain extension in the shear gradient direction. On the other hand, the flipping process is a diffusive motion such that , Teixeira_MM05_38 where is the diffusivity in the shear gradient direction and found to be from BD simulations by Doyle et al.. Doyle_JFM97_334_251 Following the same procedure with our simulation data, we were then able to extract the time duration scalings which are gathered in table 1.
| bulk | ||||
|---|---|---|---|---|
| NV | ||||
| NG |
These results in Table 1 are in good agreement, for the NV case and the bulk, with the observed exponent (, see Fig. 10). Even for the NG case, the scaling predictions are validated for the convective processes (stretching, alignment, collapsing). Nonetheless, it fails for in the NG case because the strong adsorption weakens the diffusivity in the shear gradient () direction .
IV Conclusion
Using Brownian dynamics simulations, the statistical properties of adsorbed polymers under a linear shear flow have been studied for the two cases: in-adsorption-plane shear gradient (or equivalently the shear vorticity normal to the adsorbing wall), and the shear gradient perpendicular to the wall. The three-dimensional bulk and the purely two-dimensional cases under linear shear flow have been considered as well as reference cases.
We have compared the behaviour of the full polymer chain to that of a simple dumbbell model. A good agreement is reached for the PDF of the chain end-to-end distance. Besides, the theoretically predicted scaling behaviour Chertkov_JFM05_531 ; Puliafito_PD05_211 of the angular PDF tails is confirmed also in the case where the shear gradient is parallel to the walls (NV case). In the opposite case of perpendicular shear gradient (NG case), agreement is only found at high shear rates. It is remarkable that a simple dumbbell model can capture the correct scaling behaviour of the angular PDFs’ tails of a full monomer-resolved chain.
The chain coiling and stretching degree was characterized by the inner bond-bond angles. For the NV, bulk and 2D cases, the shear rate dependency is found to be rather strong in the first low shear rate regime, but is much weaker at higher shear rates, and a plateau-like behavior is approached once the shear rate is high enough. For the NG case, this dependency is much weaker for a wide range of shear rates.
The tumbling frequency in the bulk scales sublinearly with shear flow rate, which is in agreement with the early studies. Teixeira_MM05_38 ; Schroeder_PRL_2005 We found this sublinear scaling also in the adsorbed cases (NV, NG). The theoretical scaling analysis based on the dumbbell model, Teixeira_MM05_38 was confirmed for the NV case but not for the NG case.
As an outlook, understanding the stretching and coiling mechanisms of polymer in flow leads to an improved control over chain configurations in various circumstances of confinement, e.g. in microfluidic devices. Pfohl Stretched polymer chains may provide valuable candidates for nanowires in microcircuits. Knobloch Therefore a minimalistic model, as the simple FENE dumbbell model, is useful in order to map the behaviour of a complex system and to predict the qualitative trends in various flow situations.
For future studies, many polymer chains, i.e. a concentrated polymer solution, may exhibit complex dynamical behaviour due to significant slowing down caused by mutual chain entanglements. Varnik_JCP_02_117 It is further interesting to mix nanoparticles and polymers Dzubiella_JPCM_01_13 and expose them to different flow fields and study their collective dynamical behaviour. Usta_JCP_09_130 Finally, the influence of hydrodynamic interactions need more consideration, following the recent simulation method proposed in ref Hoda_JCP07_127_234902 .
Acknowledgments We thank A. Kiriy and M. Stamm for helpful discussions. This work was supported by the DFG (LO 418/12-1 and SFB TR6).
References
- (1) B. D. Ratner and S. J. Bryant, Ann. Rev. Biomed. Engin. 6, 41 (2004).
- (2) P. L. Felgner, Sci. Am. 276, 102 (1997).
- (3) F. Rusmini, Z. Y. Zhong, and J. Feijen, Biomacromol. 8, 1775 (2007).
- (4) S. Koster, D. Steinhauser, and T. Pfohl, J. Phys.: Condens. Matt. 17, S4091 (2005).
- (5) E. Braun, Y. Eichen, U. Sivan, and G. Ben-Yoseph, Nature 391, 775 (1998).
- (6) A. Knobloch, A. Manuelli, A. Bernds, and W. Clemens, Journal of Applied Physics 96, 2286 (2004).
- (7) E. S. G. Shaqfeh, Journal of Non-Newtonian Fluid Mechanics 130, 1 (2005).
- (8) T. Kotaka, H. Suzuki, and H. Inagaki, J. Chem. Phys. 45, 2770 (1966).
- (9) J. D. Huppler, E. Ashare, and L. A. Holmes, Trans. Soc. Pheol. 11, 159 (1967).
- (10) C. Tiu, T. Moussa, and R. J. Carreau, Rheol. Acta 34, 586 (1995).
- (11) J. Marko and E. D. Siggia, Macromolecules 28, 8759 (1995).
- (12) D. E. Smith, H. P. Babcock, and S. Chu, Science 283, 1724 (1999).
- (13) B. Ladoux and P. S. Doyle, Europhys. Lett. 52, 511 (2000).
- (14) S. W. Schneider, S. Nuschele, A. Wixforth, C. Gorzelanny, A. Alexander-Katz, R. R. Netz and M. F. Schneider, PNAS 104, 7899 (2007).
- (15) C. Rivetti, M. Guthold, and C. Bustamante, J. Mol. Biol. 264, 919 (1996).
- (16) S. Minko, A. Kiriy, G. Gorodyska, and M. Stamm, J. Am. Chem. Soc. 124, 3218 (2002).
- (17) L. J. Kirwan, G. Papastavrou, M. Borkovec, and S. H. Behrens, Nano. Lett. 4, 149 (2004).
- (18) G.-L. He, R. Messina, H. Löwen, A. Kiriy, V. Bocharova and M. Stamm, Soft Matter 5, 3014 (2009).
- (19) C. M. Schroeder, R. E. Teixeira, E. S. G. Shaqfeh, and S. Chu, Phys. Rev. Lett. 95, 018301 (2005).
- (20) R. E. Teixeira, H. P. Babcock, E. S. G. Shaqfeh, and S. Chu, Macromolecules 38, 581 (2005).
- (21) S. Gerashchenko and V. Steinberg, Phys. Rev. Lett. 96, 038304 (2006).
- (22) E. J. Hinch, J. Fluid Mech. 74, 317 (1976).
- (23) E. J. Hinch, J. Fluid Mech. 75, 765 (1976).
- (24) M. Chertkov, I. Kolokolov, V. Lebedev, and K. Turitsyn, J. Fluid Mech. 531, 251 (2005).
- (25) R. G. Winkler, Phys. Rev. Lett. 97, 128301 (2006).
- (26) A. Celani, A. Puliafito, and K. Turitsyn, Europhys. Lett. 70, 464 (2005).
- (27) A. Puliafito and K. Turitsyn, Physica D 211, 9 (2005).
- (28) C. Aust, S. Hess, and M. Kröger, Macromolecules 35, 8621 (2002).
- (29) S. Liu, B. Ashok, and M. Muthukumar, Polymer 45, 1383 (2004).
- (30) R. Delgado-Buscalioni, Phys. Rev. Lett. 96, 088303 (2006).
- (31) M. Müller and C. Pastorino, Europhys. Lett. 81, 28002 (2008).
- (32) L. Cannavacciuolo, R. G. Winkler, and G. Gompper, Europhys. Lett. 83, 34007 (2008).
- (33) A. Serr and R. R. Netz, Europhys. Lett. 78, 68006 (2007).
- (34) P. S. Doyle, E. S. G. Shaqfeh, and A. P. Gast, Macromolecules 31, 5474 (1998).
- (35) I. M. Neelov and K. Binder, Macromolecular Theory and Simulations 4, 119 (1995).
- (36) N. Hoda and S. Kumar, J. Chem. Phys. 127, 234902 (2007).
- (37) K. Kremer and G. S. Grest, J. Chem. Phys. 92, 5057 (1990).
- (38) D. Andrienko, S. Leon, L. D. Site, and K. Kremer, Macromolecules 38, 5810 (2005).
- (39) D. N. Joanes and C. A. Gill, Journal of the Royal Statistical Society (Series D): The Statistician 47, 183 (1998).
- (40) E. J. Hinch and L. G. Leal, J. Fluid Mech. 52, 634 (1972).
- (41) G.-L. He, H. Merlitz, J.-U. Sommer, and C.-X. Wu, Macromolecules 40, 6721 (2007).
- (42) P. S. Doyle, E. S. G. Shaqfeh, and A. P. Gast, J. Fluid Mech. 334, 251 (1997).
- (43) F. Varnik and K. Binder, J. Chem. Phys. 117, 6336 (2002).
- (44) A. Jusufi, J. Dzubiella, C. N. Likos, C. von Ferber and H. Löwen, J. Phys.: Condens. Matt. 13, 6177 (2001).
- (45) O. B. Usta,D. Perchak, A. Clarke, J. M. Yeomans and A. C. Balazs, J. Chem. Phys. 130, 234905 (2009).