PASCHEN– EMISSION IN THE GRAVITATIONALLY LENSED GALAXY SMM J163554.2+66122511affiliation: This work is based in part on observations made with the Spitzer Space Telescope, which is operated by the Jet Propulsion laboratory, California Institute of Technology, under NASA contract 1407.
Abstract
We report the detection of the Pa emission line in the galaxy SMM J163554.2+661225 using Spitzer spectroscopy. SMM J163554.2+661225 is a sub-millimeter–selected infrared (IR)–luminous galaxy maintaining a high star–formation rate (SFR), with no evidence of an AGN from optical or infrared spectroscopy, nor X-ray emission. This galaxy is lensed gravitationally by the cluster Abell 2218, making it accessible to Spitzer spectroscopy. We measure a line luminosity, erg s-1, corrected for gravitational lensing. Comparing the H and Pa luminosities, we derive a nebular extinction, mag. The dust–corrected luminosity, erg s-1, corresponds to an ionization rate, s-1. The instantaneous SFR is yr-1, assuming a Salpeter–like initial mass function from 0.1 to 100 yr-1. The total IR luminosity derived using 70, 450, and 850 µm data is , corrected for gravitational lensing. This corresponds to yr-1, where the upper range is consistent with that derived from the Pa luminosity. While the ratio is consistent with the extrapolated relation observed in local galaxies and star–forming regions, the rest–frame 24 µm luminosity is significantly lower with respect to local galaxies of comparable Pa luminosity. Thus, SMM J163554.2+661225 arguably lacks a warmer dust component ( K), which is associated with deeply embedded star formation, and which contrasts with local galaxies with comparable SFRs. Rather, the starburst in SMM J163554.2+661225 is consistent with star–forming local galaxies with intrinsic luminosities, , but “scaled–up” by a factor of 10–100.
Subject headings:
infrared: galaxies — galaxies: formation — galaxies: high-redshift — galaxies:individual (SMM J163554.2+661225) — galaxies: starburst1. INTRODUCTION
There has been a growing industry of deep, multiwavelength surveys, devoted to studying star formation and evolution of galaxies. Studies of data from these surveys have concluded that the global star–formation rate (SFR) density reached a maximum between 1.5–3 (e.g., Hopkins, 2004, and references therein), during the period of rapid growth in the stellar mass density (e.g., Dickinson et al., 2003; Rudnick et al., 2003, 2006). However, the study of SFRs in these multiwavelength datasets requires estimates of the SFR using available observables. Common SFR indicators for high–redshift galaxies are the rest–frame UV luminosity, especially at when the UV shifts into the optical bands (e.g., Madau et al., 1996; Steidel et al., 1999; Giavalisco et al., 2004; Bouwens et al., 2006; Sawicki & Thompson, 2006; Reddy et al., 2008), the far–IR luminosity inferred from sub–mm emission (e.g., Blain et al., 2002), the mid–IR luminosity from Spitzer/24 µm (e.g., Pérez-González et al., 2005; Caputi et al., 2006; Papovich et al., 2006; Reddy et al., 2006; Webb et al., 2006; Daddi et al., 2007; Franx et al., 2008), and the H–emission line (e.g., Erb et al., 2006; Bouché et al., 2007; Kriek et al., 2008). Each of these SFR indicators has inherent uncertainties (e.g., Kennicutt, 1998; Hopkins & Beacom, 2006, and references therein), and some that are unique to observations at these redshifts (e.g., uncertainties in the luminosity–temperature dependence on the sub-mm– conversion, Chapman et al. 2005; Pope et al. 2006; template incompleteness and photometric redshift uncertainties on the 24 µm– conversion, Papovich et al. 2006, Reddy et al. 2006). Nevertheless, several studies have compared SFRs derived from the UV, 24 µm, far–IR, and sub–mm (and less–understood SFR tracers, such as radio and X–ray emission), concluding broadly that while they are consistent statistically, there is large scatter (e.g., Daddi et al., 2005, 2007; Reddy et al., 2006; Pope et al., 2006; Papovich et al., 2007). There have been few comparisons of direct, robust SFR indicators in individual galaxies at high redshifts (e.g., Siana et al. 2008; references above).
SFR indicators are normally calibrated against H I recombination lines (e.g., Kennicutt, 1998). The primary advantage of H I recombination lines is that they effectively re-emit the stellar luminosity from hydrogen–ionizing photons. They are strong in star–forming regions, and they trace directly emission by massive stars. The physics of H I emission in star–forming regions is relatively well understood (Osterbrock 1989), and they exhibit only a weak dependence on electron density and temperature. Of the H I lines, Pa at µm is an ideal practical SFR indicator. This line is exceptionally strong in star–forming regions (1 yr-1 corresponds to erg s-1; Alonso–Herrero et al. 2006). Furthermore, while recombination lines are subject to strong attenuation, Pa suffers minimal extinction due to its longer wavelength. Recent studies of star formation in nearby galaxies and star–forming regions within galaxies rely on the Pa luminosity to interpret and to calibrate other SFR indicators, including the infrared emission (e.g., Calzetti et al., 2005, 2007; Alonso-Herrero et al., 2006; Kennicutt et al., 2007; Díaz-Santos et al., 2008). For extremely dusty, star–forming IR luminous galaxies with 10–30 mag (e.g., Murphy et al. 2001; Dannerbauer et al. 2005; Armus et al. 2007), the extinction at Pa is 2 mag, and optically thin. Thus, even in the most obscured, luminous star–forming regions, the Pa line traces the intrinsic ionization rate, and thus the SFR.
While a few studies have compared SFR indicators in distant galaxies to the H emission line (see references above), no attempt to use Pa as a SFR indicator has yet been attempted in any galaxy of significant redshift. At 2 the Pa µm line shifts to µm, and is accessible to the Infrared Spectrograph (IRS) on–board Spitzer, which covers the wavelength range of 5.2–38 µm. However, star–forming galaxies at 2 are too faint intrinsically for observations with IRS at the expected wavelength for Pa (5.4–8 µm), except for rare, extremely luminous objects, in which AGN likely dominate the H I line emission (e.g., Brand et al. 2006), complicating any SFR–tracer comparisons. We have initiated a program using Spitzer/IRS to study the Pa emission in 12 galaxies at gravitationally lensed by foreground galaxies or clusters of galaxies. Here, we discuss the detection of Pa in a star–forming galaxy at , gravitationally lensed by the rich cluster Abell 2218 (Kneib et al., 2004). This is the highest–redshift object with a measurement of the Pa emission line yet obtained, and thus we are able to study SFR indicators in a more “typical” star-forming galaxy directly at high redshift.
The outline for the rest of this paper is as follows. In § 2, we summarize the properties of SMM J163554.2+661225. In § 3, we discuss the Spitzer observations and data reduction. In § 4, we discuss the analysis of the spectroscopic and imaging data to derive rest–frame luminosities. In § 5, we compare the rest–frame luminosities of SMM J163554.2+661225 to local samples, and discuss the utility of the various quantities as SFR indicators. In § 6, we present our conclusions. In the Appendix, we use stellar population models to analyze the rest–frame UV to near-IR spectral energy distribution (SED) of SMM J163554.2+661225, and make some conclusions on the nature of the stellar populations in this galaxy. To derive physical quantities we use a cosmological model with km s-1 Mpc-1, , .
2. SMM J163554.2+661225
We targeted SMM J163554.2+661225 (, , J2000), which is a galaxy at gravitationally lensed by the galaxy cluster Abell 2218. SMM J163554.2+661225 was identified by Kneib et al. (2004, hereafter K04) as a lensed–galaxy candidate selected as a sub–mm source at 450 and 850 µm, with a very red optical counterpart. This source consists of a triply lensed system, with a combined magnification from gravitational lensing (K04). The brightest component (component “B” in the notation of K04) has , mag with mag in the Vega–based system, and submillimeter flux densities of mJy and mJy. The intrinsic sub-mm flux density (corrected for gravitational lensing magnification) is mJy, a factor of two fainter than the sensitivity of the deepest sub-mm field surveys, and nearly an order of magnitude fainter than “typical” sub-mm–selected galaxies (Chapman et al., 2005). K04 provided the spectroscopic redshift based on the H emission line in a near-IR spectrum and from the ISM absorption lines in an optical spectrum (rest–frame UV). Furthermore, SMM J163554.2+661225 appears to be part of a larger group at , with at least two other galaxies lensed by Abell 2218 with based on their UV absorption lines.
Rigby et al. (2008, hereafter R08) observed SMM J163554.2+661225 with Spitzer as part of the time allocated to the guaranteed time observers (GTO). The GTO observations included imaging of Abell 2218 at 3.6–8 µm from the Infrared Array Camera (IRAC, Fazio et al., 2004), and imaging at 24–160 µm using the Multiband Imaging Photometry for Spitzer (MIPS, Rieke et al., 2004). In the Appendix, we use the available photometry from K04 and R08 to constrain the nature of the stellar populations and to estimate the stellar mass of SMM J163554.2+661225. R08 targeted component “B” of SMM J163554.2+661225 for mid–IR spectroscopy with Spitzer/IRS (Houck et al., 2004a) because this source has the brightest IR flux densities, with mJy. Their IRS spectroscopy used the LL1 module, covering 19–38 µm with resolution. R08 fit template IR SEDs from Dale & Helou (2002) and Chary & Elbaz (2001) to the 24, 450, and 850 µm data (including a MIPS 70 µm flux–density limit) to derive a total IR luminosity integrated from 8–1000 µm, . They found , corrected for the gravitational–lensing magnification, where the range reflects differences in the template SEDs. This IR luminosity corresponds to a SFR, yr-1, using the relation in Kennicutt (1998) for a Salpeter–like initial mass function (IMF) with lower and upper mass cutoffs of 0.1 and 100 , respectively.
SMM J163554.2+661225 appears to be undergoing an intense episode of star-formation with no evidence for an active galactic nucleus (AGN). K04 note that the ratio [N II]/H= is consistent with ionization from star–formation for stars of near solar metallicity (see Pettini & Pagel, 2004). R08 show that the mid–IR spectrum contains strong emission attributed to polycyclic aromatic hydrocarbon (PAH) molecules, associated with dust heating from star–formation, with features similar to local starburst galaxies. The lack of any apparent silicon absorption at 9.7 µm in the spectrum argues against the presence of an obscured AGN (e.g., Spoon et al., 2007). R08 analyzed archival data from the Chandra X-ray Observatory, which provided limits on the X-ray emission for this galaxy. This flux upper limit corresponds to a luminosity limit of erg s-1, corrected for the gravitational-lensing magnification. Compared to other sub-mm galaxies, the X-ray upper limit rules out the presence of an AGN unless it is very obscured (e.g. Alexander et al., 2005).
3. OBSERVATIONS AND DATA REDUCTION
3.1. IRS SL2 Spectra
For our Spitzer/IRS observations, we targeted component “B” of SMM J163554.2+661225, using the IRS SL2 module, covering 5.2–8.7 µm. This is the same object targeted by R08, who observed this galaxy with the IRS LL module. Thus, the observations here extend the spectral coverage of this target to the shorter wavelengths, including the expected wavelength of Pa.
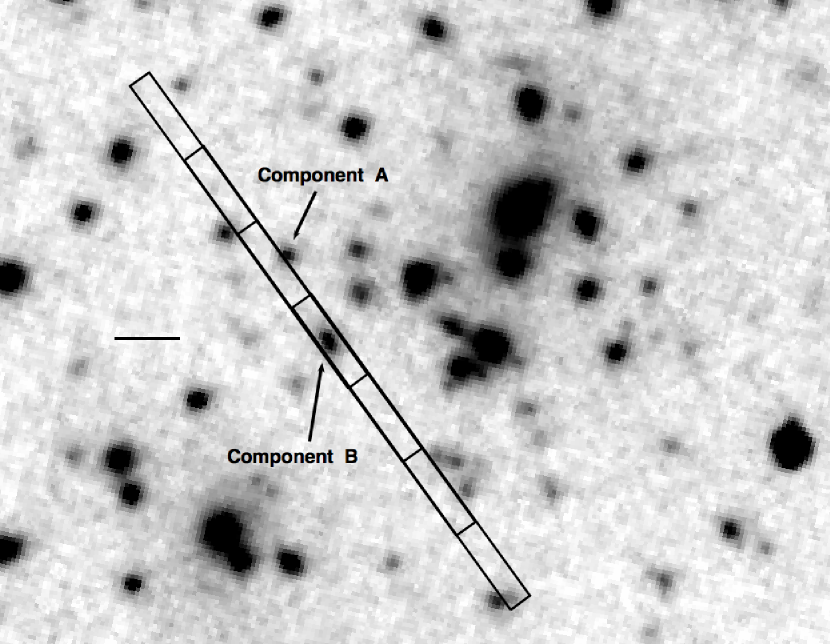
The observed flux density of SMM J163554.2+661225 at 5.8 µm is Jy (R08). For the redshift of our target, , we expect the Pa line to fall at 6.6 µm. We obtained our IRS observations in Mapping mode, placing the object at four different positions along the SL2 slit separated by 14″. Figure 1 shows the position of the four SL2 slit positions on the IRAC 5.8 µm image of the field for the epoch of observations. We observed SMM J163554.2+661225 using 60 cycles of 60 s integrations, which we repeated at each of the four slit positions. The total integration time is 4 hours, for which the Spitzer Performance Estimation Tool predicts a signal–to–noise ratio of 6–7 per resolution element in the continuum. In practice, we find that systematics reduce this slightly (see below).
Observations were obtained on 2008 Feb 22-23 during a single AOR in order to prevent alignment uncertainties from different campaigns possibly at very different spacecraft orientations. We used high accuracy peak-up centroiding with the IRS blue filter to minimize any deviations in the absolute telescope pointing. We chose a peak–up star from the 2MASS catalog, against which we had matched the astrometric coordinates for SMM J163554.2+661225.
We reduced the data starting with the S17.2.0 Spitzer IRS pipeline data, which produced basic calibrated data (BCD) files. Our data contained some very strong cosmic rays which adversely affected the stray light correction in the IRS pipeline. However, we determined that the stray light effects are negligible in our data as the peak-up arrays do not contain bright sources during our exposures. We therefore used the BCD data products without the stray light correction (the BCD files f2ap.fits and f2unc.fits).
The dominant background component at 5–8 µm is Zodiacal light. Our observations included very long integrations of faint sources (these are currently the deepest SL2 observations taken of any object of which we are aware). Therefore we include some additional steps to remove the sky background and detector effects. We generally follow the post–BCD reduction steps used by Teplitz et al. (2007) and Pope et al. (2008) in their analysis of deep IRS/LL data. We looked for indications of latent charge in the array during our long exposures, as latent charge accumulation is observed in long IRS/LL exposures (e.g., Teplitz et al., 2007). However, we observe no increase in the median number of ADU s-1 over the course of a 60 min SL2 observation. Thus, there is no evidence for appreciable latent charge in the SL2 array over our integrations.
We next identified and cleaned known bad and hot pixels using the SSC task IRSCLEAN333http://ssc.spitzer.caltech.edu/postbcd/irsclean.html with the known warm–pixel mask for our IRS campaign (IRSX008900). We also identified other “rogue” and “warm” pixels as pixels with abnormally high variance. We performed this latter task using an automated routine which computed the variance of each pixel over all the BCDs of an observation. We flagged rogue pixels as those pixels with high variance (). We then used IRSCLEAN to interpolate over these pixels.
We constructed a sky spectrum for SMM J163554.2+661225 at each of the four slit positions by combining the BCDs of the three other slit positions. To create the sky image, we took the median of the stack of each pixel after rejecting outliers using a sigma–clipping algorithm. We performed this process iteratively, masking out the location of SMM J163554.2+661225 during subsequent iterations (SMM J163554.2+661225 is the only source we identify in the 2D spectrum). We then subtracted the sky frame from each BCD and coadded the BCDs at each slit position. As a last step, we reran IRSCLEAN on the combined images for each slit position to clean any remaining hot pixels. These steps produced four 2D spectroscopic images for SMM J163554.2+661225, one at each of the four slit positions.
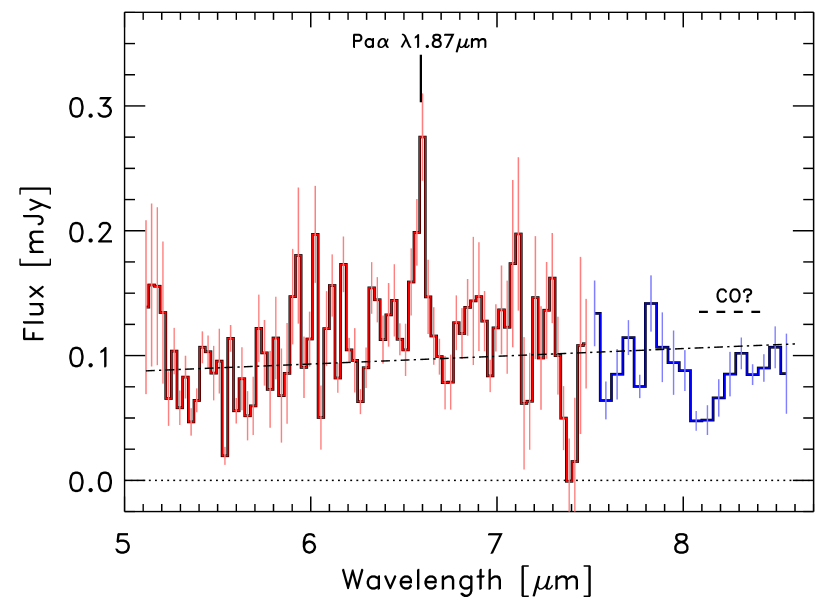
We extracted 1D spectra at each slit position using the Spitzer/IRS custom extraction (SPICE) software444http://ssc.spitzer.caltech.edu/postbcd/spice.html with an optimal extraction window. We extracted spectra from both the 2nd spectral order (covering 5.2–7.7 µm) and the “bonus” 1st spectral order (covering 7.3–8.7 µm). SPICE provides the extracted 1D science spectrum and the propagated errors from the IRS observation. For each science spectrum, we also extracted a sky spectrum using the same SPICE parameters, offset from SMM J163554.2+661225. These sky spectra provide consistency estimates for the error derived from the science spectra. We found these to be consistent, and we adopted the latter here in subsequent analysis. We then combined the four 1D spectra as a weighted mean, using the weights derived from the error spectra. The estimate of the variance on the combined 1D science spectrum is the inverse sum of the weights. Figure 2 shows the combined 1D spectrum.
SMM J163554.2+661225 is marginally resolved in the IRAC 5.8 and 8.0 µm images (channels 3 and 4). We estimated the angular resolution using three stars in the field identified from HST/ACS imaging. For these three stars we measured a mean FWHM= in the channel 3 image. In comparison, for SMM J163554.2+661225 we measure a FWHM= in this image. Most of the elongation of SMM J163554.2+661225 appears to be aligned with the orientation of the SL2 slit for our observations, as illustrated in figure 1. Although SMM J163554.2+661225 appears resolved, for the spectral extraction and flux calibration we nevertheless assumed SMM J163554.2+661225 to be a point source. This is reasonable because IRS SL2 has large pixels (1.8″ pixels) compared to IRAC (1.2″ pixels), so the spatial resolution is substantially worse compared to IRAC, and SMM J163554.2+661225 is at best marginally resolved. In principle, if it is resolved spatially, this could affect the flux calibration of the extracted spectrum. However, we measure a continuum of SMM J163554.2+661225 from our SL2 spectrum that is within 1% of that expected from the measured IRAC 5.8 and 7.9 µm flux densities (see figure 2). Because pointing–induced slit throughput variations may produce uncertainties in the absolute flux measurements of 10–15%, we consider this agreement fortuitous. Nevertheless, we conclude that our extracted spectrum corresponds to the spatially integrated emission of SMM J163554.2+661225, and we make no corrections because of the extended nature of this source. Furthermore, because the expected flux densities and measured continuum are essentially equal, we also make no additional corrections to the measured flux for light falling outside the SL2 slit.
3.2. MIPS 70 µm Imaging
SMM J163554.2+661225 has Spitzer/MIPS 70 and 160 µm data from the GTO observations. Using these, R08 placed an upper limit on the 70 µm emission of mJy. Since then, deeper MIPS 70 µm data have become available as part of Spitzer program ID 30823. These new observations reach an exposure time of 5245 s at the deepest point, substantially longer than the GTO observations. We obtained the raw MIPS 70 µm images from the Spitzer archive and reduced them using the GTO Data Analysis Tool (Gordon et al., 2005) following the steps described in Dole et al. (2004). We have applied further steps to mask sources detected in the image during the background subtraction steps, which greatly improves the final image quality. The final image achieves a limiting flux density of =0.5 mJy for point sources.
We detected point sources in the image using a weighted detection map and performed point–response function (PRF) weighted photometry. Because there are not enough bright point sources in the image to construct an empirical PRF from the image, we used the empirical PRF constructed from sources in wider area (0.5 deg2) extragalactic fields (Papovich et al., 2007). Photometry is performed simultaneously on crowded sources using a version of the DAOPHOT software (Stetson, 1987), following the procedure from Papovich et al. (2007).
SMM J163554.2+661225 is marginally confused in the 70 µm image. Figure 3 shows the contours of the 70 µm image overlaid on the 24 µm image. Given the substantially poorer resolution at 70 µm, the detected source corresponding to SMM J163554.2+661225 is likely blended with adjacent sources. We measured a flux density of for the source most closely associated with SMM J163554.2+661225 (uncorrected for gravitational magnification). At the 70 µm angular resolution of Spitzer, SMM J163554.2+661225 is blended with a counter image of itself (component “A” in the notation of K04), and possibly another source. Given that the ratio of the 24 µm flux densities of these components is =1.6, we expect a similar ratio at 70 µm because presumably component A and B have the same 24 µm–to–70 µm flux ratios (although K04 note that component B has a redder color, and thus could have a higher ). To improve our flux–density measurements, we simultaneously measured point–source photometry in the 70 µm image using a priori positions for sources detected in the 24 µm image. However, this method was very sensitive to uncertainties in the absolute astrometry between the 24 and 70 µm images, and yielded a flux density for component B ranging from mJy to 1.5 mJy ( mJy). Therefore in the analysis below, we use the direct photometry, and ascribe all the 70 µm emission to SMM J163554.2+661225 (component B). We note that the true 70 µm flux density may be lower by as much as 40% assuming the ratio above. As we will discuss below, the measured 70 µm flux density implies a rest–frame –to– ratio lower than that for local IR–luminous galaxies with comparable bolometric luminosities. Therefore, our assumption makes this result conservative.
4. ANALYSIS
4.1. Paschen– Emission
| EW0 | SFR | |||||||
|---|---|---|---|---|---|---|---|---|
| (µm) | (Å) | ( erg s-1 cm-2) | ( erg s-1) | (mag) | (mag) | ( erg s-1) | ( yr-1) | |
| (1) | (2) | (3) | (4) | (5) | (6) | (7) | (8) | (9) |
| 6.591 0.006 | 2.515 0.003 | 363 56 | 3.6 0.4 | 0.27 0.03 |
Note. — (1) Centroid wavelength of Pa line, (2) measured redshift, (3) rest–frame equivalent width of the Pa line, (4) measured line flux, with no correction for the gravitational lensing magnification or dust extinction, (5) line luminosity, corrected for the gravitational lensing magnification (K04), (6) nebular extinction from H and Pa measurements using the Calzetti et al. (2000) law, (7) corresponding extinction at 1.8751 µm, (8) line luminosity, corrected for the gravitational lensing magnification and dust extinction, (9) total SFR, corrected for the gravitational lensing magnification and dust extinction.
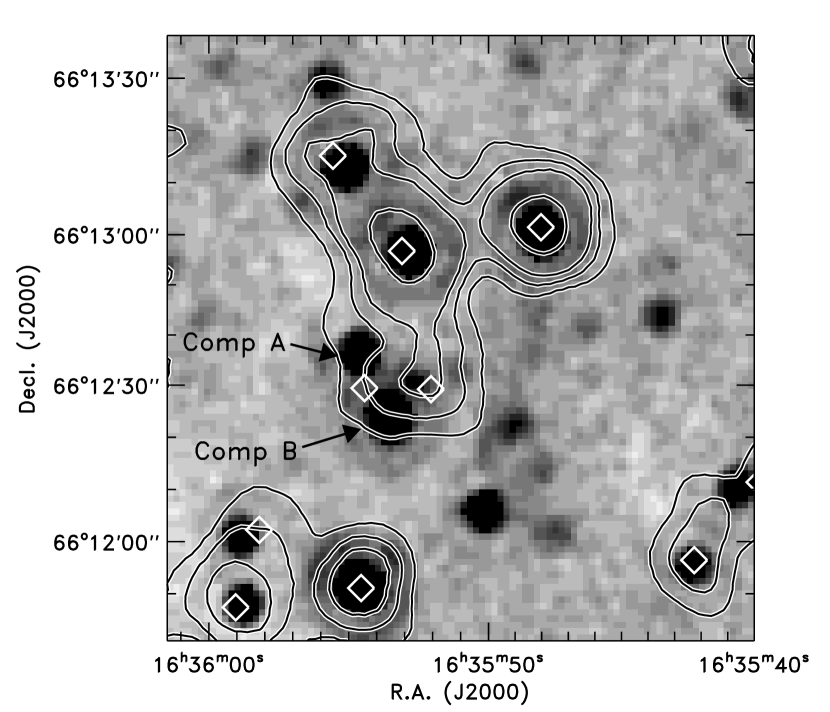
Figure 2 shows the combined IRS/SL2 spectrum. The dot–dashed line in the spectrum shows the predicted continuum from the measured IRAC photometry at 5.8 and 8.0 µm, Jy and Jy, which agrees with the measured continuum to within 1%. The median signal-to-noise ratio of the continuum is S/N5 from 5.5–7 µm.
We identify the emission line at 6.591 µm as Pa at , consistent with the expected redshift derived by K04. This is the highest redshift detection of Pa in any galaxy of which we are aware (cf., Siana et al., 2008, 2009). To measure the line parameters, we simultaneously fit the continuum and the line, where we model the latter as a Gaussian. The Gaussian fit has a measured full-width at half maximum, FWHM= µm. This is comparable to the IRS/SL2 resolution, therefore we conclude the line is unresolved. To derive the significance of this detection we generated a series () of simulated spectra using the data and a random value taken from a Gaussian distribution with equal to the derived uncertainty on each data point. We then remeasure the line flux in each simulated spectrum, and take the inner 68% of the simulated distribution for each parameter as the uncertainty. The measured quantities are given in Table 1. We derive a redshift for the Pa line of , which agrees within the measured uncertainties of K04 and R08 using spectral features in the optical, near–IR, and mid–IR wavelength ranges.
We measure a Pa line flux of erg s-1 cm-2, uncorrected for the gravitational lensing magnification or dust attenuation. We estimate the amount of dust attenuation affecting the nebular gas by comparing the ratio of the Pa line flux to the H line flux provided by K04 using –band spectroscopy. Note that the K04 measurement of H has not been corrected for extended emission beyond their spectroscopic slit of width 076. We estimate that the slit width used in the –band spectroscopy of K04 would miss up to 35% of the light from SMM J163554.2+661225. If we applied this (maximal) correction to the H flux, then it would decrease the extinction by 0.03 mag, and decrease the extinction–corrected Pa luminosity by 2%. Because these corrections are small, we do not apply any correction for the light falling outside the slit of the –band spectroscopy. Using the Calzetti et al. (2000) attenuation law, we estimate the extinction to be mag, which corresponds to mag. Other attenuation laws that we tested (Rieke & Lebofsky, 1985; Cardelli, Clayton, & Mathis, 1989; Draine, 1989; Dopita et al., 2005) correspond generally to higher extinction estimates by as much as mag compared to that of Calzetti et al. (2000). However, Calzetti et al. (2005) showed that compared with other attenuation laws their attenuation law reproduces better the UV colors of starforming H II regions with similar extinction and properties as that derived here for SMM J163554.2+661225. Therefore, we adopt the Calzetti et al. law for our analysis here. As we will discuss below, the ratio of the mid–IR luminosity to the extinction–corrected is lower relative to local IR galaxies of comparable luminosity. Using other attenuation laws would increase the Pa line luminosity by 30%. Therefore using the lower extinction value provided by the Calzetti law also provides a conservative choice. Nevertheless, the dust–extinction correction remains a systematic uncertainty.555We have learned that a recent reanalysis of the K04 near-IR spectroscopy (Richard et al., in preparation) provides a H flux that is 4 fainter than that of K04. If this flux is correct, it would increase the extinction to mag and mag, and would increase the extinction–corrected Pa luminosity (and SFR) by %. However, none of the main conclusions here would be affected significantly.
We derive a Pa line luminosity of erg s-1 after applying the extinction correction, , the gravitational lensing magnification, , and the luminosity distance, Mpc, at for the default cosmology. This luminosity corresponds to an ionizing continuum flux of s-1 (Osterbrock, 1989; Kennicutt, 1998). For an IMF with a Salpeter–like slope from 0.1 to 100 , the implied SFR is yr-1. The statistical uncertainty on the SFR is 17%, which is the highest accuracy on a SFR derived for a high–redshift galaxy to date. Note that while this uncertainty neglects the uncertainty on the gravitational lensing magnification (%, see § 2), the lensing is expected to be achromatic, and it will systematically scale all derived luminosities and SFRs.
4.2. CO Absorption
The IRS/SL2 1st–order “bonus” spectrum shows a possible absorption feature at 8–8.5 µm (see figure 2). At this corresponds to 2.3–2.4 µm, and would imply strong molecular CO absorption. If this feature is real, it would be the first time it has been observed in a galaxy with any significant redshift. CO absorption occurs in the atmospheres of red supergiant stars (K– and M–type), primarily from post–main-sequence O–type stars (e.g., Doyon, Joseph, & Wright 1994; Ridgway, Wynn-Williams, & Becklin 1994; Goldader et al. 1995). Given the quality of our SL2 spectrum, a detailed analysis of the CO absorption is cautionary. Nevertheless, we derive a spectroscopic CO index of CO using the definition of Doyon et al. (1994, see also Smith et al. 1996). Combined with the slope of the rest–frame near–IR continuum, this places SMM J163554.2+661225 in the “[Dust–] Reddened Starburst Population” locus of Ridgway et al. (1994), implying that the starburst in this galaxy dominates the rest–frame near–IR emission.
If the strength of the CO absorption feature in SMM J163554.2+661225 is real, then the age of the starburst corresponds to the time it takes O–type stars to enter the red supergiant phase. The fact that the H I recombination lines remain strong requires ongoing early–type (primarily O–type) star formation. The combination of these facts implies an age for the starburst of 10–50 Myr (Doyon et al., 1994).
4.3. The Mid–Infrared Luminosity
Using the MIPS 24 and 70 µm, and IRS/LL observations, we derive monochromatic luminosities at rest–frame 8 and 24 µm, and . Below we compare our results for SMM J163554.2+661225 against datasets of local galaxies where the above quantities are derived using photometry measured from IRAC 8 µm and MIPS 24 µm. Therefore, we compute and which match the rest–frame IRAC and MIPS bandpasses as closely as possible.
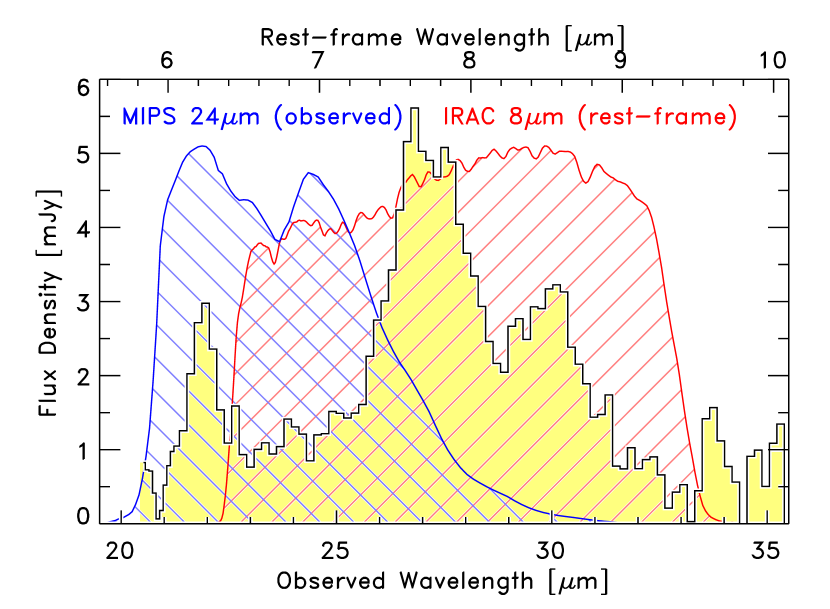
At the MIPS 24 µm photometry corresponds to rest–frame 6.8 µm. To convert this to rest–frame IRAC 8 µm we use the IRS/LL spectrum of SMM J163554.2+661225 from 20–38 µm from R08, corresponding to rest–frame 5.7–10.8 µm. Figure 4 shows the IRS/LL spectrum of SMM J163554.2+661225 from R08 overlaid with the MIPS 24 µm bandpass in the observed frame and the IRAC 8 µm bandpass in the rest frame. We integrate the IRAC 8 µm transmission function with the IRS/LL spectrum (shifted to the rest–frame) to derive a rest–frame 8 µm flux density, = mJy, where the subscript “0” denotes the rest–frame quantity. This corresponds to = Jy corrected for the gravitational magnification. In contrast, R08 measured a 24 µm flux density of mJy. This difference is primarily a consequence of the fact that at the MIPS 24 µm bandpass is mostly insensitive to the strong 7.7 µm and 8.6 µm PAH features, which dominate the mid-IR spectrum of SMM J163554.2+661225. These PAH features are included in the rest–frame IRAC 8 µm bandpass, which results in the much higher flux density when averaged over this bandpass.
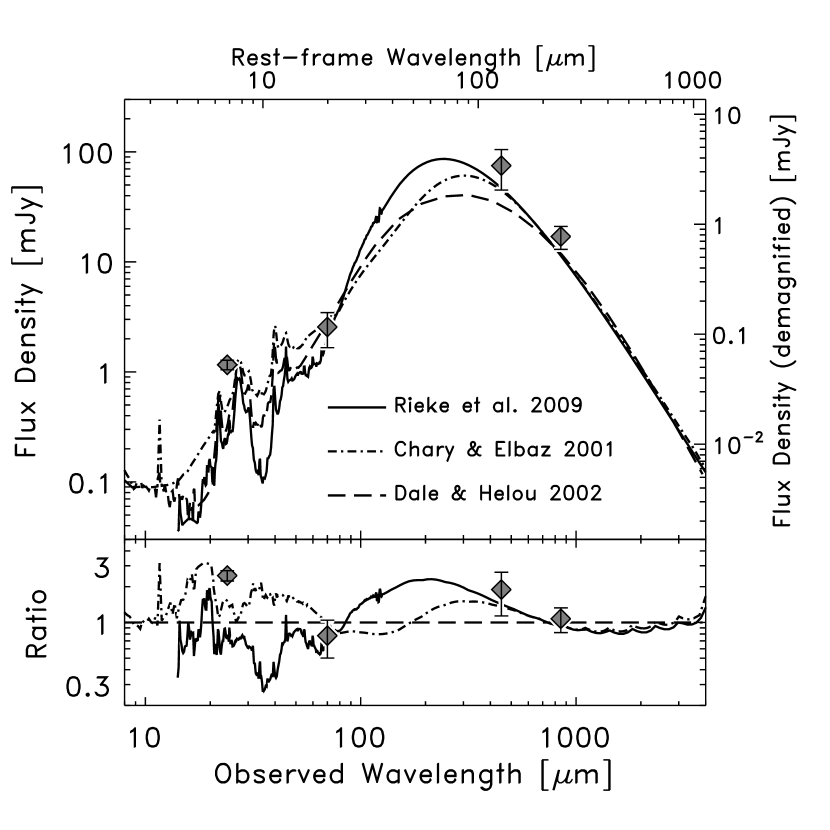
We measured the total IR luminosity for SMM J163554.2+661225 by fitting a suite of template IR SEDs (Chary & Elbaz, 2001; Dale & Helou, 2002; Rieke et al., 2009) to the 70, 450, and 850 µm photometry, as illustrated in figure 5 (see also § 5.1). The best–fit templates correspond to a total IR luminosity, , corrected for the gravitational lensing magnification. We estimated the rest–frame 24 µm flux density for SMM J163554.2+661225 by integrating these best–fit IR SEDs with the MIPS 24 µm transmission function. This yielded, mJy, corrected for the gravitational lensing magnification. There is an additional small systematic uncertainty resulting from differences in the template IR SEDs, corresponding to mJy. The error bar here is dominated by the uncertainty on the 70 µm photometry, which is the closest band to the rest–frame 24 µm datum. Furthermore, we remind the reader that the 70 µm flux density may be lower by as much as 40% (see § 3.2), which would decrease the 24 µm luminosity.
We convert the rest–frame flux densities to luminosities using, , where is the gravitational lensing magnification, and is the luminosity distance. Applying this formula to the 8 and 24 µm rest-frame quantities derived above yields erg s-1 and erg s-1.
5. DISCUSSION
The observations for SMM J163554.2+661225 provide independent estimates for the total SFR. In particular, we compare the Pa luminosity which stems from the ionized gas in H II regions and traces the number of ionizing photons, to estimates from the mid–IR and total IR luminosities, which measure primarily the dust–reprocessed emission from massive stars (e.g., Kennicutt, 1998; Kewley et al., 2002). As discussed in § 4.1, the Pa line luminosity corresponds to a SFR yr-1.
5.1. The Pa Luminosity Compared to the Total IR Luminosity
Local star–forming galaxies and star–forming regions show a tight correlation between and (e.g., Calzetti et al., 2005; Alonso-Herrero et al., 2006). For SMM J163554.2+661225 R08 derived a total IR luminosity in the range , taking into account the systematic uncertainty owing to the choice of IR SEDs (see also the discussion in Papovich et al., 2007). Here, we reanalyze the total IR luminosity of SMM J163554.2+661225 by fitting different sets of IR SEDs to the flux density at 70, 450, and 850 µm flux densities, all of which sample the thermal IR emission (see figure 5 and § 4.3). We exclude the 24 µm flux density from this analysis because it probes 6–7 µm in the rest–frame mid–IR, and its relationship to the thermal far–IR emission is not straightforward. Figure 5 shows the best fit IR SED templates and measured flux densities. Using the Dale & Helou (2002) templates, we derive , with a goodness-of-fit, and . We find formally better fits using both the IR SEDs of Chary & Elbaz (2001), giving with , and Rieke et al. (2009), giving with . The IR luminosities from the fits are consistent with the results from R08, where the difference here is that we have excluded the 24 µm flux density and include the deeper 70 µm flux–density measurement. Because the different IR SED templates all are consistent with the data, they imply there is a factor of 2 uncertainty on the total IR luminosity owing to differences in the choice of template. Moreover, because the IR SEDs we have tested are not continuous in , this implies there is at least a factor of 2 uncertainty on total IR luminosities of galaxies, even when flux densities are available at 70 µm and sub-mm wavelengths.
The total IR luminosities correspond to a range of SFR, yr. The upper range of the SFR corresponds to the fit using the Rieke et al. template, and these are consistent with the SFR derived from the Pa luminosity. The templates from Dale & Helou and Chary & Elbaz yield lower values, and imply SFRs lower by 40–50% compared to that from . To improve the accuracy on the IR luminosity will require flux density measurements at observed wavelengths of 150–250 µm, in order to constrain the peak of the thermal dust emission (see figure 5). Nevertheless, the current analysis provides evidence that the total IR luminosity and Pa luminosities are consistent for SMM J163554.2+661225 within a factor of 2.
Parenthetically, we note that none of the empirical IR templates are able simultaneously to fit both the thermal IR emission and the strength of the PAH emission features in the mid–IR. This is apparent in the lower panel of figure 5 where the best–fit IR templates imply lower observed 24 µm flux densities less than the measured value. This issue has been identified in the analysis of other high–redshift gravitationally lensed galaxies (e.g., Siana et al., 2008).
5.2. The Pa Luminosity Compared to the 8 µm Luminosity
The origin of the mid–IR emission (rest–frame 5–10 µm) in local galaxies is attributed both to very small-grain dust continuum emission and molecular PAH emission. Both the PAHs and very small grains are heated both by ionizing and non–ionizing sources (in particular, the ambient galactic radiation field from evolved stars, Li & Draine 2002). Local galaxies and star–forming regions show a nonlinear relation between and (see, e.g., Förster Schreiber et al., 2004; Calzetti et al., 2007), where the slope of the correlation depends on the dust–heating source(s), the dust spallation/formation rates, and the metallicity (e.g., Houck et al., 2004b; Engelbracht et al., 2005; Calzetti et al., 2007; Draine et al., 2007).
The MIPS 24 µm flux density probes rest–frame mid–IR, 6–7 µm at =2.515, as illustrated in figure 4. Many studies of the IR emission in distant galaxies use the measured 24 µm flux density to estimate the total IR emission, and we test these relations for SMM J163554.2+661225. Using the 24 µm flux density with the prescription of Papovich et al. (2006) yields a estimated total IR luminosity, , where the error is statistical only and does not include systematic uncertainties (see discussion in Papovich et al. 2006). This corresponds to a SFR, yr-1. While this is consistent with the SFRs derived from the Pa emission and measured from the far–IR data, this is somewhat fortuitous because the IR template used to extrapolate the observed 24 µm flux density implies higher flux densities at observed–frame 70 and 850 µm compared to the observations. This is similar to the statement in §5.1 that none of the template IR SEDs are capable to fit simultaneously the far–IR flux densities and mid–IR emission features. Using the scaling relation from Papovich et al. (2007), which includes bolometric corrections using the average 70 and 160 µm flux densities of galaxies, yields a nearly equal estimate for as using the 24 µm data only, with a similar offset compared to the implied SFR from Pa.
R08 derive a scaling relation between the rest–frame 8 µm luminosity, , and for their sample of gravitationally lensed galaxies, which includes SMM J163554.2+661225. Using the derived in § 4.3, the R08 scaling relation yields . This is consistent within the range of the total IR luminosity derived above, and consistent with the implied SFR from Pa within the errors.
Pope et al. (2008) derive scaling relations between and the luminosity of the 6.2 and 7.7 µm PAH emission features. R08 measured their PAH luminosities for SMM J163554.2+661225 simultaneously using PAHFIT (Smith et al. 2007). However, as discussed by Pope et al., line fluxes from measured by PAHFIT are generally higher than those using their method (see also the discussion in Sajina et al. 2007; Siana et al. 2008). Thus, we remeasured the 6.2 and 7.7 µm PAH luminosities individually, fitting each emission line with a Drude profile while fitting the slope and intercept of the continuum. Our fits for each line yielded erg s-1 and erg s-1. Using equations 4 and 5 from Pope et al. we infer and for the 6.2 and 7.7 µm PAH features, respectively. While these estimates of are higher by a factor of order three compared to that measured from the far-IR data, they are within the scatter observed in the the relation between the PAH luminosities and total IR luminosity in the Pope et al. sample. However, the intrinsic IR luminosity of SMM J163554.2+661225 is a factor of two lower than the high–redshift sub–mm from Pope et al., and it is possible the extrapolated relation does not hold. This may be supported by the results of Siana et al. (2008, 2009), who observe a similar offset between the PAH luminosity and total IR luminosity in their study of intrinsically less-luminous, lensed UV–bright objects.
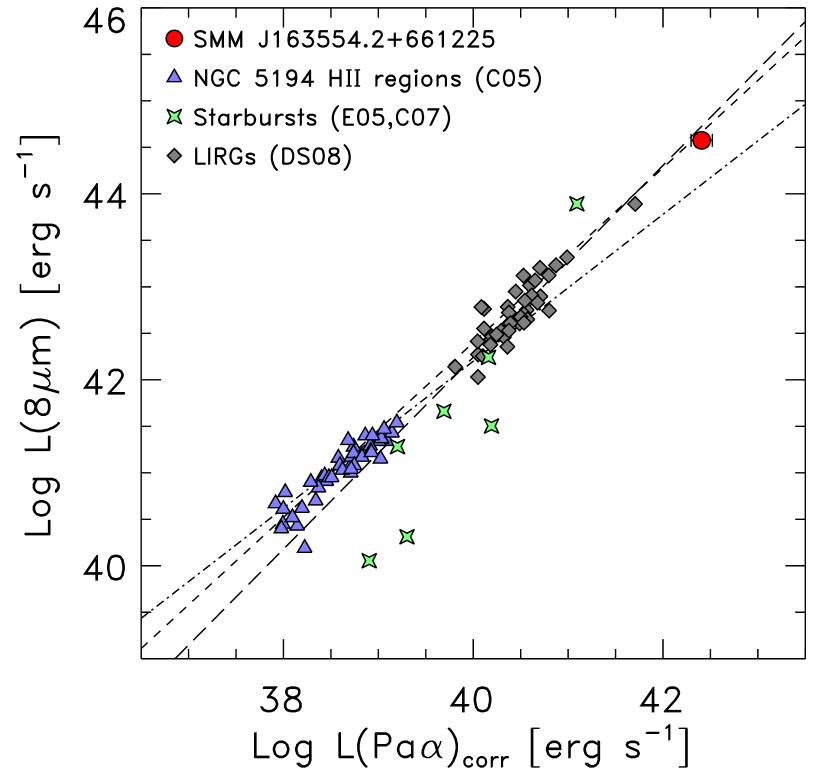
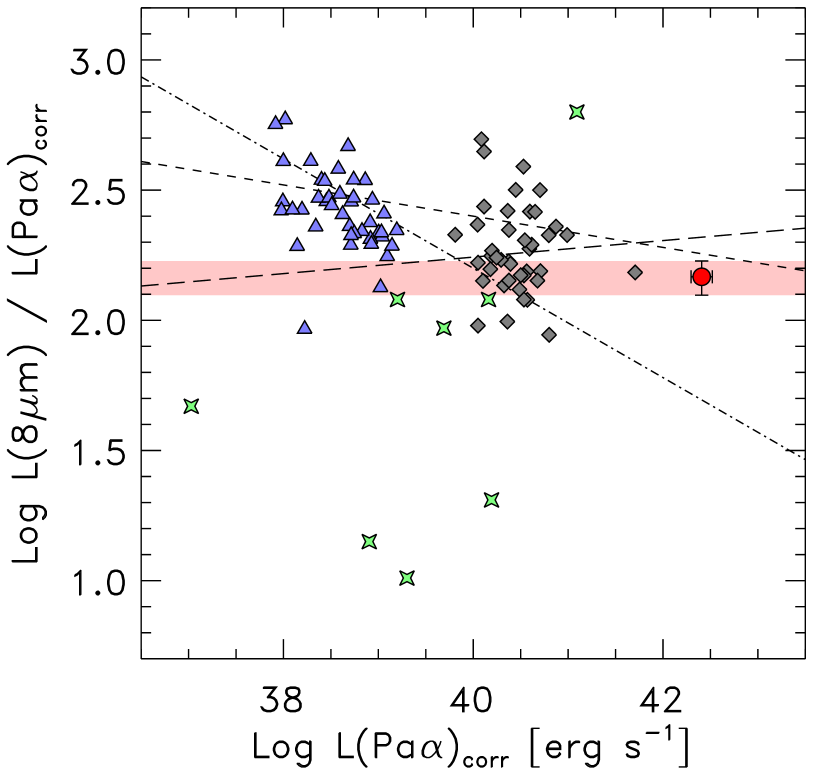
Figure 6 shows the Pa luminosity against the rest–frame 8 µm luminosity for SMM J163554.2+661225, compared against luminosities for samples of local galaxies and star-forming regions (Calzetti et al., 2005, 2007; Engelbracht et al., 2005; Díaz-Santos et al., 2008). Calzetti et al. (2007) derive a scaling relation between the Pa and 8 µm luminosities, , with . Note that Calzetti et al. derived this correlation in terms of luminosity surface densities (luminosity per unit physical area). However, Díaz-Santos et al. (2008) obtain a similar slope for the correlation between the 8 µm and Pa luminosities. While the luminosities for SMM J163554.2+661225 appear broadly consistent with the extrapolated relations, a clearer picture is evident by comparing the ratio of , shown in the right panel of Fig 6. There is much scatter in the local samples, but for SMM J163554.2+661225 agrees broadly with those extrapolated relationships that include the star–forming galaxies (Calzetti et al., 2007; Díaz-Santos et al., 2008). Using only the extrapolated relation from individual H II regions would underpredict the amount of 8 µm emission (cf., Calzetti et al., 2005). This implies that the fraction of photons from star–formation reradiated as 8 µm luminosity is weakly dependent on ionizing luminosity.
5.3. The Pa Luminosity Compared to the 24 µm Luminosity
The emission at rest–frame 24 µm results from thermal dust grains heated by ionizing and non–ionizing sources. Empirically, local galaxies and star-forming regions follow a correlation with , with in the range 1.03–1.23 (Calzetti et al., 2005, 2007; Alonso-Herrero et al., 2006). Alonso-Herrero et al. (2006) argue that the correlation with arises as dust absorbs ionizing and UV–continuum photons with increased efficiency in more heavily obscured, more luminous systems, so that an increasing fraction of the bolometric luminosity associated with star formation emerges in the IR with warmer dust temperatures (Lonsdale Persson & Helou, 1987; Wang & Heckman, 1996; Draine & Li, 2007). A similar conclusion is reached by Calzetti et al. (2007), who argued that the correlation exists because objects with increasingly higher starlight intensity and have higher dust temperatures, where the peak of the emission moves to shorter IR wavelengths. Calzetti et al. (2007) and Draine & Li (2007) discuss the physical basis for this correlation.
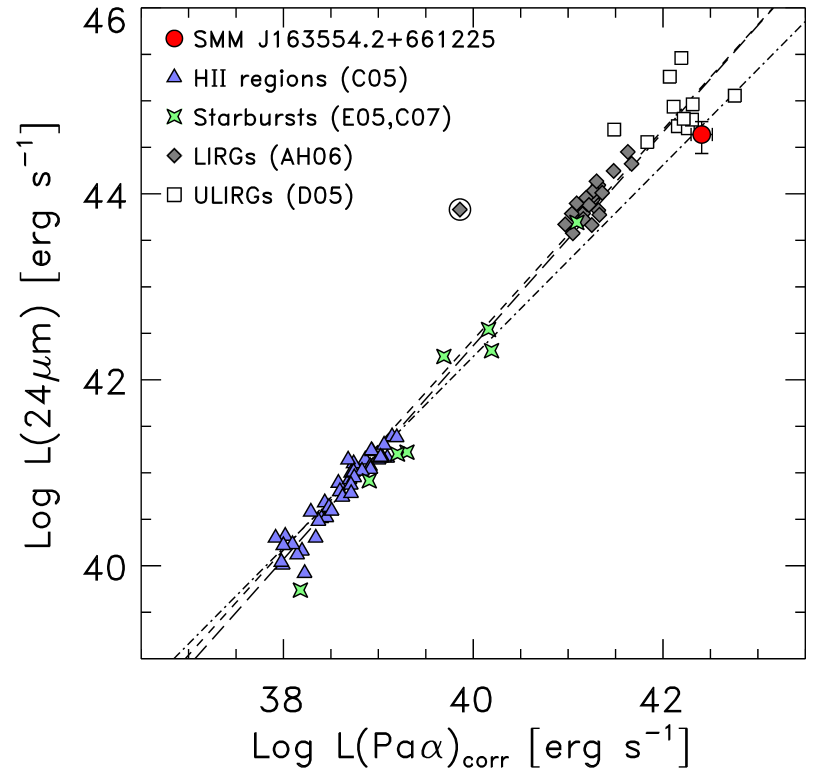
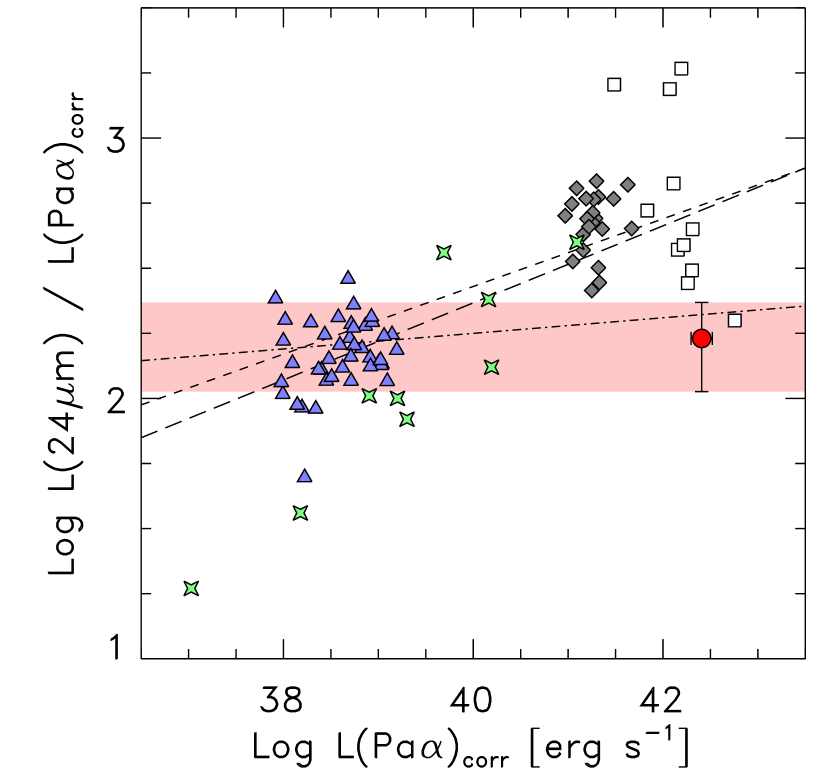
Figure 7 shows the Pa luminosity plotted against the rest–frame 24 µm luminosity derived above for SMM J163554.2+661225 and for local samples (Calzetti et al., 2005, 2007; Engelbracht et al., 2005; Dannerbauer et al., 2005; Alonso-Herrero et al., 2006). Interestingly, SMM J163554.2+661225 has lower than local galaxies of comparable , where the offset is dex. This is more apparent when comparing the ratio of , shown in the right panel of figure 7. Furthermore, because the 70 µm data for SMM J163554.2+661225 is blended (see § 3.2), the rest–frame 24 µm luminosity may be lower than indicated in the figure, making the offset between SMM J163554.2+661225 from the relation for the local samples more pronounced.
SMM J163554.2+661225 has an estimated total IR luminosity, , comparable to local ultraluminous IR galaxies (ULIRGs, ). Figure 7 includes data for local ULIRGs from the sample of Dannerbauer et al. (2005), where we combine their Pa measurements with IRAS 25 µm measurements from the literature666see Moshir, Kopman, & Conrow (1992); the NASA Extragalactic Database (NED), http://nedwww.ipac.caltech.edu/. The Dannerbauer et al. measurements of Pa come from longslit near–IR spectroscopy, and we have made no attempt to correct for emission outside the slit. The Pa-emission in many of local ULIRGs likely results from very compact, nuclear regions, and therefore the spectroscopic slit should contain most of this emission. Nevertheless, we removed from the local ULIRG sample those objects with 2MASS isophotal diameters 15″, and we also removed those objects with spectroscopic signatures of AGN. These steps excluded roughly one–third of the sample, including the most egregious outliers. Nevertheless we caution that significant uncertainty may remain due to primarily unknown Pa emission outside the spectroscopic slit or other aperture effects.
Even with these caveats the local ULIRGs follow the extrapolation of the local and relation, but they show a large scatter. We suspect that the large scatter results for the reasons discussed above, and there may be additional components to the dust heating beyond ionization from early–type stars, including AGN and the ambient galactic emission. However, only one galaxy in the local ULIRG sample has and comparable to SMM J163554.2+661225, and this galaxy (IRAS 04384–4848) has a highly uncertain dust correction (Dannerbauer et al., 2005). This implies that no (or at best, few) low redshift ULIRGs have similar physical conditions producing comparable ratios of mid-IR-to-Pa luminosity.
Kennicutt et al. (2009) combine H emission–line measurements (uncorrected for dust extinction) and IR continuum measurements of local star–forming galaxies, and derive SFR calibrations of the form, . For the IRAC 8 µm and MIPS 24 µm rest–frame bands they obtain and . Using the mid–IR luminosities for SMM J163554.2+661225 derived above, and (Kneib et al., 2004), we obtain and 80 yr-1, for the 8 µm and 24 µm luminosities, respectively. These are lower by factors of 4 and 2 compared to that derived from the Pa luminosity, but they are within the dispersion reported by Kennicutt et al. (2009). The intrinsic SFR of SMM J163554.2+661225 is also considerably larger than the objects used to calibrate these relations (see also Moustakas & Kennicutt 2006), and it is possible the calibrations do not apply under extrapolation. Larger samples of luminous, high–redshift galaxies are needed to test these relations.
5.4. The Nature of SMM J163554.2+661225
SMM J163554.2+661225 appears to host heavily obscured star–formation at a rate, yr-1. The hydrogen ionization rate is s-1, implying SMM J163554.2+661225 may contain as many of O stars (Sternberg et al., 2003). Given the estimate for the molecular–gas mass ( , Kneib et al. 2005), this galaxy could sustain this SFR for Myr. The starburst in SMM J163554.2+661225 has had a duration of 100 Myr based on the analysis of rest–frame UV-to-near-IR SED (see the Appendix) and supported by the strength of the possible CO index (§ 4.2). This is comparable to the dynamical and gas–consumption timescales based on the observations of the molecular gas. Because the gas–consumption timescale is consistent with the dynamical time and the starburst age, SMM J163554.2+661225 is likely about midway through this stage of enhanced star formation.
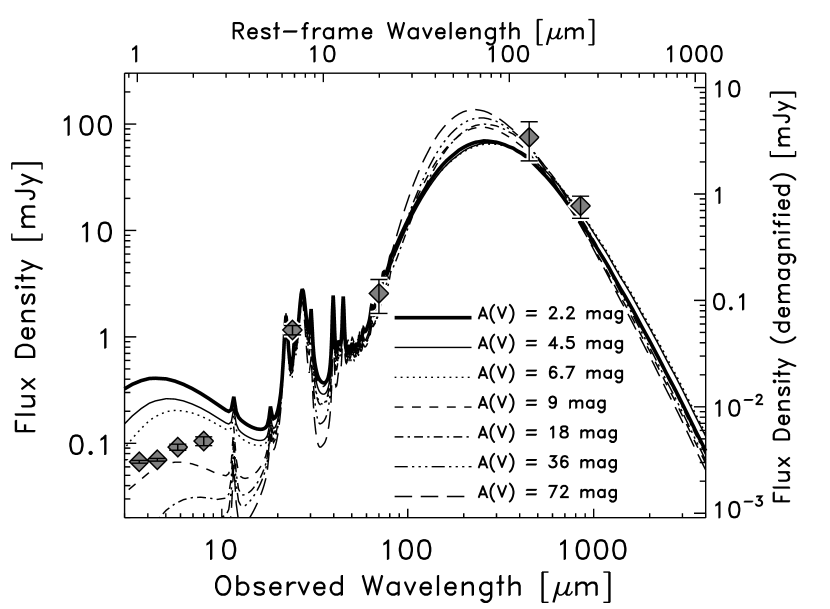
The Pa–derived SFR for SMM J163554.2+661225 is consistent with the SFR implied by the total IR luminosity and the rest–frame 8 µm luminosity. However, the rest–frame 24 µm luminosity is significantly lower than that expected from the Pa luminosity based on the local relations. This implies that SMM J163554.2+661225 lacks a warm (100 K) thermal dust component typical of local IRAS–selected star–forming galaxies of comparable bolometric luminosity (Lonsdale Persson & Helou, 1987; Calzetti et al., 2000), which drives the non–linear relationship between the mid–IR luminosity and the Pa luminosity (e.g., Calzetti et al., 2007). Indeed, the thermal dust emission of SMM J163554.2+661225 (see figure 5) peaks near 100 µm, and is consistent with nearly pure emission from dust with temperature, K, and emissivity, . This is very similar to the dust emission of photodissociation regions (PDRs) in the vicinity of H II regions (e.g., Lonsdale Persson & Helou, 1987; Calzetti et al., 2000; Churchwell, 2002). In contrast, the IR SEDs for local galaxies with comparable to SMM J163554.2+661225 have significant contributions of warm ( K) dust to the IR emission (e.g., Chary & Elbaz, 2001; Dale & Helou, 2002; Siebenmorgen & Krügel, 2007; Rieke et al., 2009). This is a qualitatively different than what is observed in SMM J163554.2+661225. Indeed, the fact that no galaxies in the local ULIRG sample have values as low as SMM J163554.2+661225 implies that star formation in some high–redshift galaxies with ULIRG luminosities is fundamentally different. The lower ratio, , for SMM J163554.2+661225 implies a lower starlight intensity than that in local galaxies of comparable bolometric luminosity (Draine & Li, 2007). Therefore, while SMM J163554.2+661225 appears to host a massive starburst that is similar to local star–forming regions, it is dramatically “scaled–up” in luminosity (and presumably SFR).
This conclusion is supported by a comparison of the mid–IR and far–IR emission of SMM J163554.2+661225 to the models of Siebenmorgen & Krügel (2007), who calculate the IR emission for PDR–like regions with spherical symmetry of variable size surrounding H II regions ionized by a starburst with a variable fraction of the luminosity coming from OB associations. As illustrated in figure 8, the best–fitting models from Siebenmorgen & Krügel correspond to an obscured stellar population where % of the luminosity originates from OB associations. Such models require emission from dust clouds with a range of extinction, mag. Models with visual extinction mag that reproduce the data have an intrinsic luminosity , and this must be scaled up by a factors of 10–100 to match the data, producing total IR luminosities in agreement with that derived above (§ 5.1). Scaling the size of the PDR according, this implies a radius for the ionization–front of 3-4 kpc, consistent with the spatial extent of the molecular CO emission of SMM J163554.2+661225 (3 kpc 1.5 kpc, Kneib et al., 2005). Models with higher intrinsic IR luminosity ( ) do not reproduce the data. Models with higher extinction require larger intrinsic luminosities (as much as an order of magnitude larger for the model with mag), and these provide worse fits to the data (thus, they are less physical). Furthermore, models with mag would be optically thick to Pa photons, and cause significant attenuation of the mid–IR emission. While such models are physically motivated in some cases (e.g., Rieke et al., 2009), if this were the case for SMM J163554.2+661225 then the attenuation correction to the Pa luminosity would imply a much larger SFR, which should be substantiated by a larger total IR luminosity. The general agreement between the dust–corrected Pa luminosity and total IR luminosity (§5.1) excludes models with very high extinction.
While the models assume a spherical shell-like dust configuration, in reality the dust clouds are likely clumpy with some covering fraction, where the ionizing H II regions associated with the different OB associations are in close proximity to the dust clouds and PDRs (Wolfire et al., 1990). Models factoring in the covering fraction produce a distribution of dust attenuation (e.g., Dopita et al., 2005), and this is more consistent with the observations. Figure 8 shows that IRAC 3.6, 4.5, 5.8 and 8.0 µm flux densities for SMM J163554.2+661225 are not reproduced simultaneously with the far–IR emission by any of the best-fitting models. Thus, spherical symmetry of the starburst and obscuring PDR seems insufficient to describe both the direct stellar emission and the far–IR emission for this galaxy. Therefore, we conclude that star formation in SMM J163554.2+661225 corresponds to star–forming regions and starbursts in local galaxies with intrinsic luminosities of , but that have been “scaled–up” by one–to–two orders of magnitude. Moreover, this “scaling–up” of star formation may be common at high redshift. For example, Tacconi et al. (2006) argued that the significantly more luminous sub-mm galaxies at resembled “scaled–up” and more gas–rich versions of local ULIRGs. For SMM J163554.2+661225, R08 found that the rest–frame mid–IR spectrum from µm is consistent with the spectra of local starburst galaxies and inconsistent with the spectra of local ULIRGs. Here, our analysis of the far–IR data, coupled with the SFR implied by the luminosity of the Pa line, leads us to a similar conclusion.
The model we constructed in the Appendix using the observed rest–frame UV–near-IR SED consists of a double stellar population. The stellar population that dominates the bolometric emission (and the total SFR) in SMM J163554.2+661225 is very obscured by dust that is optically thick to UV photons. The stellar population of the subdominant model is less obscured, and optically thin to UV photons. This analysis is consistent with the scenario discussed above, where the starburst in SMM J163554.2+661225 corresponds to OB associations in close proximity to PDRs with a clumpy distribution. A similar configuration of multiple star–forming components with variable dust extinction is observed in the spatially resolved colors of other galaxies at , and especially those with evidence for recent mergers (Papovich et al., 2005; Law et al., 2007).
It remains to be seen whether the results discussed here for SMM J163554.2+661225 are typical of other high–redshift galaxies. Our full observing program will produce similar data for eleven gravitationally lensed galaxies in addition to SMM J163554.2+661225, and these will span a wide range of mass, optical, and IR properties. For SMM J163554.2+661225, the baryon (stellar + gas) mass we derived from the rest-frame-UV–to–near-IR SED and the dynamical mass from molecular observations (Kneib et al., 2005) both suggest . This mass is typical of “” UV–selected galaxies at these redshifts (Papovich et al., 2001; Shapley et al., 2001), and such objects likely dominate the SFR density at this redshift (Reddy et al., 2008). However, the dust obscuration and IR luminosity are much larger in SMM J163554.2+661225 compared to the UV–selected samples, and more typical of sub-mm–selected objects (e.g. Blain et al., 2002; Chapman et al., 2005) and IR–luminous –band-selected objects (e.g., Papovich et al., 2006; Daddi et al., 2007; Wuyts et al., 2008). The fact that the molecular–gas–emission centroid lies between the UV–components led Kneib et al. (2005) to argue that the high SFR in SMM J163554.2+661225 results from the merger of two progenitors whose properties are similar to those of “typical” UV–selected galaxies. In this case, we are observing SMM J163554.2+661225 during perhaps a short–lived stage of enhanced star formation. Our study of the SFR indicators in SMM J163554.2+661225 provides the first evidence that the total IR luminosity is proportional to the number of ionizing photons in these situations.
5.5. Final Thoughts
A potential source of bias is that our observations are sensitive to the integrated emission from SMM J163554.2+661225, and we are combining datasets with a wide range of angular resolution. This is of concern as as our analysis corresponds to the flux–weighted average of the star–formation properties of an individual galaxy. The analysis of the rest–frame UV–to–near-IR SED (see the Appendix) suggests there are at least two stellar populations, with very different extinction properties. Nevertheless, our results probably apply to the dominant, most luminous star–forming components, which dominate the nebular emission (Pa) and the IR emission. Therefore, we suspect that our results are valid for the average properties of SMM J163554.2+661225. We note that similar issues arise in the analysis of the integrated properties of the starburst galaxies (Engelbracht et al., 2005; Alonso-Herrero et al., 2006; Calzetti et al., 2007), and some caution must be applied then when comparing these with, for example, the analysis of individual H II regions which are resolved in both the narrow–band imaging of the hydrogen recombination lines and the mid–IR data (Calzetti et al., 2005, 2007). Achieving resolved observations of the Pa emission and far–IR emission in SMM J163554.2+661225 may be possible with the James Webb Space Telescope and large–aperture sub–mm facilities. However, further work will be needed to quantify possible biases in the integrated emission from galaxies.
6. SUMMARY
We observed the galaxy SMM J163554.2+661225 at with Spitzer spectroscopy from 5.8–8.0 µm. These data are the deepest Spitzer/IRS data taken with the SL2 module of any galaxy of which we are aware. SMM J163554.2+661225 is a sub-millimeter–selected infrared-luminous galaxy, and is lensed gravitationally with a magnification of by the rich galaxy cluster Abell 2218. This galaxy is maintaining a high rate of star formation based on its IR emission, and it has no evidence for an AGN in either its rest–frame UV or optical spectra, nor based on its (lack of) X-ray activity. We find that the rest-frame–UV–to–near-IR SED of SMM J163554.2+661225 is best represented by the superposition of a double stellar population with a varying amount of dust attenuation, and with a total stellar mass of (corrected for the gravitational lensing magnification). In this model the stellar population that dominates the star formation is heavily extincted, mag, while the subdominant stellar population is optically thin to UV photons.
We detected the Pa emission line in the Spitzer spectrum with a redshift . The luminosity of the Pa emission line is erg s-1, corrected for the gravitational–lensing magnification, with a rest-frame equivalent width EW Å. We compared the Pa luminosity to the H luminosity and derived a nebular extinction of mag, although this depends on the assumed attenuation law and remains a systematic uncertainty. This is consistent with that derived from modeling of the galaxy’s rest–frame UV-to-near-IR SED, and implies that the dust attenuation affects the ionized gas and stars uniformly. The dust–corrected Pa luminosity is erg s-1, corrected for the gravitational lensing magnification. This corresponds to an ionization rate of s-1, implying SMM J163554.2+661225 contains on the order of O stars. Assuming an IMF with a Salpeter–like slope from 0.1 to 100 yields a SFR yr-1.
The Pa–derived SFR agrees with the upper range of SFR implied by the total IR luminosity. The uncertainty on the total IR luminosity is a factor of order two, primarily due to the lack of data at 100–300 µm (rest–frame 30–100 µm). The measured Pa and rest–frame 8 µm luminosities are consistent with the extrapolated relation observed in local galaxies and star–forming regions. This implies that both the monochromatic 8 µm and total IR luminosities are dominated by heating from ongoing star–formation and they are proportional to the number of ionizing photons. However, the measured rest–frame 24 µm luminosity is significantly lower in SMM J163554.2+661225 compared to local galaxies with comparable Pa luminosity. Thus, SMM J163554.2+661225 appears to lack a warmer dust component ( K), which is typical in local galaxies of comparable . The nature of SMM J163554.2+661225 seems very different from the properties of local ULIRGs, even though they have comparable SFRs. Comparing the IR emission of SMM J163554.2+661225 to expectations from empirical and radiative transfer models, we conclude that the starburst in SMM J163554.2+661225 has similar physics as those in local galaxies with intrinsic luminosities, , but “scaled–up” by one–to–two orders of magnitude.
The implied stellar and dynamical masses of SMM J163554.2+661225 are consistent with those of typical “” UV–selected objects, which dominate the SFR density at this redshift. The implied timescales and starburst age are on the order of the dynamical time, implying that this galaxy is only part way through its elevated star–formation episode. Our analysis here provides the best measurement yet of the SFR in a galaxy involved in such an episode and it shows that the IR–luminosity traces the total SFR in this situation. While our analysis here pertains to only one galaxy of any significant redshift, as we extend this work to our larger sample, it will allow us to study galaxies spanning a wider range of star–forming properties and luminosities.
APPENDIX
Stellar Population Fitting
Photometry is available for SMM J163554.2+661225 from HST/WFPC2 (), WHT/INGRID (), and Spitzer/IRAC (channels 1–4), spanning 0.5–8 µm in the observed frame (K04, R08). We show the SED of this galaxy in figure 9. We fitted a suite of stellar population synthesis models to these data to estimate the properties of the stellar populations in this galaxy. We used both the models of Bruzual & Charlot (2003) and the updated 2007 version, which include a more physically motivated treatment of the thermally pulsating asymptotic giant branch stars. We use models with a Chabrier IMF, although for consistency with other SFR indicators, we multiply the derived stellar masses and SFRs by a factor of 1.8 to convert them to equivalent quantities using a Salpeter-like IMF. We allow for a range of exponentially declining star–formation histories with e–folding time Myr (“instantaneous burst”) to Gyr (“constant” star-formation), metallicities of 0.2 and 1.0 , and we allow a range of dust extinction using the Calzetti et al. (2000) law with . We note that this dust law may be inappropriate for heavily obscured sources such as SMM J163554.2+661225 (see Goldader et al., 2002), but it provides a useful comparison to other work modeling galaxy spectral energy distributions (SEDs). See Papovich et al. (2001, 2006) for details of the SED fitting.
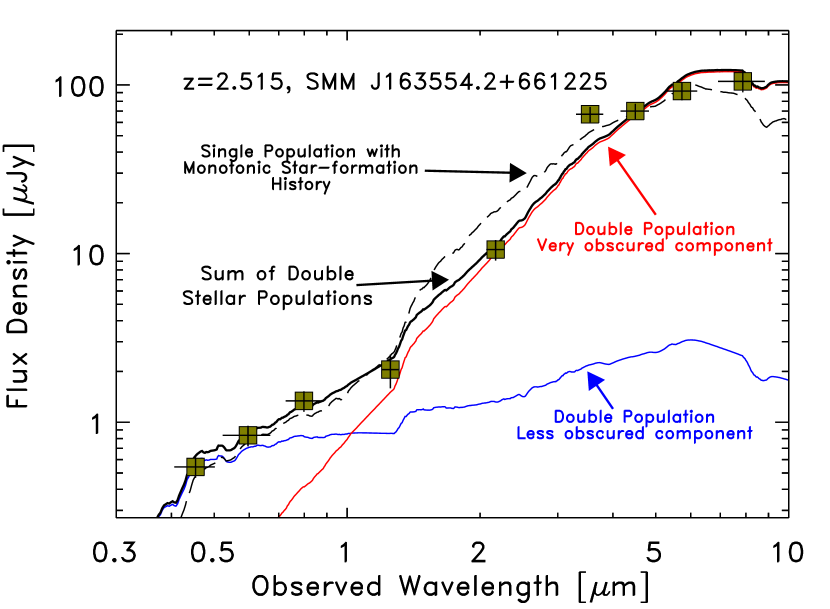
We find that the photometry are not well fit by simple models with single component, exponentially declining star–formation histories, as illustrated in figure 9. Moreover, the best–fit single–component model is unphysical. It has a stellar mass of, (corrected for the gravitational lensing magnification), stellar population age, Gyr (greatly exceeding the age of the Universe at this redshift) , formed with a star–formation e–folding timescale, Myr, and with a color excess, . The reduced for the best–fitting single– component model is .
SMM J163554.2+661225 likely consists of multiple star–forming components, with variable extinction and star–formation properties, all of which contribute to the rest–frame UV through IR emission. Such situations are seen in local IR–luminous galaxies (e.g., Charmandaris, Le Floc’h, & Mirabel, 2004), and arguably apply to high redshift galaxies as well. As discussed by K04, HST and ground–based imaging shows that SMM J163554.2+661225 consists of several distinct blue components, with a luminous red core. We therefore tested SED models consisting of two star–forming components. We find that this “Double Stellar Population” produces a better fit to the photometry, where the two components correspond to a very dust–obscured star-forming component, and a less obscured component. Figure 9 shows a characteristic model that reproduce the data. The reduced of the fit to the data for the models in the figure is , greatly improved over the single–component model above. In these models, the “very obscured component” dominates both the SFR and the total stellar mass. In the figure, the very obscured component consists of a stellar population forming with a constant SFR with an age, Myr, and a color excess, , corresponding to mag, stellar mass, , and SFR, yr-1 (the stellar mass and SFR have been corrected for the gravitational lensing magnification). The derived color excess is much larger than those derived for UV–selected galaxies at this redshift (Papovich et al., 2001; Shapley et al., 2001), but is approximately in the range of those derived for sub–mm selected at this redshift (Borys et al., 2005). Also, the dust extinction we derived from modeling the rest–frame UV-to-near-IR SED here is consistent with that derived from the H and Pa emission–line ratio, and implies that the dust attenuation affects the ionized gas and stars uniformly. The subdominant “less obscured component” of the double–component model consists of a young stellar population, Myr, with a star-formation e–folding timescale, Myr, moderate color excess, , stellar mass, , and SFR, yr-1 (the stellar mass and SFR have been corrected for the gravitational lensing magnification). The extinction in this component is consistent with the upper range seen in LBGs at this redshift (Papovich et al., 2001; Shapley et al., 2001).
Combined with the total gas mass, (Kneib et al., 2005), the total baryonic mass is , which is consistent with the estimate of the dynamical mass of the system as inferred from the molecular gas (Kneib et al., 2005). Therefore, we conclude generally that while the SED of SMM J163554.2+661225 is complex, it is broadly consistent with a multiple component starburst, with total stellar mass , where a deeply obscured component is responsible for for the vast majority ( 80%) of the SFR.
References
- Alexander et al. (2005) Alexander, D. M., Bauer, F. E., Chapman, S. C., Smail, I., Blain, A. W., Brandt, W. N., & Ivison, R. J. 2005, ApJ, 632, 736
- Alonso-Herrero et al. (2006) Alonso-Herrero, A., Rieke, G. H., Rieke, M. J., Colina, L., Pérez-González, P. G., & Ryder, S. D. 2006, ApJ, 650, 835
- Armus et al. (2007) Armus, L., et al. 2007, ApJ, 656, 148
- Blain et al. (2002) Blain, A. W., Smail, I., Ivison, R. J., Kneib, J.-P., & Frayer, D. T. 2002, Phys. Rep., 369, 111
- Borys et al. (2005) Borys, C., Smail, I., Chapman, S. C., Blain, A. W., Alexander, D. M., & Ivison, R. J. 2005, ApJ, 635, 853
- Bouché et al. (2007) Bouché, N., et al. 2007, ApJ, 671, 303
- Bouwens et al. (2006) Bouwens, R. J., Illingworth, G. D., Blakeslee, J. P., & Franx, M. 2006, ApJ, 653, 53
- Bruzual & Charlot (2003) Bruzual, G. A., & Charlot, S. 2003, MNRAS, 344, 1000
- Calzetti et al. (2000) Calzetti, D., Armus, L., Bohlin, R. C., Kinney, A. L., Koornneef, J., & Storchi-Bergmann, T. 2000, ApJ, 533, 682
- Calzetti et al. (2005) Calzetti, D., et al. 2005, ApJ, 633, 871
- Calzetti et al. (2007) Calzetti, D., et al. 2007, ApJ, 666, 870
- Cardelli, Clayton, & Mathis (1989) Cardelli, J. A., Clayton, G. C., & Mathis, J. S. 1989, ApJ, 345, 245
- Caputi et al. (2006) Caputi, K. I., et al. 2006, ApJ, 637, 727
- Chapman et al. (2005) Chapman, S. C., Blain, A. W., Smail, I., & Ivison, R. J. 2005, ApJ, 622, 772
- Charmandaris, Le Floc’h, & Mirabel (2004) Charmandaris, V., Le Floc’h, E., & Mirabel, I. F. 2004, ApJ, 600, L15
- Chary & Elbaz (2001) Chary, R. R., & Elbaz, D. 2001, ApJ, 556, 562
- Churchwell (2002) Churchwell, E. 2002, ARA&A, 40, 27
- Daddi et al. (2005) Daddi, E., et al. 2005, ApJ, 631, L13
- Daddi et al. (2007) Daddi, E., et al. 2007, ApJ, 670, 156
- Dale & Helou (2002) Dale, D. A., & Helou, G. 2002, ApJ, 576, 159
- Dannerbauer et al. (2005) Dannerbauer, H., Rigopoulou, D., Lutz, D., Genzel, R., Sturm, E., & Moorwood, A. F. M. 2005, A&A, 441, 999
- Díaz-Santos et al. (2008) Díaz-Santos, T., Alonso-Herrero, A., Colina, L., Packham, C., Radomski, J. T., & Telesco, C. M. 2008, ApJ, 685, 211
- Dickinson et al. (2003) Dickinson, M., Papovich, C., Ferguson, H. C., & Budavári, T. 2003, ApJ, 587, 25
- Dole et al. (2004) Dole, H., et al. 2004, ApJS, 154, 87
- Dopita et al. (2005) Dopita, M. A., et al. 2005, ApJ, 619, 755
- Doyon et al. (1994) Doyon, R., Joseph, R. D., & Wright, G. S. 1994, ApJ, 421, 101
- Draine (1989) Draine, B. T. 1989, Infrared Spectroscopy in Astronomy, 290, 93
- Draine & Li (2007) Draine, B. T., & Li, A. 2007, ApJ, 657, 810
- Draine et al. (2007) Draine, B. T., et al. 2007, ApJ, 663, 866
- Dunne et al. (2000) Dunne, L., Eales, S., Edmunds, M., Ivison, R., Alexander, P., & Clements, D. L. 2000, MNRAS, 315, 115
- Engelbracht et al. (2005) Engelbracht, C. W., Gordon, K. D., Rieke, G. H., Werner, M. W., Dale, D. A., & Latter, W. B. 2005, ApJ, 628, L29
- Erb et al. (2006) Erb, D. K., Steidel, C. C., Shapley, A. E., Pettini, M., Reddy, N. A., & Adelberger, K. L. 2006, ApJ, 647, 128
- Fazio et al. (2004) Fazio, G. G., et al. 2004, ApJS, 154, 10
- Förster Schreiber et al. (2004) Förster Schreiber, N. M., Roussel, H., Sauvage, M., & Charmandaris, V. 2004, A&A, 419, 501
- Franx et al. (2008) Franx, M., van Dokkum, P. G., Schreiber, N. M. F., Wuyts, S., Labbé, I., & Toft, S. 2008, ApJ, 688, 770
- Giavalisco et al. (2004) Giavalisco, M., et al. 2004, ApJ, 600, L103
- Goldader et al. (1995) Goldader, J. D., Joseph, R. D., Doyon, R., & Sanders, D. B. 1995, ApJ, 444, 97
- Goldader et al. (2002) Goldader, J. D., Meurer, G., Heckman, T. M., Seibert, M., Sanders, D. B., Calzetti, D., & Steidel, C. C. 2002, ApJ, 568, 651
- Gordon et al. (2005) Gordon, K. D., et al. 2005, PASP, 117, 503
- Hopkins (2004) Hopkins, A. M. 2004, ApJ, 615, 209
- Hopkins & Beacom (2006) Hopkins, A. M., & Beacom, J. F. 2006, ApJ, 651, 142
- Houck et al. (2004a) Houck, J. R., et al. 2004a, ApJS, 154, 18
- Houck et al. (2004b) Houck, J. R., et al. 2004b, ApJS, 154, 211
- Kennicutt (1998) Kennicutt, R. C., Jr. 1998, ARA&A, 36, 189
- Kennicutt et al. (2007) Kennicutt, R. C., Jr., et al. 2007, ApJ, 671, 333
- Kennicutt et al. (2009) Kennicutt, R. C., Jr., et al. 2009, ApJ, in press (arXiv:0908.0203v1)
- Kewley et al. (2002) Kewley, L. J., Geller, M. J., Jansen, R. A., & Dopita, M. A. 2002, AJ, 124, 3135
- Kneib et al. (2004) Kneib, J.-P., van der Werf, P. P., Kraiberg Knudsen, K., Smail, I., Blain, A., Frayer, D., Barnard, V., & Ivison, R. 2004, MNRAS, 349, 1211 (K04)
- Kneib et al. (2005) Kneib, J.-P., Neri, R., Smail, I., Blain, A., Sheth, K., van der Werf, P., & Knudsen, K. K. 2005, A&A, 434, 819
- Kriek et al. (2008) Kriek, M., et al. 2008, ApJ, 677, 219
- Law et al. (2007) Law, D. R., Steidel, C. C., Erb, D. K., Pettini, M., Reddy, N. A., Shapley, A. E., Adelberger, K. L., & Simenc, D. J. 2007, ApJ, 656, 1
- Li & Draine (2002) Li, A., & Draine, B. T. 2002, ApJ, 572, 232
- Lonsdale Persson & Helou (1987) Lonsdale Persson, C. J., Helou, G. 1987, ApJ, 314, 513
- Madau et al. (1996) Madau, P., Ferguson, H. C., Dickinson, M. E., Giavalisco, M., Steidel, C. C., & Fruchter, A. 1996, MNRAS, 283, 1388
- Moshir et al. (1992) Moshir, M., Kopman, G., & Conrow, T. A. O. 1992, Pasadena: Infrared Processing and Analysis Center, California Institute of Technology, 1992
- Moustakas & Kennicutt (2006) Moustakas, J., & Kennicutt, R. C. 2006, ApJS, 164, 81
- Osterbrock (1989) Osterbrock, D. E. 1989, Astrophysics of Gaseous Nebulae and Active Galactic Nuclei (Mill Valley: Univ. Science Books)
- Papovich et al. (2001) Papovich, C., Dickinson, M., & Ferguson, H. C. 2001, ApJ, 559, 620
- Papovich et al. (2005) Papovich, C., Dickinson, M., Giavalisco, M., Conselice, C. J., & Ferguson, H. C. 2005, ApJ, 631, 101
- Papovich et al. (2006) Papovich, C., et al. 2006, ApJ, 640, 92
- Papovich et al. (2007) Papovich, C., et al. 2007, ApJ, 668, 45
- Pérez-González et al. (2005) Pérez-González, P. G., et al. 2005, ApJ, 630, 82
- Pettini & Pagel (2004) Pettini, M., & Pagel, B. E. J. 2004, MNRAS, 348, L59
- Pope et al. (2006) Pope, A., et al. 2006, MNRAS, 370, 1185
- Pope et al. (2008) Pope, A., et al. 2008, ApJ, 675, 1171
- Reddy et al. (2006) Reddy, N. A., Steidel, C. C., Fadda, D., Yan, L., Pettini, M., Shapley, A. E., Erb, D. K., & Adelberger, K. L. 2006, ApJ, 644, 792
- Reddy et al. (2008) Reddy, N. A., Steidel, C. C., Pettini, M., Adelberger, K. L., Shapley, A. E., Erb, D. K., & Dickinson, M. 2008, ApJS, 175, 48
- Ridgway et al. (1994) Ridgway, S. E., Wynn–Williams, C. G., & Becklin, E. E. 1994, ApJ, 428, 609
- Rieke & Lebofsky (1985) Rieke, G. H. & Lebofsky, M. 1985, ApJ, 228, 618
- Rieke et al. (2004) Rieke, G., et al. 2004, ApJS, 154, 25
- Rieke et al. (2009) Rieke, G. H., Alonso-Herrero, A., Weiner, B. J., Pérez-González, P. G., Blaylock, M., Donley, J. L., & Marcillac, D. 2009, ApJ, 692, 556
- Rigby et al. (2008) Rigby, J. R., et al. 2008, ApJ, 675, 262 (R08)
- Roussel et al. (2001) Roussel, H., Sauvage, M., Vigroux, L., & Bosma, A. 2001, A&A, 372, 427
- Rudnick et al. (2003) Rudnick, G., et al. 2003, ApJ, 599, 847
- Rudnick et al. (2006) Rudnick, G., et al. 2006, ApJ, 650, 624
- Sawicki & Thompson (2006) Sawicki, M., & Thompson, D. 2006, ApJ, 648, 299
- Scoville et al. (2000) Scoville, N. Z., et al. 2000, AJ, 119, 991
- Shapley et al. (2001) Shapley, A. E., Steidel, C. C., Adelberger, K. L., Dickinson, M., Giavalisco, M., & Pettini, M. 2001, ApJ, 562, 95
- Siana et al. (2008) Siana, B., Teplitz, H. I., Chary, R.-R., Colbert, J., & Frayer, D. T. 2008, ApJ, 689, 59
- Siana et al. (2009) Siana, B., et al. 2009, ApJ, in press (arXiv:0904.1742)
- Siebenmorgen & Krügel (2007) Siebenmorgen, R., & Krügel, E. 2007, A&A, 461, 445
- Smith et al. (1996) Smith, D. A., Herter, T., Haynes, M. P., Beichman, C. A., Gautier, T. N., III 1996, ApJS, 104, 217
- Smith et al. (2007) Smith, J. D. T., et al. 2007, ApJ, 656, 770
- Spoon et al. (2007) Spoon, H. W. W., Marshall, J. A., Houck, J. R., Elitzur, M., Hao, L., Armus, L., Brandl, B. R., & Charmandaris, V. 2007, ApJ, 654, L49
- Steidel et al. (1999) Steidel, C. C., Adelberger, K. L., Giavalisco, M., Dickinson, M., & Pettini, M. 1999, ApJ, 519, 1
- Sternberg et al. (2003) Sternberg, A., Hoffmann, T. L., & Pauldrach, A. W. A. 2003, ApJ, 599, 1333
- Stetson (1987) Stetson, P. B. 1987, PASP, 99, 191
- Tacconi et al. (2006) Tacconi, L. J., et al. 2006, ApJ, 640, 228
- Teplitz et al. (2007) Teplitz, H. I., et al. 2007, ApJ, 659, 941
- Wang & Heckman (1996) Wang, B., & Heckman, T. M. 1996, ApJ, 457, 645
- Webb et al. (2006) Webb, T. M. A., et al. 2006, ApJ, 636, L17
- Wolfire et al. (1990) Wolfire, M. G., Tielens, A. G. G. M., & Hollenbach, D. 1990, ApJ, 358, 116
- Wuyts et al. (2008) Wuyts, S., Labbé, I., Schreiber, N. M. F., Franx, M., Rudnick, G., Brammer, G. B., & van Dokkum, P. G. 2008, ApJ, 682, 985