Measurement of properties at CDF
Abstract
The meson is composed of two heavy quarks of distinct flavor. Measurements of its lifetime and production properties have been made based on semileptonic decays using data collected with the CDF II detector corresponding to an integrated luminosity of 1 fb-1. The average lifetime is measured to be 142.5(stat) . The measurements of the ratio of the production cross section times branching ratio of relative to were done for two thresholds: for 4 GeV/ as and for 6 GeV/ as .
I Introduction
The meson charge_conjugate is composed of an anti-bottom quark and a charm quark . The presence of two relatively heavy quarks with different flavors is unique to the system and affects the decay and production properties. The theoretically predicted lifetime kiselev is about a factor of three times smaller than that of other B mesons. The expected production cross section chang is about 3 orders of magnitude lower than the production cross section of the CDF-bplus-Xsect . The first observation of the was made using data taken with the CDF detector at the Fermilab Tevatron during run I bc-observation . Precise mass measurements have been made by the CDF Collaboration using fully reconstructed decays, where decays through bc-mass .
In this work we report preliminary measurements of the lifetime in the semileptonic decay modes and , and the production cross section times branching ratio of the decay mode relative to the decay. The results presented here are based on a data sample with an integrated luminosity of 1 fb-1 at =1.96 TeV collected by the CDF II detector.
II The lifetime measurement concept
To measure the lifetime of the , we construct a per event lifetime that is defined using variables measured in the transverse plane. If all of the decay products of the decay are identified, the lifetime is the lifetime of the meson in its rest frame measured in units of microns of light travel time. It is expressed as
| (1) |
where is the mass of the , is the momentum of the in the plane transverse to the direction of the proton beam, and is the decay length of the projected along the transverse momentum. The mass of the used in this measurement is GeV/c2 bc-mass . However, we do not measure all of the particles in the semileptonic final state. Instead we must define a pseudo lifetime
| (2) |
where and are evaluated using the system. We can obtain the true lifetime by defining a factor , where . We evaluate the factor distribution, , for events using Monte Carlo simulation. We are then able to express the distribution of for as
| (3) |
where is the average lifetime, represents the estimated error on the measurement of for each event, and is defined as
| (4) |
The measurement of the average lifetime is be carried out by minimizing , which is evaluated for the candidate events. is the likelihood function for the and measured in candidate events and includes as a free parameter.
III The cross section measurement concept
We measure
| (5) |
The basic strategy of the cross section measurement is to reconstruct the number of relative to the number of candidates, , determine the relative detector and reconstruction efficiency, = , and use these to determine the ratio of the final production cross section times branching ratio.
IV The event selection
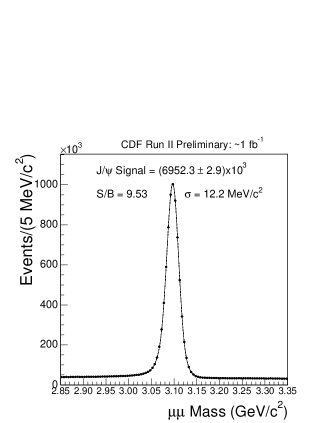
The analysis presented here is based on the events recorded with a di-muon trigger that is dedicated to decays. Both analysis use the same sample. The muon pair is reconstructed within a pseudo-rapidity range 1.0. We select about 6.9106 candidates, measured with a mass resolution of approximately 12 MeV/. The di-muon invariant mass distribution is shown in Fig. 1.
In addition to the di-muons from the decay, we require a third track that is matched to the same vertex as the . This third track can be from any of three samples of interest: X decays, decays, or just decays. The last sample represents sources of backgrounds to the semileptonic decay.
V The backgrounds overview
V.1 Common for both analysis
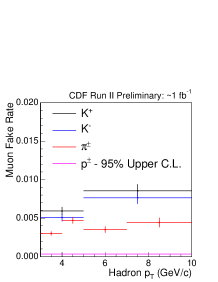
Both the lifetime and cross section analysis have some common sources of background: misidentified , misidentified third muons, and backgrounds. The misidentified background occurs when one of the muons is actually a mis-reconstructed hadron or muon from other sources that produce a mass consistent with that of the . The misidentified third muon background can arise from the following sources. The in the system is highly populated by non- sources. The third track associated with the could be a or that can either decay-in-flight or punch-through the calorimeter and the steel absorber and produce the muon signature. The events represent cases when a is produced from one jet and the third muon originates from the other in same event.
Figure 2 shows the misidentified muon rates for , , and p() and the pseudo-proper decay length ct∗ for misidentified third muons.
V.2 Specific for each analysis
There is an additional background for the cross section measurement. The selected sample contains contributions from other decays with a tri-muon in the final state. For example, a can decay into followed by .
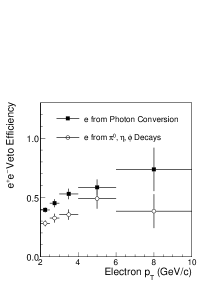
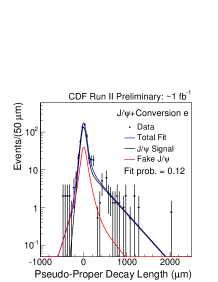
The following backgrounds are specific to the lifetime analysis: misidentified e±, residual conversions, and prompt . The misidentified e± can arise from cases when a , K±, or from the system satisfies the e± likelihood function based on the calorimeter responses. The residual conversions are e± from -conversion or Dalitz decays. The prompt are additional candidates where the originates from prompt non- sources. Figure 3 illustrates the veto efficiencies and the pseudo-proper decay length ct∗ distribution for the +Conversion e background sample.
VI The lifetime results
VI.1 Lifetime systematic uncertainties
The systematic uncertainties in the lifetime measurement originate from uncertainties in our models for background and signal events. Some of the largest systematic uncertainties are summarized below:
-
•
Resolution function - choice of model for detector resolution: 3.8
-
•
Pythia model for background - relative contribution of QCD processes: 2.4
-
•
Vertex detector alignment - uncertainties in the positions of silicon detectors: 2.0
-
•
veto efficiency - uncertainties related to modeling veto efficiencies: 1.5
-
•
spectrum - variations of the K factor distribution due to variations in the production spectrum: 1.3
We add the individual uncertainties in quadrature to obtain a total uncertainty of 5.5 .
VI.2 Lifetime results
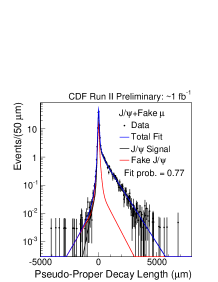
We fit the distributions for signal candidates in the and channels separately using likelihood functions based on our models for signal and background events. The fitted data is shown in Fig. 4 for and for decays.
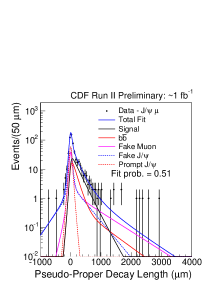
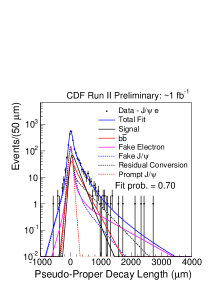
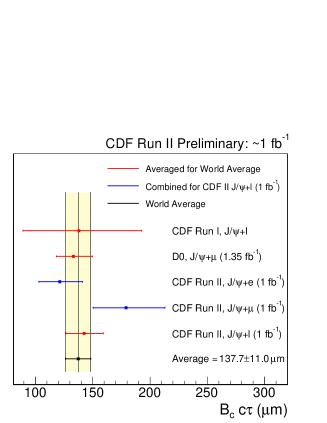
The lifetime is found to be 179.1(stat) for the final state and 121.7 (stat) for the decay mode, respectively. We performed the simultaneous fit of both samples and found an average lifetime of 142.5 . Figure 5 shows our average lifetime comparison with other measurements.
VII The relative cross section
In order to measure the relative cross section we need to find the numbers of and , ) and ), and determine the relative efficiency, = . We select 229 (214) candidates with the requirement 4 (6) GeV/, respectively. The number of signal events after backgrounds subtraction is presented in the following subsection. The number of signal events is found to be 2333 55 (2299 53) for 4 (6) GeV/, respectively. The combinatoric and contributions are subtracted.
VII.1 The backgrounds and excess
The backgrounds and the resulting number of signal events for the decays are summarized in Table 1.
| 4 GeV/ | 6 GeV/ | |
|---|---|---|
| ) observed | 22915.1(stat) | 21414.6(stat) |
| Misidentified | 21.53.3(stat) | 20.53.2(stat) |
| Misid. third muon | 55.82.0(stat) | 53.61.9(stat) |
| Doubly misid. | -8.80.4(stat) | -7.50.3(stat) |
| background | 37.77.3(st+sys) | 35.47.0(st+sys) |
| Other modes | 5.20.5(stat) | 4.80.4(stat) |
| Total background | 111.48.3(stat) | 106.98.0(stat) |
| signal | 117.617.2(stat) | 107.116.7(stat) |
The background identified as “Doubly misidentified” in Table 1 represents the subsample of misidentified and misidentified third muons that needs to be subtracted only once to avoid double counting.
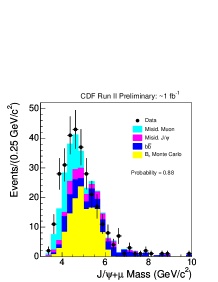
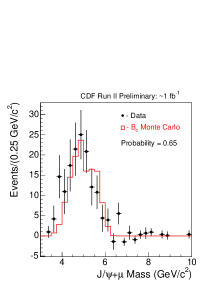
Figure 6 shows the invariant mass distribution of the data events with the experimental backgrounds and a Monte Carlo simulation of the signal sample superimposed (left), and with the background subtracted (right).
VII.2 The relative efficiency
In order to determine the relative efficiency, we simulate , , and decays. As a description of the spectrum for we use the most recent theoretical work by Chang et al. chang . For the we used the spectrum from Ref. FONLL , which is found to be in good agreement with CDF measurements. All Monte Carlo simulation events are passed through the full detector and trigger simulation. The Monte Carlo simulation samples were processed in the same way as for the data. The efficiencies and for 4 (6) GeV/, along with the relative efficiency, are presented in Table 2.
| Efficiency | 4 GeV/ | 6 GeV/ |
|---|---|---|
| (%) | ||
| (%) | ||
| (stat) | (stat) |
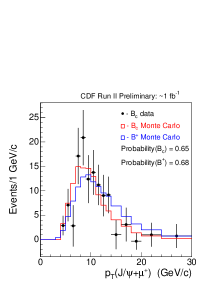
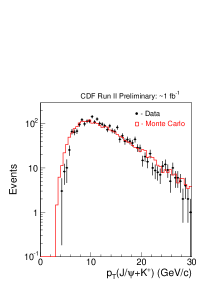
The spectra for data and Monte Carlo simulation are shown in Fig. 7.
VII.3 Cross section systematic uncertainties
We divide the systematic uncertainties into two categories: uncertainties on the number of signal events and uncertainties in the determination of the relative efficiency.
VII.3.1 background uncertainty
The systematic uncertainty considered in the determination of arise from events which do not originate from decays. All backgrounds are assigned a systematic uncertainty except the misidentified background. Since the estimation of this background is determined directly from the sidebands of the , we do not know of any source of systematic error that should be included.
The largest source of uncertainty in the misidentified third muon calculation is due to the poor knowledge of the proton fraction in the sample. The particle identification method, dE/dx, does not allow us to separate protons from kaons in our kinematic region. Consequently, we measure the proton fraction in other momentum ranges using the time-of-flight (TOF) particle identification combined with dE/dx information and then extrapolate the fraction to our momentum range according to measured trends in Monte Carlo simulation.
The other systematic uncertainty arises from a poor knowledge of non-exclusive branching ratios and is estimated by varying the branching ratios of eleven decay modes that may contribute to the sample of tri-muon events. In order to assign a systematic uncertainty we double and halve the branching ratios of the non-exclusive decays with respect to the rate of . We choose the larger variation in either direction for the systematic uncertainty.
Table 3 summarizes all of the background systematic uncertainties assigned.
| uncertainties | 4 GeV/ | 6 GeV/ |
|---|---|---|
| Misid. third muon | (sys) | (sys) |
| Doubly misid. | (sys) | (sys) |
| Other decays | (sys) | (sys) |
| Total | (sys) | (sys) |
VII.3.2 Relative efficiency systematic uncertainty
We consider the systematic uncertainty in the prediction of the relative efficiency due to the measured statistical uncertainty of the lifetime, knowledge of the production spectra for and , and differences between and triggering rates at the first level of the CDF trigger system, the extremely fast trigger, XFT.
The relative efficiency systematic uncertainty due to lifetime uncertainty is estimated by varying the lifetime by 14 m of its default value. This variation represents approximately one standard deviation in the average lifetime result.
The relative efficiency systematic uncertainty due to the knowledge of spectrum is fully based on the theoretically predicted spectra from work in Ref. chang . We consider the variations between:
-
•
doubling the contribution relative to the nominal approach;
-
•
the pure gluon fusion model, called the fixed flavor number ( FFN) model, and the more complete model, known as the general-mass variable-flavor-number (GMVFN) model;
-
•
the combined spectrum and a pure spectrum.
The systematic uncertainty due to knowledge of the spectrum is estimated by varying the Monte Carlo simulated spectrum below 10 GeV/ to bring it into agreement with the data (see the right plot in Fig. 7. The difference between the nominal and recalculated relative efficiency is assigned as the uncertainty due to spectrum.
Another source of systematic uncertainty that we consider is the different XFT efficiencies of kaons and muons that exist in the data and are not modeled in the simulation.
The total systematic uncertainty is summarized in Table 4.
| uncertainties | 4 GeV/ | 6 GeV/ |
|---|---|---|
| lifetime | ||
| spectrum | 0.720 | 0.298 |
| spectrum | 0.340 | 0.161 |
| XFT systematics | 0.192 | 0.160 |
| Total | 0.720 | 0.298 |
VIII The relative cross section results
We have performed a measurement of the relative production cross section of in inclusive data with an integrated luminosity of 1 fb-1. We have identified a sample of 229 (214) events with an estimated background from all sources of 1118 (1078) events for 4 (6) GeV/, respectively. The final numbers used in the cross section measurement, including systematic uncertainties, are given in Table 5.
| Final values | 4 GeV/ |
|---|---|
| ) | 117.617.2 (stat) (sys) |
| ) | 2333 55 (stat) |
| 5.8670.068 (stat) (sys) | |
| 0.720 ( spectrum) | |
| Final values | 6 GeV/ |
| ) | 107.216.7 (stat) (sys) |
| ) | 229953 (stat) |
| 4.8720.060 (stat) (sys) | |
| 0.298 ( spectrum) |
We give the result for the ratio
with 4 GeV/ thresholds as
and for 6 GeV/ as
.
Of the two results, the measurement with the 6 GeV/ threshold has the lower systematic error. Below 6 GeV/ there is uncertainty in the efficiency that appears to introduce a significant systematic discrepancy between the simulated spectrum and the spectrum as determined from the data.
Using theoretical assumptions and independent measurements, we are then able to calculate the total cross section. Using the measured quantities = Ref:PDG and b for 6 GeV/ CDF-bplus-Xsect , we calculate
for 6 GeV/. Assuming that the branching ratio Ref:BcIvanov , we find the total cross section to be
IX Conclusions
We have performed measurements of the lifetime and production properties based on semileptonic decays using data from collisions collected with the CDF II detector corresponding to an integrated luminosity of 1 fb-1 at =1.96 TeV.
References
- (1) Reference to a particular charge state also implies the charge conjugate state.
- (2) S. Godfrey, Phys. Rev. D 70, 054017 (2004); V.V.Kiselev, arXiv:hep-ph/0308214.
- (3) Chao-Hsi Chang, Phys. Rev. D 72, 114009 (2005).
- (4) A.Abulencia et al. (CDF Collaboration), Phys. Rev. D 75, 012010 (2007).
- (5) A.Abulencia et al. (CDF Collaboration), Phys. Rev. Lett. 97, 012002 (2006).
- (6) T.Aaltonen et al. (CDF Collaboration), Phys. Rev. Lett. 100, 182002 (2008).
- (7) M. Cacciari et al., J. High Energy Phys. 07, 033 (2004).
- (8) C. Amster et al. (Particle Data Group), Phys. Lett. B667, 1 (2008).
- (9) M.A. Ivanov et al., Phys. Rev. D 73, 054024 (2006).