Budding and vesiculation induced by conical membrane inclusions
Abstract
Conical inclusions in a lipid bilayer generate an overall spontaneous curvature of the membrane that depends on concentration and geometry of the inclusions. Examples are integral and attached membrane proteins, viruses, and lipid domains. We propose an analytical model to study budding and vesiculation of the lipid bilayer membrane, which is based on the membrane bending energy and the translational entropy of the inclusions. If the inclusions are placed on a membrane with similar curvature radius, their repulsive membrane-mediated interaction is screened. Therefore, for high inclusion density the inclusions aggregate, induce bud formation and finally vesiculation. Already with the bending energy alone our model allows the prediction of bud radii. However, in case the inclusions induce a single large vesicle to split into two smaller vesicles, bending energy alone predicts that the smaller vesicles have different sizes whereas the translational entropy favors the formation of equal-sized vesicles. Our results agree well with those of recent computer simulations.
pacs:
87.16.Dg, 87.17.-d, 82.70.UvI Introduction
Cell membranes contain large amounts of proteins within or attached to the lipid bilayer Dupuy and Engelman (2008). The distribution of the proteins is not necessarily homogeneous, which can have important functional consequences. For example, proteins with an intrinsic curvature couple to the bilayer conformation Sens et al. (2008); Drin et al. (2007); Blood and Voth (2006); Auth and Gompper (2005); Bickel and Marques (2002); Ford et al. (2002); Harden and Mackintosh (1994); on the one hand, such proteins are preferably found on similarly curved parts of the membrane Hagerstrand et al. (2006), on the other hand, the proteins deform the membrane locally Kozlov (2007); Antonny (2006). Asymmetric, curved proteins can regulate the polymerization of the three-dimensional cytoskeleton of the cell Shlomovitz and Gov (2007) and control intracellular transport via endocytosis Römer et al. (2007); McMahon and Gallop (2005). Virus endocytosis can occur via the same mechanism Gao et al. (2005); Góźdź (2007). The conical inclusions in our model mimick asymmetric proteins within the bilayer Ford et al. (2002), proteins or polymers attached to the bilayer Blood and Voth (2006); Auth and Gompper (2003); Tsafrir et al. (2003), curved lipid domains Campelo et al. (2007); Baumgart et al. (2003); Haluska et al. (2002); Góźdź and Gompper (2001), and viruses that bind to the membrane Gao et al. (2005).
The interaction between the inclusions in a lipid bilayer is mediated by membrane deformations and thermal undulations Bruinsma and Pincus (1996); Goulian (1996), in addition to surface tension Sens et al. (2008) and possible direct interactions that we do not consider in this paper. The deformation-induced, pairwise interaction of curved inclusions occurs in the absence of thermal membrane undulations and is usually repulsive Goulian et al. (1993a, b); in a planar membrane it is long-range Weikl et al. (1998); Goulian et al. (1993a, b). However, the interactions can be strongly screened if the average curvature of the membrane and the protein curvature are similar Chou et al. (2001); Kim et al. (1998); Dommersnes et al. (1998). One obvious example for strongly screened interactions are inclusions that are placed on a vesicle with similar curvature radius Dommersnes et al. (1998). Screening can also be achieved by many-body interaction in clusters of inclusions Kim et al. (1999, 1998). At finite temperature, Casimir-like interactions due to membrane undulations generate attraction Helfrich and Weikl (2001); Weikl (2001); Golestanian et al. (1996a, b); Goulian et al. (1993a, b).
Curvature generation by inclusions and induced budding in lipid bilayer membranes has been reported in many experimental studies of biological and biomimetic systems Ford et al. (2002); Antonny (2006); Römer et al. (2007); McMahon and Gallop (2005); Tsafrir et al. (2003). Computer simulations allow to study the membrane-mediated interaction between the inclusions in detail without the presence of other, direct interactions. Recently, bud formation by curved inclusions has been investigated with computer simulations Reynwar et al. (2007); Atilgan and Sun (2004). It was found that the inclusions on the buds have a higher density than they had in the initially nearly flat membrane Reynwar et al. (2007). This might appear to be a result of undulation-induced attraction that in consequence leads to clustering of the inclusions and to budding.
Such systems and processes can be studied theoretically on the basis of an elastic membrane that is characterized by its bending rigidity, , and Gaussian saddle splay modulus, , with curved inclusions that consist of sections of a sphere with a given opening angle. We demonstrate that bud formation can already be well understood on the basis of the membrane deformation alone. We show that the higher inclusion density on the bud is a result of a screened repulsive interaction. We further argue that the budding pathway plays an important role for bud size. This allows us to predict a range of possible bud radii for a given system, which nicely agrees with recent simulation results Reynwar et al. (2007).
At finite temperature, the inclusions can exist in a fluid and in a crystalline phase, which depends on the strength of their repulsive interaction. We construct an approximate free-energy functional that takes into account for the bending energy as well as the translational entropy of the inclusions. We calculate a phase diagram for the fission of a single vesicle of given size and for given number and geometry of the inclusions. The inclusion entropy plays a decisive role for the sizes of the smaller vesicles into which a larger vesicle may split.
II Membrane bending energy
II.1 Membrane shape near inclusions in a lipid bilayer
The bending energy of a lipid bilayer is given by the integral over the entire membrane area,
| (1) |
where is the bending rigidity, is the saddle-splay modulus, is the mean curvature, is the Gaussian curvature, and and are the principal curvatures at each point of the membrane. The integral over the Gaussian curvature is determined by the topology of the membrane and by the geodesic curvature at the boundary. In our case, the geodesic curvature is given by the geometry of the inclusions, so that in general this term of the integral over the membrane shape does not need to be calculated explicitly. For bud formation, we neglect the constant contribution of the Gaussian saddle splay modulus.
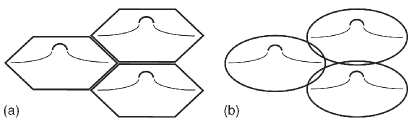
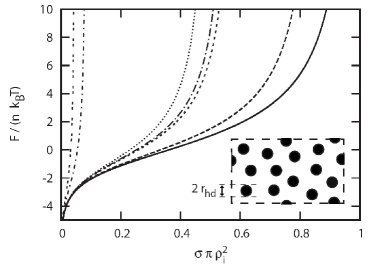
In order to minimize the bending energy, the inclusions preferably order on a hexagonal lattice (Fig. 1 (a)); therefore it is a natural assumption that the symmetry axis is oriented normal to the local tangent plane of the vesicle on which the inclusions are placed. To calculate the deformation energy, we approximate the hexagons with overlapping circles that have the same projected area (Fig. 1 (b)).
If there are no overhangs, the membrane conformation can be described in Monge parametrization by a height field, , over a planar reference surface. For an almost planar membrane, the bending energy of the membrane is
| (2) |
with the integral over the reference plane. Minimization of the bending energy gives the biharmonic Euler-Lagrange equation,
| (3) |
In cylindrical coordinates, the general solution of Eq. (3) is
| (4) |
with the four integration constants to foo (a).
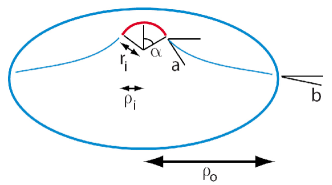
The boundary conditions that are imposed on the membrane are sketched in Fig. 2. The radius of the inner boundary, , and the slope of the membrane at the inner boundary, , are determined by the inclusion geometry. For inclusions on a vesicle with radius and surface number density of the inclusions, the radius of the outer boundary is with ; the slope of the membrane at the outer boundary is . For inclusions on a planar membrane, the latter expressions simplify to and . The remaining two boundary conditions are given by fixing the membrane height at the inner (or equivalently at the outer) boundary and minimizing the energy with respect to the height of the inclusion above the vesicle (i. e. the height difference between both boundaries), which implies at the inclusion and at the outer boundary.
Eq. (4) together with the boundary conditions gives the shape of the deformation,
| (5) |
and the corresponding bending-energy cost,
| (6) |
The energy a function of and , which depend on the inclusion density, while all other quantities are intrinsic properties of membrane and inclusions. For a single inclusion in an infinite planar membrane, and , the bending energy vanishes and the membrane deformation is catenoid-like, . Note that in a pairwise approximation, the interaction energy for two inclusions in a planar membrane () decays like for large distances between the inclusions (large ).
II.2 Optimal, low, and high inclusion density
For inclusions on a vesicle, the membrane shape and the minimal bending energy (assuming that the inclusions have maximal mutual distances) can be calculated using Eqs. (5) and (6). For , the membrane around the inclusion has almost catenoid shape foo (b); the catenoid is a minimal surface without bending-energy cost. If the entire vesicle is covered with inclusions and catenoids such that the bending energy is zero (Fig. 3 (b)), the inclusions have optimal density.
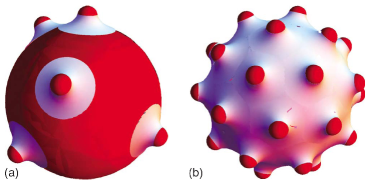
For lower inclusion densities, in a first approximation the catenoid shape borders on a spherical shape with the curvature radius of the vesicle. The bending energy of a vesicle that is decorated with curved inclusions is reduced by the fraction of the sphere’s surface area that is covered by the inclusions and the catenoid-shaped membrane segments, see Fig. 3. Therefore for low inclusion density, the bending energy of the decorated spherical vesicle is in the range . In the full solution, which is given by Eq. (5) and will be used in the remainder of the paper, there is no jump in the mean curvature from to between the catenoid and a sphere as sketched in Fig. 3 but rather a smooth transition from zero to finite mean curvature.
For inclusion densities that are higher than the optimal density, due to the boundary conditions no solution can be constructed by matching of catenoids. In this case, the bending energy always has a finite value that can exceed the bending energy of a bare vesicle.
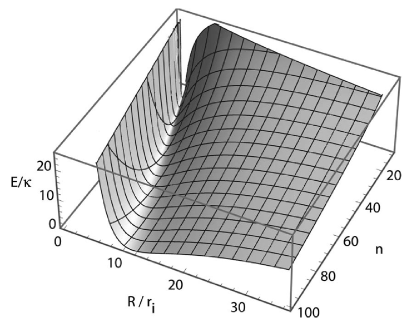
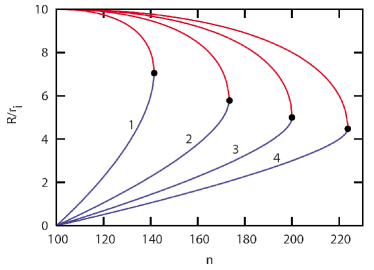
The minimal bending energy of a vesicle with inclusions is shown in Fig. 4 as function of the number of inclusions, , and the vesicle radius, . We find degenerate zero-energy ground states that have optimal inclusion density with an approximately linear dependence , where foo (c)
| (7) | |||||
The natural spontaneous curvature of the bilayer for given inclusion density and geometry is .
The same value for the inclusion density can be high, optimal, or low, depending on the radius of the vesicle on which the inclusions are placed. The smaller the radius of the vesicle, the larger the value of the optimal density. In a planar membrane, the slopes of two adjacent catenoid-like deformations cannot be matched for any finite distance between the inclusions. Therefore the inclusions are always in the high-density regime in this case.
II.3 Budding and vesiculation
Bud formation does not occur for a vesicle with low inclusion density and bending energy, , because this would lead to an increase of the total bending energy foo (d). However, for high inclusion density (, see Eq. (7)), the system can always reach a state of lower bending energy if small vesicles bud from the main vesicle. The set of smaller vesicles into which a large vesicle with high inclusion density splits up is not uniquely determined from bending energy alone, because the states of vanishing bending energy are degenerate. A natural assumption is that the vesicle will split into one large ’mother’ vesicle and one or more small ’daughter’ vesicle(s) of equal size, such that the total bending energy vanishes and the membrane area is kept constant. In Fig. 5, we show the radii of the mother and daughter vesicles as function of the number of inclusions. For a given number of daughter vesicles, there is a maximal number of inclusions () that still allows to obtain a zero energy state, for which mother and daughter vesicles have equal sizes.
If the system can split up into smaller vesicles, it can also split up into a larger number of small vesicles foo (e). For a vesicle with total number of inclusions and radius , bending energy minimization predicts for the radii and inclusion number on mother (, ) and daughter (, ) vesicles:
| (8) | |||||
Because of the degeneracy of the states with vanishing bending energy, thermal fluctuations and the budding pathway play a decisive role to determine how a large vesicle with high inclusion density splits up into smaller vesicles. Note that the results of our analytical model so far do not depend on the value of the bending rigidity of the bilayer.
II.4 Inclusion clusters
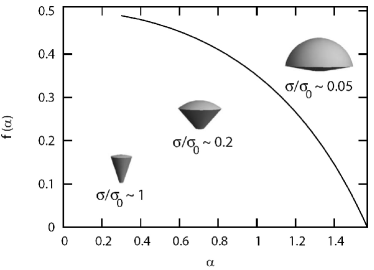
A direct attractive interaction between inclusions can induce cluster formation Sieber et al. (2007). In this case, the preferred curvature radius, , not only depends on the number and geometry of the inclusions, but also on cluster size. For given inclusion curvature radius , opening angle , and fixed density , inclusion clusters with a larger opening angle and reduced density, , have a stronger effect on the curvature of the membrane than homogeneously distributed inclusions. The preferred curvature radius for clusters with opening angle is . We call the normalized curvature radius the coagulation factor, because it multiplies the curvature radius for the reference inclusion density and opening angle foo (f, g), see Fig. 6.
For a fixed number of inclusions, the preferred curvature radius decreases when aggregates are formed, i. e. the efficiency with which the inclusions influence the membrane curvature increases. Cluster formation therefore also shifts the high-density regime to smaller numbers of inclusions for the same vesicle radius, , and may cause a large vesicle to break up into smaller vesicles.
III Thermal fluctuations
For finite temperature, the translational entropy of the inclusions contributes to the free energy. We distinguish a crystalline hexagonal phase and a disordered fluid phase for which we construct free energy functionals. Phase diagrams have been calculated more rigorously in Ref. Netz and Pincus (1995) in the limiting case of an almost planar membrane and for inclusions that are slightly stiffer than the membrane and weakly curved — but not in the context of budding.
We neglect the interaction between inclusions by thermal membrane undulations. For a pair of inclusions and an arbitrary orientation of the inclusion axis, to lowest order of the deformation energy is Weikl et al. (1998); Fournier and Dommersnes (1997); Goulian et al. (1993a, b)
| (9) |
and the undulation-induced interaction energy Weikl (2002); Golestanian et al. (1996a, b); Goulian et al. (1993a)
| (10) |
The ratio of the membrane deformation-induced repulsion to the undulation-induced attration in a planar membrane is . The undulation-induced attraction can be neglected if it is one order of magnitude smaller than the deformation interaction; for this is the case for , for already for . For low inclusion densities, the undulation-induced interaction energy decays with the square of the density while the free energy due to the inclusion entropy is of the order of ; in case of the phase diagrams in Fig. 11, the undulation free energy is about .
III.1 Inclusion effective pair potential and effective hard-disc radius
For inclusions on a hexagonal lattice, each inclusion corresponds to three pair interactions and a radius of the deformation patch, , that is half the distance between the inclusions. The effective pair potential, obtained from Eq. (6), is thus
| (11) |
For inclusions on a planar membrane () and for large , i. e. for , the repulsive interaction potential decays with a power law, .
To determine the free energy of this system, we employ the method developed for suspensions of repulsive colloids Barker and Henderson (1967), i. e. we mimic the interaction potential by hard discs with an effective radius, . The radius is calculated from a comparison of the membrane deformation energy with the thermal energy, . We use a modified Barker-Henderson method that is appropriate for soft potentials Barker and Henderson (1967); foo (g),
| (12) |
where the upper integral boundary is determined by Henderson and Barker (1970); Watts and Henderson (1969). The effective hard-disc radii therefore depend on the geometry of the inclusion, the bending rigidity of the membrane, and on the radius of the vesicle on which the inclusions are placed.
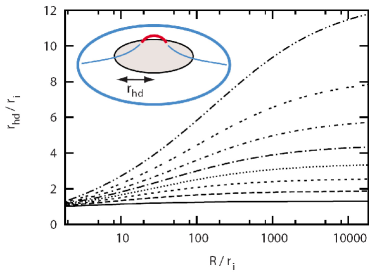
In Fig. 7, the effective hard-disc radii, , are plotted for inclusions with various opening angles as function of the vesicle radius, (an extremely large radius of the vesicle is used to describe inclusions in planar membranes). The hard disc radii increase with increasing vesicle radius; the increase of with is the stronger, the larger the opening angle of the inclusion is. For example, the inclusions with and can approach each other by diffusion about an order of magnitude closer on a vesicle with radius than this is possible on a planar membrane. Consequently, the translational entropy of the inclusions lowers the free energy on the vesicle compared with the planar membrane.
As discussed in Sec. II.4, cluster formation of inclusions increases their effect on the membrane curvature. The effect of cluster formation on the area fraction of effective hard discs is plotted in Fig. 8. For , which is a typical value for a lipid bilayer, clustering on vesicles with large radii, , strongly increases the area fraction of the effective hard discs. To illustrate the strong effect of the bending rigidity on the effective hard-disc radius, which enters the calculation of the radius via the exponential function in Eq. (12), we plot the effective hard disc radii for ; the increase of the area fraction of the hard discs with is much smaller than for . Thus the translational entropy of the inclusions plays a much more important role for smaller foo (h).
III.2 Inclusion entropy and free energy of hard discs
The free energy of a fluid of hard discs can be very well described by the Carnahan-Starling free energy Carnahan and Starling (1969); Maeso and Solana (1993). It is the sum of the ideal-gas free energy, , where is the thermal wavelength (see e. g. Ref. Gögelein et al. (2008)), and the excess free energy Hansen and McDonald (2006). The latter is calculated from the Carnahan-Starling equation of state Maeso and Solana (1993),
| (13) |
with the hard-disc area fraction, . Integration of the thermodynamic relation finally gives the excess free energy,
| (14) |
The Carnahan-Starling excess free energy diverges at the crystallization transition of the effective hard discs.
Because in the fluid as well as in the crystalline phase of the inclusions the squared thermal wavelength enters through the same constant and additive term, we consistently replace it in both cases — without loss of information — by the projected area of the inclusion, , such that .
Usually the translational entropy favors a homogeneous distribution of particles. However, because the effective hard-disc radius depends on the membrane curvature, on a deformable membrane, a homogeneous distribution of inclusion does not need to be the most favourable state. Instead, the inclusion density on the bud can be higher than on the mother vesicle because of the screened repulsive interactions. Fig. 9 shows the free energies of a fluid of effective hard discs with curvature radius for various opening angles in a lipid bilayer with . For nearly identical curvature radii of vesicle and inclusions, the effective hard-disc radius almost coincides with the geometric hard-disc radius of the inclusion.
III.3 Free energy per inclusion in fluid and crystalline phases
We construct the free energy per inclusion in the crystalline phase from the membrane bending energy and the fluctuation free energy of a harmonic crystal, and in the fluid phase from the sum of the membrane bending energy and the translational entropy of the inclusions foo (i).
For the harmonic crystal, the spring constant is obtained for a hexagonal lattice with the interaction potential in Eq. 11,
| (15) |
The free energy contribution of the positional fluctuations of the inclusions is therefore
| (16) |
or — after replacement of the thermal wavelength by the inclusion size —
| (17) |
Whenever we use the free energy for the crystalline phase in this paper, the Lindemann parameter remains below the critical value for melting of the inclusion crystal Eisenmann et al. (2004).
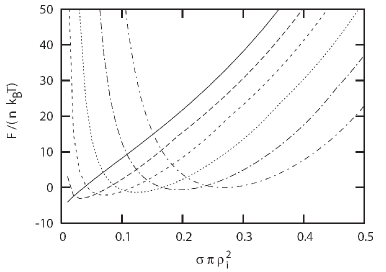
The transition between the fluid and the crystalline phase already occurs below the crystallization transition of the effective hard discs, . In Fig. 10, the free energy per inclusion is plotted for several vesicle radii. Entropy reduces the optimal bud radius for a given inclusion density compared with Eq. (7). However, the bending energy alone still provides a good estimate for the optimal bud radius, because of the strong increase of the free energy per inclusion for low inclusion densities (see Fig. 10).
III.4 Vesiculation diagrams
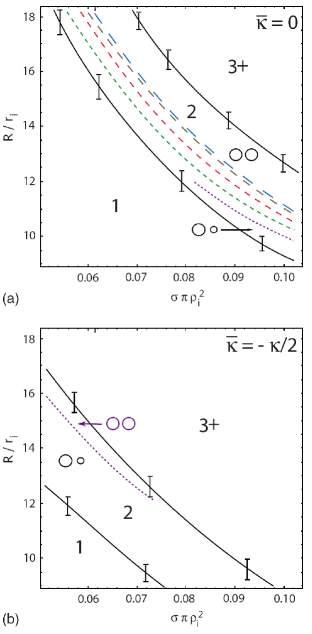
From the total free energy in Sec. III.3, we calculate vesiculation diagrams starting with a single vesicle of radius and a given number of inclusions for several values of . Because the topology changes when buds detach, the value of plays an important role for vesiculation. Fig. 11 shows vesiculation diagrams for and for (the ratio is still under debate, see Ref. Deserno (2009)). We calculate whether the single vesicle is the most stable state or if fission in two or more smaller vesicles is favorable. With increasing initial vesicle radius and inclusion density, fission becomes more likely to occur — first into two, at even larger or into three or more vesicles.
For , fission in the bending-energy dominated regime produces two smaller vesicles that in general have different sizes, see Eq. (8). If entropy is important, the two vesicles may have equal size. In Fig. 11 (a), it is shown that a regime of equally-sized vesicles develops, bordering the three-vesicle regime and increasing in size with decreasing . Within the error bars of our calculation, we find that the boundaries between one, two, and three vesicles are independent of the value of the bending rigidity for .
For , vesiculation takes place for smaller initial vesicle radii and inclusion densities than for , because each additional vesicle lowers the free energy by . In the entire two vesicle regime, both vesicles have different sizes for , , , and , while for a small region of equally sized vesicles is found, see Fig. 11 (b).
Note that for bud formation, which has to occur before vesiculation, the value of is irrelevant and the phase diagrams for apply (assuming that the buds are connected by catenoidal necks with vanishing bending energy, and that the membrane area needed to form the neck is negligible). While the bud is being formed and has not yet detached, the integral over the Gaussian curvature and therefore the contribution of the saddle splay modulus to the deformation energy stays constant. However, a negative saddle splay modulus facilitates the neck between two vesicles to break. In this case, the budded state can act as energy barrier for vesiculation that prevents fission, separating a high-energy single-vesicle state and a low-energy state of several smaller vesicles.
IV Budding pathway
To shed more light on the role of the budding pathway, we compare the typical diffusion time of the inclusions with the relaxation time of the membrane conformation on the same length scale. If the diffusion of inclusions is fast compared with the relaxation time of the membrane, the initial membrane shape is decisive; for a fast membrane relaxation, the initial distribution of inclusions mainly determines the budding process.
The diffusion time is where is a characteristic length scale that the inclusion has diffused and is the diffusion coefficient of the inclusion. A typical value is for the diffusion of lipids and the diffusion coefficient for proteins in cell membranes can be up to two orders of magnitude smaller Henis (1993). The relaxation time of the membrane is Gov et al. (2003), where is the viscosity of the surrounding water and is the wavelength of the membrane undulations. From the cubic versus the quadratic dependence on , we find that for small , , while for large , .
For and (which is an upper bound for the diffusion coefficient of proteins), we find that for . This length is much larger than , which is the size of cells Alberts et al. (2002) or giant unilamellar vesicles Pecreaux et al. (2004), thus the initial aggregation of inclusions is diffusion-limited. We therefore assume that inhomogeneities in the protein distribution on the membrane will immediately lead to a membrane deformation that minimizes the bending energy. The larger the initial inclusion density, the larger the spontaneous curvature of the membrane (compare Eq. (7)) and the smaller the size of the buds that are formed.
Bud formation is initialized in some regions of the membrane that have a noticeably higher inclusion density than others. The relative protein density fluctuations decrease with the size of a membrane patch which is considered. If we assume a random distribution of inclusions, for a patch with inclusions the relative fluctuations of the inclusion number are of the order of . Thus for small patches, the inhomogeneities are strongest and budding will preferably occur on the smallest possible lengthscale. A small average membrane curvature with appropriate sign further attracts proteins to those regions where the bending energy per inclusion is already reduced. However, this clustering of inclusions during the budding process is hindered by a ring with opposite membrane curvature that forms the neck of a growing bud. This ring acts as energetic barrier that prevents further inclusions to enter a patch of the membrane where budding has already started foo (j). Because of the neck formation and the diffusion-limited budding process, the bud size is roughly determined by the initial inclusion density on the membrane.
V Comparison with simulation results
Budding due to membrane inclusions has been studied recently with computer simulations Reynwar et al. (2007); Atilgan and Sun (2004). In Ref. Atilgan and Sun (2004), entire vesicles with inclusions are simulated where the membrane is modelled as a dynamically triangulated surface. In Ref. Reynwar et al. (2007), coarse-grained model lipids are used to study budding for planar bilayer patches.
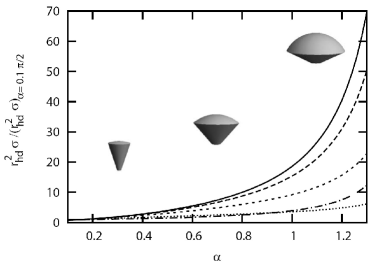
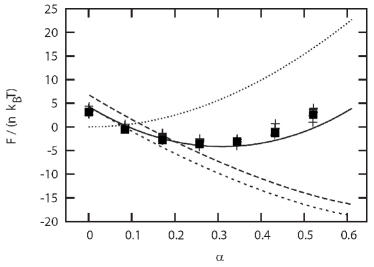
In Fig. 12, the different contributions to the free energy per inclusion needed to graft inclusions with given projected radius on a vesicle with radius are plotted as function of the opening angle, . The inclusions are in the fluid phase. For comparison, we also plot the simulation data of Ref. Atilgan and Sun (2004), shifted by because our model does not account for thermal undulations of the membrane conformation. This energy difference is extracted from the simulation data for and for , see Fig. 6A in Ref. Atilgan and Sun (2004). However, the very good match is somewhat fortuituous because we replace the thermal wavelength in the ideal gas free energy by the inclusion size, such that it is similar to the free energy obtained on a triangulated vesicle with a bond length that approximately equals to the inclusion diameter, compare Smith and Seifert (2005).
We consider curvature radii of the inclusions that are both smaller and larger than the curvature radius of the vesicle. For and , such that , bending energy is needed to insert the flat inclusion into the curved vesicle. This bending energy cost decreases with increased opening angle and is zero for where the curvature radius of the inclusion equals the curvature radius of the vesicle. If is further increased, the bending energy per inclusion continues to decrease as more and more of the vesicle area consists of catenoidal patches around the inclusions. For , i. e. for even larger opening angles than plotted in the figure, the inclusions have optimal density and the bending energy gained by grafting all inclusions to the vesicle is .
In addition to the bending energy, there is an energy cost for grafting that arises due to the saddle-splay modulus, which has been chosen to be for consistency with Ref. Atilgan and Sun (2004). The energy cost per inclusion only depends on the geodesic curvature of the membrane at the inclusion, i. e. on the opening angle , which implies . Therefore it is independent of vesicle radius and inclusion density and is only important to calculate the chemical potential for the inclusions on the surface; the budding transition at given inclusion density in the membrane is independent of .
In the simulations presented in Ref. Reynwar et al. (2007), budding is induced by inclusions with that are initially placed in a regular array on a planar membrane with . Under the assumption that the initial inclusion density, , determines the bud size (see Sec. IV), we can roughly predict the bud radius from Eq. (7). Possible bud radii are estimated by comparing the free energies for different vesicle radii in Fig. 10 at the initial inclusion density.
The parameters for which the free energies are plotted in Fig. 10 are chosen to match the bending rigidity and the inclusion geometry of the ’large inclusions’ in Ref. Reynwar et al. (2007) with foo (k). For an initial inclusion density in the planar membrane, , which is estimated by visual inspection from the simulation snapshots, we find that the inclusions are in the crystalline phase on the vesicle with (i. e. in a planar membrane). The free energy per inclusion is about . Significantly smaller free energies per inclusion can be found for vesicle radii ; the optimal vesicle radii are with free energies per inclusion of about . These radii agree well with the observed bud radius of that formes in the simulations as final state via an initially slightly larger bud. The optimal bud radius from Eq. (7) is approximately .
Similarly, for the ’very large inclusions’ in Ref. Reynwar et al. (2007) () we predict bud radii, , as observed in the simulations; based on bending energy only we find from Eq. (7) . For the ’small inclusions’ in Ref. Reynwar et al. (2007) () that are already in the planar membrane almost in the fluid phase, our model predicts for the inclusions studied in the simulations a maximal gain for the free energy per inclusion of for and a strong decrease of this energy gain for smaller vesicle radii. Already for and inclusions, the energy per inclusion on the bud and in the plane are approximately equal. Larger energy gains are possible for larger bud radii, for which many more than the simulated 36 inclusions and a larger area of the bilayer patch are needed. From these considerations, it is not surprising that no budding is observed for the ’small inclusions’ in the simulations of Ref. Reynwar et al. (2007).
VI Conclusions
We have calculated the membrane-mediated interaction of conical inclusions in a lipid bilayer and the inclusion entropy, which allow the prediction of budding transitions and vesiculation. Our model is based on the membrane bending energy; with this contribution alone, the spontaneous curvature of a bilayer with inclusions as well as budding can be predicted for many systems, ranging from protein inclusions to viral budding. Although the interaction between the inclusions by membrane deformation is repulsive, the screening of the repulsive interaction due to the average membrane curvature allows higher inclusion densities on a bud than in the initial vesicle. Translational entropy of the inclusions favors the formation of equally-sized daughter vesicles and lifts the degeneracy that is found for states with vanishing bending energy.
From our calculations, the following picture of the effect of the bilayer deformation by curved inclusions emerges. For low inclusion density, the membrane around each inclusion assumes a catenoid shape of vanishing curvature energy. At optimal inclusion density, the catenoids are closely packed and the bending energy for the entire vesicle vanishes. For high inclusion density, the boundary conditions for the membrane deformation around the inclusion do not allow the formation of catenoidal patches, and the inclusions always feel the membrane-mediated repulsive interaction with neighboring inclusions. In this regime, bud formation can occur.
If we assume a specific biological mechanism that leads to formation of clusters with well-defined and limited size, we find that such a mechanism can induce bud formation and vesiculation without the need to insert additional conical proteins into the cell membrane: cluster formation reduces the preferred curvature radius of the membrane. We quantify the effect of aggregation by the coagulation factor, which describes how the preferred curvature radius for a fixed amount of inclusions changes with the cluster size.
In general, our analytical model is applicable for a wide range of length scales and inclusion geometries. Computer simulations are usually designed only for a specific length scale, e. g. a length scale comparable to the length scale of lipids in Ref. Reynwar et al. (2007) or the lengthscale of entire vesicles in Ref. Atilgan and Sun (2004). The good agreement with the simulation results of Refs. Reynwar et al. (2007); Atilgan and Sun (2004) suggests that the approximations used in our calculations are justified.
We argue that the undulation-induced attraction can be neglected compared with the deformation-induced repulsion and the translational entropy of the inclusions for , i. e. for . For example, the BAR protein induces a local membrane curvature with an opening angle Blood and Voth (2006). Clathrin can induce a variety of opening angles Kohyama, Kroll, and Gompper (2003); Heuser and Evans (1980).
The number of the inclusions per bud is determined by the budding process. Around a growing bud, a neck forms that presents an energetic barrier for the diffusion of inclusions. Because the deformation of the lipid membrane typically occurs much faster than the diffusion of the inclusions within the membrane, the number of inclusions per bud is well determined by the initial inclusion density in the membrane. From this, we can estimate a range of possible bud radii, which agrees well with the simulations in Ref. Reynwar et al. (2007).
It would be interesting to test the validity of our model in the limits of (a) very small inclusions, such as lipids with large headgroups, when the description of the lipid membrane by curvature elastic constants may not be appropriate and (b) very floppy membranes, when neglecting the thermal membrane undulations may not be justified.
Acknowledgements.
We acknowledge helpful discussions with G. Nägele, R. G. Winkler, J. L. McWhirter, K. Mecke, R. Golestanian, M. Deserno, and M. Oettel.References
- Dupuy and Engelman (2008) A. D. Dupuy and D. M. Engelman, Proc. Nat. Acad. Sci. 105, 2848 (2008).
- Sens et al. (2008) P. Sens, L. Johannes, and P. Bassereau, Curr. Opin. Cell Biol. 20, 1 (2008).
- Drin et al. (2007) G. Drin, J. F. Casella, R. Gautier, T. Boehmer, T. U. Schwartz, and B. Antonny, Nat. Struct. Mol. Biol. 14, 138 (2007).
- Blood and Voth (2006) P. D. Blood and G. A. Voth, Proc. Nat. Acad. Sci. 103, 15068 (2006).
- Auth and Gompper (2005) T. Auth and G. Gompper, Phys. Rev. E 72, 031904 (2005).
- Bickel and Marques (2002) T. Bickel and C. M. Marques, Eur. Phys. J. E 9, 349 (2002).
- Ford et al. (2002) M. G. J. Ford, I. G. Mills, B. J. Peter, Y. Vallis, G. J. K. Praefcke, P. R. Evans, and H. T. McMahon, Nature 419, 361 (2002).
- Harden and Mackintosh (1994) J. L. Harden and F. C. Mackintosh, Europhys. Lett. 28, 495 (1994).
- Hagerstrand et al. (2006) H. Hagerstrand, L. Mrowczynska, U. Salzer, R. Prohaska, K. A. Michelsen, V. Kralj-Iglic, and A. Iglic, Mol. Mem. Biol. 23, 277 (2006).
- Kozlov (2007) M. M. Kozlov, Nature 447, 387 (2007).
- Antonny (2006) B. Antonny, Curr. Opin. Cell Biol. 18, 386 (2006).
- Shlomovitz and Gov (2007) R. Shlomovitz and N. S. Gov, Phys. Rev. Lett. 98, 168103 (2007).
- Römer et al. (2007) W. Römer, L. Berland, V. Chambon, K. Gaus, B. Windschiegl, D. Tenza, M. R. E. Aly, V. Fraisier, J.-C. Florent, D. Perrais, et al., Nature 450, 670 (2007).
- McMahon and Gallop (2005) H. T. McMahon and J. L. Gallop, Nature 438, 590 (2005).
- Gao et al. (2005) H. J. Gao, W. D. Shi, and L. B. Freund, Proc. Nat. Acad. Sci. 102, 9469 (2005).
- Góźdź (2007) W. T. Góźdź, Langmuir 23, 5665 (2007).
- Auth and Gompper (2003) T. Auth and G. Gompper, Phys. Rev. E 68, 051801 (2003).
- Tsafrir et al. (2003) I. Tsafrir, Y. Caspi, M. A. Guedeau-Boudeville, T. Arzi, and J. Stavans, Phys. Rev. Lett. 91, 138102 (2003).
- Campelo et al. (2007) F. Campelo, J. M. Allain, and M. Ben Amar, Europhys. Lett. 77, 38006 (2007).
- Baumgart et al. (2003) T. Baumgart, S. T. Hess, and W. W. Webb, Nature 425, 821 (2003).
- Haluska et al. (2002) C. K. Haluska, W. T. Gozdz, H. G. Döbereiner, S. Forster, and G. Gompper, Phys. Rev. Lett. 89, 238302 (2002).
- Góźdź and Gompper (2001) W. T. Góźdź and G. Gompper, Europhys. Lett. 55, 587 (2001).
- Bruinsma and Pincus (1996) R. Bruinsma and P. Pincus, Curr. Opin. Solid State Mater. Sci. 1, 401 (1996).
- Goulian (1996) M. Goulian, Curr. Opin. Colloid Interface Sci. 1, 358 (1996).
- Goulian et al. (1993a) M. Goulian, R. Bruinsma, and P. Pincus, Europhys. Lett. 22, 145 (1993a).
- Goulian et al. (1993b) M. Goulian, R. Bruinsma, and P. Pincus, Europhys. Lett. 23, 155 (1993b).
- Weikl et al. (1998) T. R. Weikl, M. M. Kozlov, and W. Helfrich, Phys. Rev. E 57, 6988 (1998).
- Chou et al. (2001) T. Chou, K. S. Kim, and G. Oster, Biophys. J. 80, 1075 (2001).
- Kim et al. (1998) K. S. Kim, J. Neu, and G. Oster, Biophys. J. 75, 2274 (1998).
- Dommersnes et al. (1998) P. G. Dommersnes, J. B. Fournier, and P. Galatola, Europhys. Lett. 42, 233 (1998).
- Kim et al. (1999) K. S. Kim, J. C. Neu, and G. F. Oster, Europhys. Lett. 48, 99 (1999).
- Helfrich and Weikl (2001) W. Helfrich and T. R. Weikl, Eur. Phys. J. E 5, 423 (2001).
- Weikl (2001) T. R. Weikl, Europhys. Lett. 54, 547 (2001).
- Golestanian et al. (1996a) R. Golestanian, M. Goulian, and M. Kardar, Phys. Rev. E 54, 6725 (1996a).
- Golestanian et al. (1996b) R. Golestanian, M. Goulian, and M. Kardar, Europhys. Lett. 33, 241 (1996b).
- Reynwar et al. (2007) B. J. Reynwar, G. Illya, V. A. Harmandaris, M. M. Müller, K. Kremer, and M. Deserno, Nature 447, 461 (2007).
- Atilgan and Sun (2004) E. Atilgan and S. X. Sun, J. Chem. Phys. 121, 10392 (2004).
- foo (a) In general, the boundary conditions are given by and for the inner and the outer boundaries each or alternatively — if the values of and are not known at the boundary — by the natural boundary conditions and , respectively Dan et al. (1994).
- Dan et al. (1994) N. Dan, A. Berman, P. Pincus, and S. A. Safran, J. Phys. (France) II 4, 1713 (1994).
- foo (b) Part of a small sphere (the inclusion) is matched to the narrow part of the catenoid such that the slope is continuous, which again is matched to a larger sphere (the vesicle), see Fig. 3.
- foo (c) The equations are applicable for large , but also in the exact relations the inclusion geometry enters only as a single variable, .
- foo (d) Budding in this regime of inclusion concentration might be possible for a negative value of .
- foo (e) Eq. (7) is valid for large ; for very small vesicles the approximation breaks down and in addition discretization effects become important.
- Sieber et al. (2007) J. J. Sieber, K. I. Willing, C. Kutzner, C. Gerding-Reimers, B. Harke, G. Donnert, B. Rammner, C. Eggeling, S. W. Hell, H. Grubmueller, and T. Lang, Science 317, 1072 (2007).
- foo (f) We neglect the contribution of the geodesic curvature, the influence of which is characterized by .
- foo (g) In the original method that applies to steep potentials, is used.
- Netz and Pincus (1995) R. R. Netz and P. Pincus, Phys. Rev. E 52, 4114 (1995).
- Fournier and Dommersnes (1997) J. B. Fournier and P. G. Dommersnes, Europhysics Letters 39, 681 (1997).
- Weikl (2002) T. R. Weikl, Phys. Rev. E 66, 061915 (2002).
- Barker and Henderson (1967) J. A. Barker and D. Henderson, J. Chem. Phys. 47, 2856 (1967).
- Henderson and Barker (1970) D. Henderson and J. A. Barker, Phys. Rev. A 1, 1266 (1970).
- Watts and Henderson (1969) R. O. Watts and D. Henderson, J. Chem. Phys. 50, 1651 (1969).
- foo (h) It is not clear whether for the thermal undulations of the membrane can still be neglected, i. e. whether our model applies.
- Carnahan and Starling (1969) N. F. Carnahan and K. E. Starling, J. Chem. Phys. 51, 635 (1969).
- Maeso and Solana (1993) M. J. Maeso and J. R. Solana, J. Chem. Phys. 99, 548 (1993).
- Gögelein et al. (2008) C. Gögelein, G. Nägele, R. Tuinier, T. Gibaud, A. Stradner, and P. Schurtenberger, J. Chem. Phys. 129, 085102 (2008).
- Hansen and McDonald (2006) J.-P. Hansen and I. R. McDonald, Theory of Simple Liquids (Academic Press, London, 2006), 3rd ed.
- foo (i) The cell approximation Döge et al. (2004) for the free energy of the crystalline phase is not useful, because the effective hard discs overlap already at densities that are slightly higher than the crystallization transition of the inclusions and below densities that are observed in simulations.
- Döge et al. (2004) G. Döge, K. Mecke, J. Moller, D. Stoyan, and R. P. Waagepetersen, Int. J. Mod. Phys. C 15, 129 (2004).
- Eisenmann et al. (2004) C. Eisenmann, P. Keim, U. Gasser, and G. Maret, J. Phys.: Condens. Matter 16, S4095 (2004).
- Deserno (2009) M. Deserno, Macromol. Rapid Commun. 30, 752 (2009).
- Henis (1993) Y. I. Henis, in Biomembranes: physical aspects, edited by M. Shinitzky (VCH, Weinheim, 1993), pp. 279–339.
- Gov et al. (2003) N. Gov, A. G. Zilman, and S. Safran, Phys. Rev. Lett. 90, 228101 (2003).
- Alberts et al. (2002) B. Alberts, D. Bray, and J. Lewis, Molecular Biology of the Cell (Garland Science, New York, 2002), 4th ed.
- Pecreaux et al. (2004) J. Pecreaux, H. G. Döbereiner, J. Prost, J. F. Joanny, and P. Bassereau, Eur. Phys. J. E 13, 277 (2004).
- foo (j) By this mechanism, the final number of inclusions per bud is already determined in an early stage of bud formation. The area of lipid bilayer per bud can adjust during the budding process and is regulated by the number of inclusions on the bud.
- Smith and Seifert (2005) A.-S. Smith and U. Seifert, Phys. Rev. E 71, 061902 (2005).
- foo (k) Many numerical values of the parameters in the figures have been chosen such that they correspond to those in Ref. Reynwar et al. (2007).
- Kohyama, Kroll, and Gompper (2003) T. Kohyama, D. M. Kroll, and G. Gompper, Phys. Rev. E 68, 061905 (2003).
- Heuser and Evans (1980) J. Heuser and L. Evans, J. Cell Biol. 84, 560 (1980).