X-Ray Emitting GHz-Peaked-Spectrum Galaxies:
Testing a Dynamical-Radiative Model with Broad-Band Spectra
Abstract
In a dynamical-radiative model we recently developed to describe the physics of compact, GHz-Peaked-Spectrum (GPS) sources, the relativistic jets propagate across the inner, kpc-sized region of the host galaxy, while the electron population of the expanding lobes evolves and emits synchrotron and inverse-Compton (IC) radiation. Interstellar-medium gas clouds engulfed by the expanding lobes, and photoionized by the active nucleus, are responsible for the radio spectral turnover through free-free absorption (FFA) of the synchrotron photons. The model provides a description of the evolution of the spectral energy distribution (SED) of GPS sources with their expansion, predicting significant and complex high-energy emission, from the X-ray to the -ray frequency domain. Here, we test this model with the broad-band SEDs of a sample of eleven X-ray emitting GPS galaxies with Compact-Symmetric-Object (CSO) morphology, and show that: (i) the shape of the radio continuum at frequencies lower than the spectral turnover is indeed well accounted for by the FFA mechanism; (ii) the observed X-ray spectra can be interpreted as non-thermal radiation produced via IC scattering of the local radiation fields off the lobe particles, providing a viable alternative to the thermal, accretion-disk dominated scenario. We also show that the relation between the hydrogen column densities derived from the X-ray () and radio () data of the sources is suggestive of a positive correlation, which, if confirmed by future observations, would provide further support to our scenario of high-energy emitting lobes.
Subject headings:
galaxies: active – galaxies: individual (IERS B0026+346, IERS B0108+388, IERS B0500+019, IERS B0710+439, PKS B0941-080, IERS B1031+567, IERS B1345+125, IVS B1358+624, IERS B1404+286, IERS B2128+048, IERS B2352+495) – – galaxies: jets – X-rays: galaxies – radiation mechanisms: nonthermal1. INTRODUCTION
The power released by active galactic nuclei (AGNs) is currently interpreted in terms of conversion of gravitational energy to radiative energy by accretion processes feeding the central supermassive black hole (BH) with environmental gas. The triggering, maintenance, and fading of the AGN activity, as well as the link of these processes with the physical conditions of the environment, from sub- to super-galactic scales, are still widely debated issues, and keep on stimulating a large variety of scientific investigations. In this context, radio galaxies are ideal laboratories, because they offer an edge-on view of both their nuclei and their relativistic jets, launched from the galactic center and reaching up to Mpc distances. The variety of powers, sizes, and morphologies displayed by radio galaxies not only provides pieces of evidence of different environmental physical conditions, but also samples subsequent stages of the source evolution. In particular, key sources for the investigation of the very first phases of the evolution of radio galaxies are the Gigahertz-Peaked-Spectrum (GPS) sources associated with galaxies and characterized by a Compact Symmetric Object (CSO) radio morphology.
GPS sources (see O’Dea, 1998, for a review) are a class of powerful radio sources ( W Hz-1) displaying convex radio spectra that turn over at frequencies of about 0.5–1 GHz; they make up a conspicuous fraction (10%) of the radio sources found in high-frequency radio surveys, and are optically identified with either galaxies or quasars; their radio sizes are smaller than about 1 kpc, and their radio morphologies reveal either core-jet structures or mini-lobes embedding terminal hotspots and possibly straddling a central core. CSOs (Wilkinson et al., 1994; Readhead et al., 1996) have instead emerged in VLBI surveys as a class of radio sources with compact (500 pc) and symmetric radio structures, making them resemble “classical double” radio galaxies in miniature. Whereas there is no debate on the true compactness of CSOs, the compactness of a fraction of the core-jet GPS sources might be the result of foreshortening of extended radio sources roughly aligned with the line of sight; especially (although not exclusively) in these cases, the GPS itself might be a transient spectral state: flux-density variability and polarization studies at different radio frequencies are thus instrumental to the selection of bona-fide samples of GPS sources (Tinti et al., 2005; Torniainen et al., 2005, 2007; Orienti & Dallacasa, 2008a). The overlap between the GPS-source and the CSO classes is however significant: GPS sources associated with galaxies are most likely to display a CSO morphology, and most CSOs exhibit a GPS. This overlap is explained in terms of synchrotron radio spectra dominated by the emission of the mini-lobes, and suffering from absorption effects causing the turnover about 1 GHz (Snellen et al., 2000). GPS/CSOs associated with galaxies are thus high-confidence candidates for truly compact sources.
Although compact GPS sources were proposed to be young objects soon after their discovery (e.g., Shklovsky, 1965), a widely discussed alternative to the youth scenario was the frustration scenario, ascribing the small source size to confinement by a particularly dense interstellar medium (ISM) preventing the jet expansion (van Breugel et al., 1984). Because the required ISM confining densities are not confirmed by recent studies (e.g., Morganti, 2008), the confinement scenario is considered less likely, although it might still apply to selected objects (e.g., García-Burillo et al., 2007). Much observational evidence has instead accumulated in favour of the youth scenario, the most compelling measurement being the detection, in several GPS/CSO galaxies, of hotspot advance velocities about 0.1–0.2 (Owsianik & Conway, 1998; Owsianik et al., 1998; Tschager et al., 2000; Taylor et al., 2000; Gugliucci et al., 2005), which indicate kinematical source ages not higher than a few years, in good agreement with spectral ageing estimates (Murgia et al., 1999). Further evidence of youth comes from the underluminosity of GPS/CSO optical narrow-emission lines, suggesting that the Strömgren sphere of the recently-triggered AGN is still in an expansion phase in these sources, and we are thus witnessing the birth of their Narrow-Line Region (NLR; Vink et al., 2006).
The youth scenario is part of a wider evolutionary scenario (Fanti et al., 1995; Snellen et al., 2000), according to which GPS/CSOs would first evolve into symmetric Compact-Steep-Spectrum (CSS) sources, equally powerful but with sizes of about 1–15 kpc, and then further expand outside the host galaxy to become large-scale, powerful radio galaxies. The evolutionary link between GPS and CSS sources is supported by their membership to the anticorrelation between linear size and peak frequency (; O’Dea & Baum, 1997). However, it is not clear yet whether all GPS/CSOs will eventually become large-scale radio sources, and whether the evolved sources will display a Fanaroff-Riley type I (FRI) or type II (FRII) morphology, because of the frequency’s observational limits in the exploration of this relation for super-galactic sized sources, as well as because of the biases in the surveys from which the distribution of the radio sources in the power-linear size () diagram is drawn (e.g., Snellen et al., 2000, and references therein).
The first systematic studies of the host galaxies of GPS sources, conducted in the optical and near-infrared (NIR) bands (Snellen et al., 1996; O’Dea et al., 1996; de Vries et al., 1998a, b, 2000) showed that they are, as CSS sources, characterized by luminous masses, brightness profiles, and optical-NIR colors more typical of passively- or non-evolving giant elliptical galaxies, than either spirals, small ellipticals, brightest cluster galaxies (BCGs), or central-dominant (cD) galaxies at similar redshifts. This seems to be consistent with what was found for a sample of FRIIs rather than with the properties of FRIs, which are preferentially hosted by cD galaxies (Owen & Laing, 1989; Owen & White, 1991; Zirbel, 1996), and suggest that GPS sources are more likely to evolve, through the CSS phase, in FRIIs rather than in FRIs (de Vries, 2003). However, the morphologies of the majority (60%; O’Dea et al., 1996) of the hosts of GPS sources show signs of recent mergers and/or interactions. This evidence, apparently at odds with the passively-evolving scenario, was first interpreted as an indication that GPS sources might be associated with the first of a sequence of mergers (de Vries, 2003), possibly leading to the formation of a BCG or a cD only over time scales much longer than the lifetime of the radio source. In subsequent investigations, however, the presence of young stellar population in these giant ellipticals was revealed by means of stellar-population synthesis models applied to photometric (de Vries et al., 2007) and spectrophotometric data (Holt, 2009). Furthermore, de Vries et al. (2007) showed the similarity, out to , between the luminosities of the GPS-source hosts and of the Luminous Red Galaxies (LRGs), which are thought to represent the most massive early-type galaxies, and are often associated with BCGs. Therefore, the properties of the hosts do not provide unambiguous indications on the subsequent GPS/CSO evolutionary stages.
Despite these results, population studies highlight the existence of far too many compact sources compared to the number of powerful large-scale objects (O’Dea & Baum, 1997). Beside the possibility, not easy to justify, that these sources undergo a short-lived activity (Readhead et al., 1996), two scenarios prove to be particularly attractive to explain this statistical evidence. In the first scenario, the jet activity is intermittent on time scales comparable to the age of the small sources (e.g., Reynolds & Begelman, 1997): this scenario, supported by the observations of double-double radio galaxies (Lara et al., 1999; Schoenmakers et al., 2000; Kaiser et al., 2000), and by the detection of candidates for dying compact sources (Giroletti et al., 2005; Parma et al., 2007), finds a natural explanation in the framework of accretion-disk instabilities (Czerny et al., 2009). An accretion disk operating above a given threshold accretion rate () is expected to experience instabilities driven by the radiation pressure, causing the source undergo alternate phases of high and low activity; for moderate accretion rates, the duration of the active phases is short enough ( years) to make the compact source unable to grow to super-galactic sizes, whereas accretion rates close to the Eddington limit are required for the development of large-scale sources (Czerny et al., 2009). In the second scenario, many sources undergo processes of jet-flow turbulent disruption before their lobes can grow to large sizes, either disappearing from the radio sky (Alexander, 2000) or developing an FRI-type morphology (Kaiser & Best, 2007), in both cases experiencing a drop in luminosity. The recent finding that FRIs smaller than 40 kpc were almost absent in a sample of radio galaxies optically identified in the SDSS (Best, 2009) seems to suggest that all radio sources begin their life with collimated jets, but less powerful jets are more easily disrupted, as the source grows, in denser environments, leading to the production of FRI sources. Further evidence supporting this view might derive from the confirmation that the large fraction of low-power, compact objects with non-FRI morphology discovered within a sample of FRI candidates at (Chiaberge et al., 2009), are indeed young sources. The two above scenarios are not necessarily in conflict with each other: for sufficiently high accretion rates, accretion-disk instabilities might partake to the radio-source evolution, otherwise driven by the interplay between jet power and environmental conditions. However, this picture needs to be further explored.
It has recently become clear that instrumental clues on the evolution of young GPS sources may come from the X-ray electromagnetic window. Early detections of GPS sources by ASCA (O’Dea et al., 2000) triggered extensive searches for X-ray emission from these sources; thanks to the capabilities of XMM-Newton and Chandra, several GPS/CSOs are now known to be strong X-ray emitters (Guainazzi et al., 2004; Vink et al., 2006; Guainazzi et al., 2006; Siemiginowska et al., 2008; Tengstrand et al., 2009). However, the origin of this X-ray emission is not known yet.
The best spatial resolution currently available in the X-ray band (1′′ with Chandra) is not sufficient to resolve the X-ray morphology of most GPS/CSOs: thus, the identification of the origin of the X-ray emission in these objects relies entirely on spectral studies. The components of GPS/CSOs first proposed to be the source of the observed X-rays are the ISM of the host galaxy shocked by the expanding radio lobes (Heinz et al., 1998; O’Dea et al., 2000), and the accretion disk’s hot corona (Guainazzi et al., 2004; Vink et al., 2006; Guainazzi et al., 2006; Siemiginowska et al., 2008): both components are expected to generate thermal X-ray radiation, but they are difficult to disentangle and do not rule out alternative scenarios (Siemiginowska et al., 2009, and references therein). Furthermore, the location of GPS/CSOs on the radio/X-ray luminosity plane does not fully elucidate the relationship between “young” and “mature” radio galaxies: GPS/CSOs are as X-ray luminous as FRIIs, despite their larger radio luminosity, but they seem to lie on the high radio-power tail of the radio-core/X-ray correlation discovered for FRIs (Tengstrand et al., 2009, and references therein).
A way of investigating the origin of the X-rays in GPS/CSOs, and address, at the same time, some of the open issues on the physics and fate of young radio sources, is to simultaneously model the dynamical and radiative evolution of GPS/CSO galaxies, and constrain the models through the wealth of multiwavelength data currently available. We recently proposed a dynamical-radiative model that, for the first time, describes the evolution of the broad-band emission of a young GPS with a given jet kinetic power, as it expands through the ISM of the host galaxy (Stawarz et al., 2008). The model accounts for the radiative contribution of the various AGN components, as well as for environmental absorption effects, and predicts significant and complex non-thermal X-ray to -ray emission.
In the present paper, we apply the model to a sample of GPS/CSO galaxies, with the manifold aim of reproducing their complex radio to X-ray spectra, and constraining relevant source parameters as the jet kinetic power, the accretion rate, and the absorption mechanisms. New observational evidence supporting the model is also discussed. The paper is organized as follows: in Section 2, we briefly review the main features of the dynamical-radiative model we presented in Stawarz et al. (2008); in Section 3, we describe the source sample that we chose for the application of the model, and the relevant broad-band data; in Section 4, we show the results of the SED modeling; in Section 5, we present further evidence supporting the proposed scenario; we discuss our results in Section 6, and in Section 7 we draw our conclusions.
2. THE MODEL
We recall below the most relevant features of our non self-similar dynamical-radiative model, presented in Stawarz et al. (2008). The reader is referred to the original paper (and references therein) for a more comprehensive discussion.
2.1. Dynamical Evolution
We based our description of the dynamical evolution of a young radio source in its “GPS phase” on the model proposed by Begelman & Cioffi (1989) to explain the expansion of classical double sources in an ambient medium with density profile . The relevant equations were derived by assuming that: (i) the jet momentum flux, which is proportional to the jet kinetic power , is balanced by the ram-pressure of the ambient medium spread over an area ; (ii) the lobe sideways expansion velocity, , equals the speed of the shock driven by the overpressured cocoon, with internal pressure , in the surrounding medium; (iii) the kinetic energy transported by the jet pair during the entire source lifetime is converted into the cocoon’s energy (where is the volume of the cocoon) at the heads of the jets.
For a young GPS source expanding in the central gaseous core of a giant elliptical galaxy, and characterized by age , linear size kpc, and transverse size , we could constrain the model with a number of reasonable approximations: (i) a constant ambient density (with the proton mass, and cm), representative of the inner King density profile of the host galaxy; (ii) a constant hot-spot advance velocity , as suggested by many obervations of CSOs (see Section 1); (iii) a scaling law , reproducing the initial, ballistic phase of the jet propagation, according to Kawakatu & Kino (2006) and Scheck et al. (2002) (see, however, Kawakatu et al., 2009a, for an alternative scenario). Under the aforementioned conditions, all the lobe physical quantities become functions of two parameters only: the jet kinetic power , and the source linear size .
2.2. Spectral Evolution
In the framework of the dynamical model described above, we studied the evolution of the broad-band radiative output of GPS sources with the source expansion, for a given jet kinetic power . The magnetic field in the expanding lobes scales as , with , and being the magnetic energy density. The electron population (with the electron Lorentz factor), injected from the terminal jet shock to the expanding lobes, evolves under the joint action of adiabatic and radiative energy losses, yielding a lobe electron population , characterized by a broken power-law form with critical energy when is a power law, and by a more complex form when is a broken power law with intrinsic break (, with and the proton and electron masses, respectively; Stawarz et al., 2007). Assuming that the lobe electrons, in rough equipartition with the magnetic field and the protons (e.g., Orienti & Dallacasa, 2008b, and references therein), provide the bulk of the lobe pressure, the electron energy density is , with .
The lobe electrons emit synchrotron radiation, with luminosity roughly constant with time, and energy density . This radiation suffers then from absorption processes, responsible for the characteristic spectral change across the turnover at GHz frequencies. Because the coupling between the synchrotron-self-absorption (SSA) process and our model equations returns turnover frequencies systematically lower than those typically observed, and reproduces neither the observed slopes of the optically-thick spectra, nor the anticorrelation, the absorption process that we favoured and implemented is the free-free absorption (FFA).
Recent data on compact sources of different brightness appear to be in good agreement with the predictions of the SSA model for homogeneous sources (de Vries et al., 2009). However, this result does not exclude the viability of the FFA models (Bicknell et al., 1997; Begelman, 1999). In fact, de Vries et al. (2009) showed that the Bicknell et al.’s FFA model works well on bright sources, although it does not on faint sources, unless the ratio between jet power and radio luminosity depends on luminosity. Although this scenario might be more complicated than homogeneous SSA, this solution was never investigated either in Bicknell et al.’s or in Begelman’s FFA models in sufficient detail. In any case, this issue is not of major relevance for our sample, because we focus on bright sources, for which the FFA model works properly.
In particular, we adopted the FFA scenario by Begelman (1999), which was shown to return reliable turnover frequencies and be a promising candidate to account for the anticorrelation, while relaxing considerably the constraints on the ambient conditions required by Bicknell et al.’s model. Yet following Begelman (1999), we ascribed FFA to the external layers of interstellar gas clouds that have been photoionized by the UV radiation from the active nucleus, and are actually ionization-bounded. These gas clouds might be associated with the NLR clouds.
The particles of the lobes also produce inverse-Compton (IC) radiation via up-scattering of both the synchrotron radiation (synchrotron-self-Compton mechanism; SSC) and the local, thermal photon fields. The energy density of the thermal fields was evaluated by taking into account the contributions by a putative accretion disk, producing the bulk of its luminosity at UV frequencies, by a dusty torus, re-radiating the disk’s UV photons in the IR domain, and by the stars of the host galaxy, mostly contributing the NIR-optical photons. We obtained and , whereas is independent of for the considered kpc.
The IC scattering of all the aforementioned radiation fields yields significant and complex high-energy emission, from X-ray to -ray energies. In GPS quasars the putative direct X-ray emission of the accretion disk’s hot corona and of the beamed relativistic jets may overcome the X-ray output of the lobes. In GPS galaxies these two contributions are instead expected, respectively, to be obscured by the torus and Doppler-hidden; the lobes are expected to be the dominant X-ray source.
3. THE SOURCE SAMPLE
We chose to apply our model to the sample of eleven GPS/CSO galaxies known as X-ray emitters up to 2008.111During the preparation of this manuscript, a paper by Tengstrand et al. (2009) appeared, reporting the detection of additional X-ray emitting GPS galaxies; the modeling of the broad-band spectra of these new sources is beyond the scope of the present work. The source list is given in Table X-Ray Emitting GHz-Peaked-Spectrum Galaxies: Testing a Dynamical-Radiative Model with Broad-Band Spectra.
The sources are all members of the catalogue of radio sources with flux density greater than 1 Jy at 5 GHz by Kühr et al. (1981). The GPS nature of their radio spectra was observed at several epochs (O’Dea, 1998, and references therein). Although the bona-fide GPS nature of three of our sample’s members (IERS B0108+388, PKS B0941-080, and IERS B1345+125) was recently questioned on the basis of either flux-density variability or values of the radio spectral indices (Torniainen et al., 2007), we decided to keep these sources in our sample because the presence of the spectral peak at GHz frequencies was always confirmed. A CSO morphology characterizes the radio structures of all the sources, although one of them (PKS B1345+125) is an unusual example of CSO, with one of the two jets not being detected at frequencies above 1 GHz. Our sample’s members have radio power W Hz-1, and X-ray luminosities erg s; they are hosted by galaxies located at redshifts , i.e. at luminosity distances between 0.4 and 6.6 Gpc. The linear (projected) sizes of the radio sources are in the range pc, thus providing “snapshots” of different stages of the source expansion. More details on classification and properties of individual GPS/CSOs and their host galaxies are given in Appendix A. The source physical quantities that are more relevant to our SED modeling are summarized in Tables X-Ray Emitting GHz-Peaked-Spectrum Galaxies: Testing a Dynamical-Radiative Model with Broad-Band Spectra and 2.
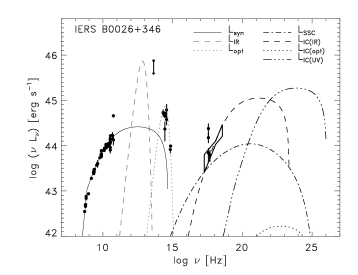
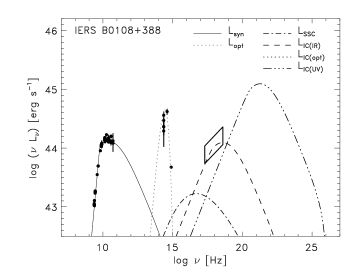
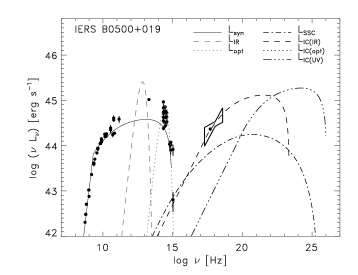
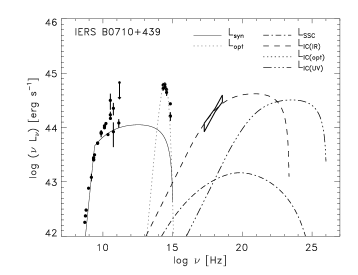
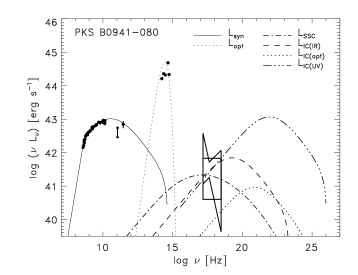
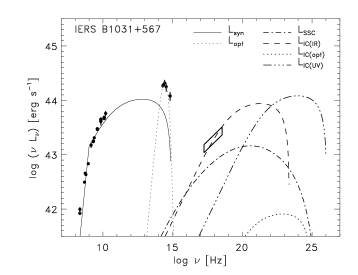
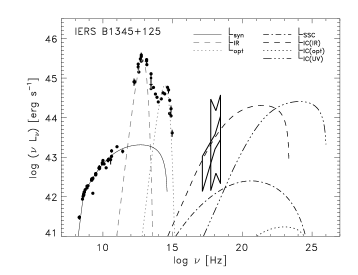
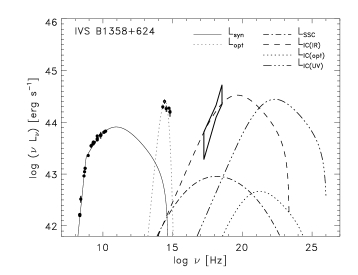
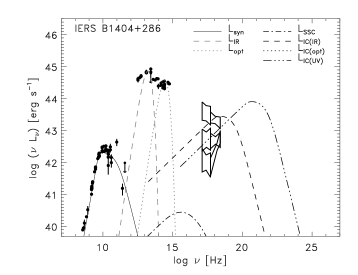
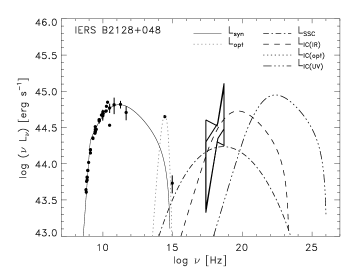
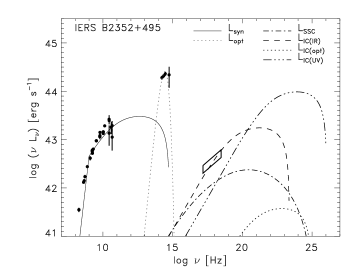
Fig. 1 shows the SEDs of the GPS/CSO galaxies of our sample. With the exception of some of the mid/far-infrared (MFIR) data, which will be discussed below, the SED data were derived from the literature (see Appendix A for the complete reference list). In particular, the near-infrared (NIR) and optical magnitudes were converted into fluxes by means of the absolute calibrations of Bessel (1979) for standard UBVK and Cousins’ RI filters, Wamsteker (1981) for standard JHL bands, and Allen (1973) for standard RI filters; the dereddening was performed by means of the extinction laws given by Rieke & Lebofsky (1985) and Cardelli et al. (1989), assuming as B-band Galactic extinctions () the values by Schlegel et al. (1998) provided by the NASA/IPAC Extragalactic Database (NED). Source-intrinsic reddening effects were not considered in these bands, given the dominance of the host-galaxy contribution. The X-ray unabsorbed fluxes were derived from the absorbed fluxes by means of XSPEC v. , taking both the Galactic and the source-intrinsic hydrogen column densities ( and ) into account. The SED luminosities at the source rest-frame frequencies were then computed by assuming modern cosmology (see above). No -correction was applied to the data.
In our sample, literature data in the MFIR band were available for two sources only: IERS B1345+125 and IERS B1404+286. Given the importance of the MFIR portion of the SED for our modeling (see Section 4), we thus searched for and analysed archival Spitzer222http://www.spitzer.caltech.edu/ IRAC333Infrared Array Camera (Fazio et al., 2004) and MIPS444Multi-Band Imaging Photometer for Spitzer (Rieke et al., 2004) observations of our sample’s members.
IRAC data for IERS B1345+125 (prog. ID 32, January 2004; Fazio & Wang, 2004) and IERS B1404+286 (prog. ID 30443, July 2006; Rieke et al., 2006) were available in all of the four bands (3.6, 4.5, 5.8, and 8.0 m). MIPS observations at 24 and 70 m were performed for IERS B1345+12 (prog. ID 30877, July 2007; Evans et al., 2006) and IERS B1404+286 (prog. ID 30443, July 2006; Rieke et al., 2006) an additional 24 m zodiacal light calibration image with IERS B0500+019 observed in the field (prog. ID 1882, April 2007) was also available. The analysis of the aforementioned IRAC and MIPS data is described in Appendix B; the flux densities are reported in Table 2.
4. MODELING THE BROAD-BAND SPECTRA
Our dynamical-radiative model, summarized in Section 2, is a powerful tool to study the evolution of a typical GPS-source synchrotron SED as a function of the time-dependent source linear size , given the kinetic power of the jets, , and the energy spectrum of the hot-spot electrons injected into the lobes; furthermore, assuming typical luminosities for the putative torus’ and accretion-disk’s components, as well as for the host galaxies, the model enables one to investigate the temporal evolution of the high-energy, comptonized SED component (Stawarz et al., 2008).
By applying the model to sources with measured (projected) linear sizes, we could here constrain their jet kinetic powers, as well as the spectra of their hot-spot particles; furthermore, we could test the viability of the FFA effect as the main responsible for the optically-thick part of the radio spectra; finally, the observational constraints on the luminosities of the host galaxies, and, for a few sources, of the torus emission, enabled us to evaluate the contribution of the comptonized radiation to the high-energy emission of the source.
In Fig. 1, we show the modeling of the intrinsic broad-band SEDs of our sample’s sources, and Table 3 reports on the values of the best-fit parameters. More details on the modeling of the various SED components are given below.


4.1. Synchrotron emission
In our model, the computation of the theoretical radio spectrum is performed under the assumptions that the radio emission is dominated by the contribution of the lobes, and that each lobe contributes the same amount of radiation. Although the theoretical source morphology is necessarily much simpler than the actual source structure, the above approximations reasonably fit our sample of GPS/CSO galaxies.
For the selected sources, we thus modelled the radio spectrum as synchrotron radiation produced by the electron population of the lobes, , which represents the evolution of the injected particle hot-spot population . Among the possible injection functions discussed in Section 2, we chose the broken power law , with for , and for , the break being fixed at ; a similar spectrum was indeed inferred from the broad-band modeling of the hot-spot emission of the radio galaxy Cyg A, and interpreted as the result of a transition between two different acceleration mechanisms: the cyclotron resonant absorption, and the diffusive shock acceleration (Stawarz et al., 2007, and references therein). The lower and higher Lorentz factors of the emitting particles were chosen as and . The emission of this particle population well reproduces the optically-thin part of the spectrum, i.e. the emission at frequencies higher than the turnover.
FFA effects, as those generated by a spray of interstellar clouds engulfed by the expanding lobes and mingled with the synchrotron-emitting gas, are included in the model in order to compute the optically-thick portion of the spectrum, i.e. the emission at frequencies lower than the turnover. The value of the turnover frequency enters the model as an input parameter (); the calculation of this value would indeed require the physical and geometrical modeling of the absorber, and thus the introduction of additional free parameters in the model (see Begelman, 1999).
The combination of the above synchrotron emission with the adopted absorption model returned a spectral shape of the form (with the luminosity unaffected by FFA), and satisfactorily fits the shape of most of the optically-thick spectra without the need of assuming source inhomogeneities. This feature of our scenario is not shared by the SSA scenario. SSA effects would return an optically-thick spectrum with slope independent of the optically-thin slope, and equal to 5/2 for a homogeneous source; to obtain a flatter spectrum an inhomogeneous source should be assumed. Nevertheless, the issue of homogeneity can also play a role in our scenario. In fact, our absorption model significantly deviates from the data in the case of IERS B2352+495, a source whose spectrum is much flatter than predicted at frequencies below the turnover; in this spectral region, the source structure is indeed more complex than we assumed (Araya et al., 2010, and references therein).
The spectral fits described above enabled us to constrain , , and (see Table 3).
4.2. Thermal radiation fields
The thermal radiation fields that we considered as soft-photon sources for the IC emission are the host galaxy’s stars, the circumnuclear torus, and the accretion disk.
We are interested in evaluating the relevance of the contribution of these radiation fields in the IC process, rather than in carefully modeling the SED of these components. Therefore, for the sake of simplicity, we modelled the spectra of the above thermal photon fields as black-body spectra with the appropriate frequency peaks and bolometric luminosities.
4.2.1 Host galaxy
As mentioned in Section 1, the properties of GPS-source host galaxies are consistent with those of non-passively evolving giant ellipticals: they often display signs of recent star formation as well as morphological disturbances. Nevertheless, departures from our assumption of a constant-density medium for the inner kpc-scale core (see Section 2) are negligible for any GPS-source host galaxy.
As shown by, e.g., Silva et al. (1998), the typical SED of an evolved giant elliptical displays a dominant optical-NIR hump peaking about 1–2 m, with peak luminosity of a few 1044 erg s, and a secondary MFIR hump peaking about 100 m, and a factor 300 fainter. Starburst, interacting, and ULIRG galaxies can however show a MFIR hump with a peak luminosity up to a factor 50 higher than the optical-NIR peak.
We could satisfactorily model all of our galaxy optical-NIR SEDs with a black-body spectrum peaked at m ( Hz), and a bolometric luminosity in the range erg s(see Table 3). MFIR data were available for three objects of our sample: in all of these cases, we did not associate the MFIR emission with the galaxy, but with circumnuclear dust (see Section 4.2.2).
4.2.2 Torus
Besides the emission from the host-galaxy dust accompanying possible star-formation activity, a putative circumnuclear dusty torus re-radiating part of the UV radiation absorbed from the accretion-disk would also contribute to the total emission in the MFIR domain.
Most of our sample’s sources lack MFIR observations and/or detections. In the three objects detected at MFIR frequencies, the radio-to-MFIR spectra clearly show that the MFIR data lie well above the extrapolation of the synchrotron spectrum, ruling out the jet as the source of this radiation, and suggesting a thermal origin of the MFIR spectral component.
These sources are not spatially resolved in this energy window, preventing us to locate the site of the MFIR emission. Nevertheless, as we already mentioned in Stawarz et al. (2008), hints for the presence of a dusty torus around their AGN come from numerous observations of samples of GPS and CSS sources. Heckman et al. (1994) showed, by means of IRAS data (12–100 m), that the MFIR luminosity of GPS and CSS sources is comparable to that of extended sources with similar radio power and redshift, and is consistent with thermal emission from dust heated by the UV emission of the central AGN, rather than with radiation from a circumnuclear starburst. Analysis of ISO data by Fanti et al. (2000) also proved that FIR (60–100 m) luminosities of GPS and CSS radio galaxies are not significantly different from those of extended objects, and associated the observed luminosities (on average L☉) to dust with temperatures from 25–30 K (warm component) up to 60–100 K (hot component), whose masses are M☉ and M☉ respectively. Finally, combining ISO data at 2–200 m with millimetric and sub-millimetric observations of 3CR radio galaxies and quasars, Haas et al. (2004) demonstrated that both classes show MIR-to-FIR luminosity ratios typical of powerful AGNs; the MFIR emission can be ascribed to dust with temperatures between 30 and 100 K; quasars and galaxies preferentially display and , respectively, according to the idea that the thermal dust emission is located in the torus, whose internal, hotter component cannot be observed by edge-on observers. The above findings were confirmed by Spitzer/MIPS (m) observations of FRII radio galaxies and quasars: Shi et al. (2005) showed the dominance of thermal emission from AGN-heated dust in their MFIR spectra, and no difference between small- and large-scale sources; CSS sources with sizes of 2–400 kpc displayed MFIR luminosities between L☉, with no size-luminosity correlation.
On the other hand, Polletta et al. (2008) modelled, by means of clumpy-torus models, the IR SEDs of a sample of MIR-luminous AGNs at discovered by Spitzer (IRAC and MIPS, m): the MIR data could be reproduced by a single-temperature (300 K) dust component; for sources detected at FIR frequencies as well, the additional, FIR spectral component could be modelled either with an AGN-heated colder dust component detached from the torus, or with an exceptionally powerful ( L☉) starburst, thus leaving the issue of the origin of FIR emission open.
Finally, Spitzer data of FRI radio galaxies (Leipski et al., 2009) recently proved that star formation is actually present in these sources, with a contribution to the MIR emission ranging from minor to dominant; for sources in which the nuclear MIR component could be identified, this component is dominated by non-thermal emission, although some FRIs do exist with clear indication of AGN-heated dust emission. The debate on MFIR emission is thus clearly open.
As discussed in Section 3, MFIR data were available for three of our sample’s members only. For the sake of simplicity, we chose to model the MFIR emission of these GPS/CSO galaxies with single-temperature black-body spectra, which we associated with torus’ dust. The spectral fit yielded black body temperatures K, and thus peak wavelengths m. For the remaining sources, with no MFIR data available, we assumed the torus’ dust to radiate as a black body with temperatures K; its spectrum thus peaks at wavelengths m. The broad-band spectral fit procedure yielded MFIR luminosities erg s(see Table 3).
Even though our analysis of the Spitzer/IRAC observations suggests the presence of a hotter, MIR-emitting dust component in two sample’s sources (IERS B1345+125 and IERS B1404+286), these objects are brighter in the FIR than in the MIR domain. Therefore, our single-temperature black-body spectral model accounts for the dominant IR component. Furthermore, the exact shape of the IR spectrum does not play a crucial role in determining the resulting X-ray spectrum, which is more heavily affected by the peak frequency of the IR spectrum and by the electron energy distribution.
4.2.3 Accretion disk
Both the direct UV emission from the disk and the possible X-ray emission from a hot corona (e.g. Koratkar & Blaes, 1999; Cao, 2009) are expected to be largely obscured by the dusty torus, in edge-on AGNs. Emission lines are thus used to investigate the accretion properties of obscured sources.
According to the findings by Baum & Heckman (1989) and Rawlings & Saunders (1991) for extended sources, the [Oiii]5700 luminosity was claimed to be positively correlated with the radio luminosity also for a sample of GPS and CSS sources (Labiano, 2008): this would support the traditional scenario according to which the AGN powers both the ionized gas and the radio emission.
Additional sources of ionization might however be plausible. Early studies by Morganti et al. (1997) showed that no significant differences in line luminosities and ratios were present between compact (CSS) and extended radio sources with comparable radio power and redshift, and only tentative evidence for a lower Oiii luminosity in CSS sources was found. More recently, however, Labiano (2008) claimed the existence of a possible positive correlation between Oiii luminosity and the size of the radio source, suggesting that the jet expansion contributes to enhance the line emission.
Kawakatu et al. (2009b) recently compared the observed properties of some narrow emission lines of a sample of young radio-loud galaxies (average size of 3 kpc) with those of a sample of radio-quiet Seyfert 2 galaxies, and found that young radio-loud galaxies have systematically larger low- vs. high-ionization emission line ratios ([Oi]6300/[Oiii]5700). They concluded that powerful, young AGNs favour accretion disks without a strong big blue bump (hereafter BBB), whereas a strong BBB would be present in Seyfert 2s. The BBB is actually missing in geometrically thick and optically thin accretion disks. However, such disks would be characterized by a radiatively inefficient accretion flow (RIAFs; e.g., Narayan & Yi, 1995), unable to generate the bolometric luminosities necessary to produce the Oiii emission observed in young radio galaxies (Kawakatu et al., 2009b), and in conflict with the high accretion rates found by Wu (2009a) for a sample of young radio sources.
As acknowledged by Kawakatu et al. (2009b), an alternative explanation for the observed line ratios might be a scenario in which young radio galaxies do have a disk SED with BBB, but they are characterized by systematically different combinations of the hydrogen column density and the ionization parameter (generally, higher and lower ). Alternatively, following our model, the hard spectral component needed to explain the Oi/Oiii line ratio might come from the UV photons produced through IC in the expanding lobes (see Sect. 4.3).
The above evidence highlights that the actual SED of the accretion disk in GPS sources is still not well constrained, and might be different from that of both standard disks and RIAFs.
In our broad-band SED modeling, we assumed that the disks of GPS sources do produce the BBB (Koratkar & Blaes, 1999) characteristic of Seyfert 2s and quasars: we fixed the emission peak at 10 eV ( Hz; K ) and found luminosities ergs(see Table 3). This UV disk emission would be partly reprocessed by the dusty torus and re-radiated in the MFIR band, partly absorbed by the NLR gas clouds, and partly upscattered off the lobe high-energy particles to -ray energies. In the modeling procedure, the disk luminosities were constrained by the MFIR luminosities (see Table 3); the MFIR luminosity values, in turn, were constrained either by MFIR observations (when available) or by the X-ray spectral fitting (see Section 4.3). As we showed in Stawarz et al. (2008), possible detections of (or upper limits on) GeV -ray emission of GPS/CSO galaxies by the Large Area Telescope on board the Fermi Gamma-Ray Space Telescope (hereafter Fermi/LAT; Atwood et al., 2009) would constrain the disk luminosity in the UV band, thus enabling a test of the BBB assumption for the disk spectrum (see Section 4.3).
4.3. Inverse-Compton emission
The high-energy spectral components were computed through inverse-comptonization of the aforementioned synchrotron and thermal radiation fields off the lobe electron population responsible for the synchrotron radio spectrum. As discussed in Stawarz et al. (2008), we assumed a magnetic field only a factor of a few below the equipartition value (, ); this assumption is roughly consistent with the finding by Orienti & Dallacasa (2008b) that equipartition holds in the lobes of GPS sources.
As Fig. 1 shows, in most of our sources the modelled X-ray emission is dominated by the inverse-comptonization of the MFIR photon field (IC(IR)). The contributions of the inverse-comptonized UV radiation (IC(UV)) and of the SSC emission reaches comparable magnitude in a few objects; the starlight does not play, as IC seed photon, a relevant role in any of our sources (see, however, Stawarz et al., 2008, for the complete theoretical case study). Our model well reproduces the observed X-ray spectra for reasonable assumptions on the thermal emission of the circumnuclear dust and of the accretion disk.
The model also predicts significant -ray emission up to the GeV-TeV domain, not observed so far in any GPS galaxy. Even though, in some of our sample’s sources, the high-energy tail of the IC(IR) spectral component reproducing the observed X-ray spectrum extends to the soft -ray energy band, the modelled -ray emission can be mostly identified as the result of the IC scattering of the UV photons produced by the accretion disk with characteristic BBB and appropriate luminosity, which we assumed to operate in the source.
A comparison of our modelled SEDs with the Fermi/LAT sensitivity curves (Atwood et al., 2009) shows that none of our GPS/CSO galaxies could be detected by Fermi/LAT in less than one year: this is consistent with the current lack of any of these sources in the Fermi/LAT First Source Catalog (Abdo et al., 2010). The modeling also predicts that five out of eleven sample’s members (i.e., IERS 0026+346, IERS B0108+388, IERS B0500+019, IERS B1345+125, IERS B1404+286) could be detected by Fermi/LAT at level after an integration time of about one year. This prediction should however be taken with caution: as mentioned in Section 4.2.3, the -ray fluxes depend upon the assumed accretion disk luminosities , as well as upon the high-energy tail of the lobe electron distribution. A non-detection by Fermi/LAT might thus imply either UV accretion disk luminosities lower than we assumed, or a different electron distribution in the lobes.
5. FURTHER SUPPORT TO THE X-RAY LOBE SCENARIO: THE - CORRELATION
5.1. Context
As we recently pointed out (Ostorero et al., 2009), the prediction of the X-ray–emitting lobes that characterizes our model may be supported by further observational evidence.
The X-ray emission of GPS galaxies was traditionally mostly interpreted as thermal radiation from the accretion disk, absorbed by a gas component associated with the AGN and characterized by an equivalent hydrogen column density (O’Dea et al., 2000; Guainazzi et al., 2004, 2006; Vink et al., 2006; Siemiginowska et al., 2008), rather than as non-thermal emission from the jet or the lobe. Non-thermal emission from the jet/lobe, although not always completely ruled out, was never considered to be significant. The main argument brought in support of a disk-dominated X-ray emission scenario is the apparent discrepancy between the equivalent total-hydrogen column density derived from the X-ray spectral analysis and the neutral hydrogen column density derived from the radio measurements of the 21-cm absorption line, when the latter is available. The authors concluded that, because always exceeds of 1–2 orders of magnitudes, the X-rays must be produced in a source region that is more obscured than the region where the bulk of the radio emission comes from, and thus located within the radio lobes; if this was not the case, an unreasonably high fraction of ionized hydrogen (Hii) should be assumed to account for the above difference (Guainazzi et al., 2006; Vink et al., 2006). Such a scenario would also be consistent with the observed anticorrelation between and linear size found by Pihlström et al. (2003), being the fraction of ionized gas likely low in a young radio source with still expanding Strömgren sphere (Vink et al., 2006).
The discrepancies between the and values mentioned above should in fact be regarded with caution. The estimate is derived, from the measurements of the hydrogen 21-cm absorption lines, as a function of the ratio between the gas spin temperature and its covering factor , representing the fraction of the source covered by the Hi screen (e.g. Gupta et al., 2006). The common assumption K refers to the case of complete coverage () of the emitting source by a standard cold ( K) ISM cloud in thermal equilibrium, and thus with spin temperature equal to the kinetic temperature (. However, this assumption returns a value of that represents a lower limit to the actual column density of both the total and the neutral hydrogen (e.g. Pihlström et al., 2003; Vermeulen et al., 2003; Gupta et al., 2006). In fact, when K, the expected high abundance of the molecular hydrogen, (Maloney et al., 1996), might account for the difference between and . On the other hand, in the AGN environment, illumination by X-ray radiation might easily raise up to K (Maloney et al., 1994; Conway & Blanco, 1995), making raise accordingly (Davies & Cummings, 1975; Liszt, 2001); a source covering factor smaller than unity would also increase the ratio; both the above effects would potentially lead to values fully consistent with the estimates. Finally, temperatures as high as several K would likely imply the presence of a non-negligible fraction of ionized hydrogen (Hii; Maloney et al., 1996; Vink et al., 2006), also contributing to relax possible residual column-density discrepancies.
Evidence is mounting that, in GPS and CSS sources, the Hi absorption lines are not generated by a screen covering the source uniformly: instead, they originate in clouds of neutral hydrogen connected with (at least one of) the jet/lobe radio structures, and possibly interacting with it (Morganti et al., 2004b; Labiano et al., 2006; Vermeulen et al., 2006; Araya et al., 2010). The association of the bulk of the Hi absorption with the optical emission line currently supports the identification of the absorbers with the atomic cores of the NLR clouds, although the presence of Hi elsewhere is not ruled out (Labiano et al., 2006; Vermeulen et al., 2006).
In our GPS-source model, the NLR clouds are gradually engulfed by the expanding radio lobes. Moreover, the cloud density is assumed to decrease with the distance from the AGN as (with ), according to the observations of the NLR in Seyfert galaxies (Kraemer & Crenshaw, 2000; Kraemer et al., 2000; Bradley et al., 2004), and consistently with the anticorrelation between and linear size found by Pihlström et al. (2003). Because in our model the contribution of the lobes to the X-ray output of the source is significant, becoming stronger and stronger with increasing source compactness, the NLR clouds might thus play an important role in the absorption of the lobe X-ray radiation.
5.2. - Correlation
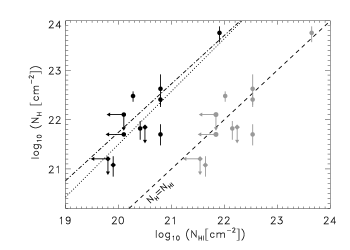
As discussed above, besides the modeling of the broad-band SEDs, a way of discriminating among different scenarios, and unveil the actual X-ray production site, is to compare the properties of the X-ray and radio absorbers, i.e. compare the column densities derived from the analysis of the X-ray data, , and those obtained from radio measurements at the redshifted 21-cm wavelength, . Such a comparison can be performed on a source-by-source basis: an ad hoc increase of either the parameter or the ratio can always remove possible and discrepancies. Alternatively, one can compare the column densities of a sample of sources: the existence of a positive, significant - correlation would suggest that the X-ray and radio absorbers coincide, thus supporting the co-spatiality of the X-ray and radio source.
We investigated the existence of a connection between and in our sample. For a positive correlation, we searched the source sub-sample for which both and estimates (either detections or upper limits) are available (see Table X-Ray Emitting GHz-Peaked-Spectrum Galaxies: Testing a Dynamical-Radiative Model with Broad-Band Spectra). The results of the correlation analysis are reported in Tables 5, 6, and Fig. 2, and are discussed below.
Estimates of were available for ten out of eleven sample’s members, and an upper limit was available for the remaining source; was instead measured in 6 sources only, and upper limits were derived for 2 additional objects. Estimates of both and were available for a sub-sample of five sources; taking the upper and lower limits to and into account, the sub-sample extended to eight sources.
Note that, due to the poor photon statistics, the upper limit to for source PKS B0941-080 was derived (A. Siemiginowska, priv. comm.) from a re-analysis of the Chandra data (Siemiginowska et al., 2008) in two different ways: (i) by fixing the absorption equal to the Galactic value, and letting the photon index free to vary; (ii) by letting the intrinsic absorption free to vary, and fixing the photon index to a value varying in the range =1.71.9, the upper-limit of this range being reported as the mean of both radio galaxies (Brinkmann et al., 1995) and GPS sources (Brinkmann et al., 1997). In our analysis, we adopted the more conservative estimate (i). For source IERS B1345+125, estimates of were derived from two observations carried out by different instruments (ASCA and Chandra) in different epochs (1996 and 2000, respectively). Given the fact that we cannot rule out long-term column-density variations, we included both estimates in our data set; however, including the average does not change our results significantly. Finally, the physics of IERS B1404+286 appears to be so complex that a variety of models can satisfactorily fit the X-ray data (Guainazzi et al., 2004). As a consequence, the inferred values of can vary by a factor 100 (see Table X-Ray Emitting GHz-Peaked-Spectrum Galaxies: Testing a Dynamical-Radiative Model with Broad-Band Spectra). This forced us to remove this source from our correlation analysis.
Our final correlation sample thus consisted of seven sources. Hereafter, the sub-sample of objects for which column density estimates did exist will be referred to as sub-sample D5, wherease sub-sample U2 will indicate the sources for which upper limits to and/or were estimated; our full correlation sample will be indicated as sub-sample D5+U2. The column-density detections and upper limits that entered the above sub-samples were indicated with boldface characters in Table X-Ray Emitting GHz-Peaked-Spectrum Galaxies: Testing a Dynamical-Radiative Model with Broad-Band Spectra.
A Pearson correlation analysis applied to sub-sample D5 revealed a significant (probability of the null-hypothesis of no correlation being true: Prob. ) - positive correlation. The statistical significance of this correlation, however, is admittedly driven by source IERS B0108+388, characterized by the highest - values. Indeed, in the same sub-sample, the evaluation of the correlation by means of more robust, non-parametric (or rank) methods (i.e. Spearman’s and Kendall’s correlation coefficients; Press et al., 1992), decreased the significance of the correlation.
In the full correlation sample, i.e., sub-sample D5+U2, the correlation was investigated by means of survival analysis techniques. In particular, we made use of the software package ASURV Rev. (La Valley et al., 1992), which implements the methods for bivariate problems presented in Isobe et al. (1986). The sub-sample D5+U2 was shown to display a positive correlation, with significance level about 8%. The results of our correlation tests are reported in the first raw of Tables 5 and 6.
It is rather promising that the significance of the correlation substantially improved when the sample size was increased to ten sources by including the three new X-ray GPS galaxies, among those reported by Tengstrand et al. (2009), for which both and estimates were available.555Detection: 4C +32.44; upper limits: PKS 0428+20 and 4C +14.41 . In this case, the probability of the null-hypothesis of no correlation being true decreased to 2%. The results on the full composite sample, including the additional sub-samples AD (additional detection) and ADU (additional detection and upper limits), are given in the second raw of Tables 5 and 6. We wish to stress that dropping source IERS B0108+388 (which drove the correlation in sub-samples D5 and D5+U2) from the full sample D5+U2+ADU, returned a correlation with still good significance (5%: Spearman; 6%: Kendall).
We note that our tentative correlation, that we anticipated for a smaller source sample in Ostorero et al. (2009), is in agreement with the tentative anticorrelation between and linear size reported by Tengstrand et al. (2009), given the known GPS-source - anticorrelation (Pihlström et al., 2003). We also note that a comparison of and in a sample of spiral-hosted Seyfert galaxies did not reveal any correlation (Gallimore et al., 1999).
As far as the law describing the relationship between and is concerned, according to Pearson’s test we could fit a linear relation to the log()-log( ) sub-samples D5 and D5+AD; however, this relation is not a good description of the data ( and , respectively). As for the censored sub-samples, D5+U2 and D5+U2+ADU, we applied the ASURV Schmitt’s linear regression to estimate the best-fit straight-line parameters; however, this procedure did not enable us to evaluate the goodness of the fit. The results of our linear regression analysis are reported in the last two columns of Tables 5 and 6, and are displayed in Fig. 2.
6. DISCUSSION
Our systematic SED analysis provided us with constraints on some interesting physical parameters of our sample’s members, as the spectrum of the electrons injected from the hot spots into the lobes, the luminosities of the accretion disk and the torus, the accretion efficiency, and the jet kinetic power, as discussed below.
The broken power-law energy distribution assumed for the electron population injected into the lobes is characterized by a break energy ; furthermore, the lower-energy segment () of the spectra have indices , and are thus mostly flatter than the canonical spectra generated by diffusive (1st order Fermi) shock acceleration. These findings are in good agreement with the results inferred from the modeling of the broad-band spectra of both the hot spots of some extended radio galaxies (Stawarz et al., 2007; Godfrey et al., 2009) and luminous blazars (Sikora et al., 2009). Therefore, as the aforementioned cases, our sources seem to fit into a scenario in which two different acceleration processes are at work in mildly-relativistic shocks: a pre-acceleration process responsible for the lower-energy spectra, as e.g. the cyclotron resonant absorption (Hoshino et al., 1992; Amato et al., 2006), and an acceleration process acting at higher energies, as e.g. the Fermi-type mechanism. The transition between the two acceleration regimes, marked by the energy break , would reflect the dominant role of the protons in the jet’s dynamics.
The torus luminosities yielded by our modeling ( erg s) are as large as the ones observed in powerful quasars and FRII radio galaxies (e.g., Shi et al., 2005); moreover, the accretion disk luminosities ( erg s) are as large as the ones estimated for powerful flat-spectrum radio quasars (FSRQs) (e.g., Sambruna et al., 2006; Ghisellini et al., 2009). However, the jet kinetic powers that we found ( erg s) are smaller than the values claimed for FSRQs ( erg s; e.g., Sambruna et al., 2006; Xu et al., 2009; Ghisellini et al., 2009); they rather seem to be comparable to the jet powers estimated for steep-spectrum radio quasars (SSRQs) with similar BH mass, and to be higher than those of BL Lacertae objects and FRI radio galaxies (e.g., Xu et al., 2009).
As noted by Czerny et al. (2009), assuming a standard 10% radiative efficiency for both the accretion disk and the radio jet, the jet kinetic power sets a lower limit to the accretion luminosity: . The results of our modeling yielded accretion-disk luminosities and jet kinetic powers such that (see Table 3, col. 10): this confirms the radiative efficiencies typically assumed, and characterizes our sources with jet/disk luminosity ratios of , a factor 100 lower than the ratios typically found in powerful blazar sources (1-10; e.g., Celotti & Ghisellini, 2008).

The best-fit values of the accretion-disk luminosities enabled us to make a reasonable guess on the source accretion rates. BH mass estimates were available for eight of our sample’s members; by using the estimated BH mass values for these sources, and the average BH mass of M☉ derived by Wu (2009b) for a sample of GPS sources in the remaining three sources, we inferred for our GPS/CSO galaxies Eddington ratios of (see Table 3, col. 11).
These ratios correspond to accretion rates that are comparable to (for source IERS B1404+286) or much higher than (for all the other sources) the critical accretion rate proposed by Czerny et al. (2009) as the threshold above which the radiation pressure instability operates in accretion disks, giving rise to intermittent source activity. Therefore, the results of our modeling are consistent with all of our sample’s members being intermittent radio sources, with IERS B1404+286 being a border-line case.
In this context, according to the prescription by Czerny et al. (2009), for values of the disk viscosity in agreement with the observational constraints (; e.g., Starling et al., 2004), the sources characterized by are potentially able to undergo outburst phases lasting 104 years, and thus grow to super-galactic scales after a few of these outbursts, provided that they have the appropriate BH mass. Higher viscosity values would imply higher accretion rate thresholds. Except for IERS B1404+286, our sample’s members are characterized by accretion rates higher than this limit; however, their BH masses imply outburst durations shorter than years. This can be seen in Fig. 3, where our sample’s members are plotted in the vs. diagram, and are compared to the lines of constant outburst duration predicted by the radiation pressure disk instability model by Czerny et al. (2009): all the sources lie below the line representing the outburst duration years, and are thus expected to undergo shorter-lived outbursts which will prevent them to reach super-galactic scales. Interestingly, most of our sources follow the year outburst model curve. Note that for three of our sample’s members (open symbols in Fig. 3) the BH mass was assumed (see above); the availability of a BH mass estimate might change the location of these objects in the diagram.
7. CONCLUSIONS
For the first time, we systematically compared the broad-band spectra of a sample of GPS/CSO galaxies with a model. Specifically, we showed that the dynamical-radiative model we proposed in Stawarz et al. (2008) can reproduce the observed emission, from the radio to the X-ray energy range, of eleven GPS/CSO galaxies characterized by different linear sizes, and thus sampling different stages of the source expansion.
The radio spectra were modeled as synchrotron emission by a lobe electron population that represents the evolution of an injected hot-spot electron population suffering from adiabatic and radiative energy losses. At frequencies below the turnover, the shape of most of the spectra could be satisfactorily accounted for by an absorption scenario dominated by the FFA mechanism.
The X-ray emission could be interpreted as non-thermal radiation produced through IC scattering of the local thermal radiation fields off the lobe electron population. Among the possible seed photon fields, the dominant role in the generation of the X-ray radiation via IC scattering is played by the MFIR radiation, which we associated to the putative circumnuclear dusty torus; dust associated with circumnuclear star-forming regions might also contribute to this emission, but this would not affect our results significantly. The UV radiation emitted by the accretion disk gives a contribution comparable to that of the MFIR photons in a few sources only, but provides the bulk of the seed photons responsible for the -ray emission. Our model proved to be a viable alternative to the thermal, accretion-disk dominated scenario for the interpretation of the X-ray emission of GPS/CSO galaxies.
Finally, from a more observational perspective, our radiative model finds further support in the comparison of the measurements of the radio and X-ray hydrogen column densities of a sub-sample of our source ensemble: the data suggest a positive correlation, which, if confirmed, would point towards the co-spatiality of the radio and X-ray emission regions. New radio measurements, necessary to improve the statistics of our correlation sample, as well as the quality of the available data, are currently being performed.
Appendix A NOTES ON INDIVIDUAL SOURCES
A.1. IERS B0026+346 (COINS J0111+3905; OB +343)
The object, quite powerful in the radio band ( W Hz-1), was observed repeatedly at many radio frequencies since the 1980’s. Because of its convex radio spectrum (e.g., Jauncey et al., 1970; Kühr et al., 1981), it was identified as a GPS source, although the spectral turnover did not look dramatic. The GPS nature of the source was also confirmed, on the basis of flux variability and spectral shape, by Torniainen et al. (2007). Despite the detection of a 4.7 apparent speed, atypical for GPS sources, for the brightest source component (Kellermann et al., 2004), recent flux-density monitoring measurements by Torniainen et al. (2007) detected only moderate variability and a spectrum steep enough to confirm the classification of the object as a GPS source on the basis of their criteria. The source is seen as an unresolved core by the VLA (Ulvestad et al., 1981); however, VLBA maps enabled Kellermann et al. (1998) to classify the object as a double source, by assuming that the core of one of the weaker, intermediate components was the core of a CSO, although they could not exclude the core as being actually located at one of the extremities. The overall source structure extends over 35 mas (211 pc), and is hosted by a galaxy located at (Zensus et al., 2002), whose optical -band magnitude is (Snellen et al., 1996, and references therein).
In the X-ray energy range, the source was firstly successfully detected (0.54–3.9 keV) by the Einstein Observatory in 1980 (Bregman et al., 1985; Kollgaard et al., 1995, and references therein). The target was then re-observed by ROSAT (0.1–2.4 keV), during both the ROSAT All Sky Survey (RASS) and a pointed observation in 1992 (Kollgaard et al., 1995, and references therein), and was detected in a possibly lower flux level. Conclusive spectral information could be extracted neither from the Einstein nor from the ROSAT data. Finally, the source was the target of a pointed observation by XMM-Newton (0.5–10 keV) in 2004 (Guainazzi et al., 2006): the source was detected with a keV luminosity of erg s. the data spectral fitting revealed a spectrum with slope and a relatively high column density ( cm), whereas the timing analysis showed the existence of a flux variable of a factor 3 on time-scales of a few ks. From the comparison of the Einstein, ROSAT, and XMM 1-keV flux densities a soft–X-ray flux decline of a factor 3 over 10 years emerged: however, due to the quality of the X-ray data, it was not possible to ascribe those variations to a change of the column density of the intervening absorber (Guainazzi et al., 2006). Based on the detection of rapid X-ray variability in the XMM data set, Guainazzi et al. (2006) constrained, through the light-travel argument, the size of the X-ray emitting region to 10 pc, concluding that the X rays are produced either at the base of the jet or in the accretion disk; the lack of excess soft X-ray emission is also brought by the authors in support of a scenario in which the hotspots are X-ray silent.
A.1.1 References for spectrum and SED of Fig. 1
Jauncey et al. (1970); Kapahi (1981); Ulvestad et al. (1981); Peacock et al. (1981); Perley (1982); Rudnick & Jones (1982); Hutchings et al. (1994); Heckman et al. (1994); Taylor et al. (1994); Kollgaard et al. (1995); Kovalev et al. (1999); Teräsranta et al. (2001); Zensus et al. (2002); Hirabayashi et al. (2000); Waldram et al. (2003); Teräsranta et al. (2005); Beichman et al. (1981); Stickel et al. (1994); Snellen et al. (1996); Guainazzi et al. (2006); NED.
A.2. IERS B0108+388 (COINS J0029+3456; OC +314)
This GHz-peaked radio source, very powerful in the radio band ( W Hz-1), has been classified as a CSO. It displays a nucleus with inverted spectrum, and twin jets with steeper spectra extending 3 mas (20 pc) from the nucleus toward the NE and SW (Carilli et al., 1998, and references therein). High-resolution imaging of the source was first performed at 5 GHz as part of the PR VLBI survey (Pearson & Readhead, 1988), showing the source to have a simple double structure. Conway et al. (1994) and Taylor et al. (1996), with more sensitive and higher resolution images at higher frequencies, revealed a steeply inverted core connected to both outer components by a faint chain of components. Overall, IERS B0108+388 has an “S” symmetry, a relatively common feature among CSOs (Readhead et al., 1996). Unlike most CSOs, IERS B0108+388 also displays a large-scale jet with steep spectrum, extending about 25′′ (170 kpc) to the east of the nucleus (Baum et al., 1990). Proper motions enable an estimate of the kinematic age of 400 yr (Owsianik et al., 1998; Polatidis & Conway, 2003). The radio flux density is weakly polarized ( at 4.8 GHz); although it was claimed not to vary significantly (Aller et al., 1992), a study by Torniainen et al. (2007) revealed flux variations greater than a factor of 6 at some radio frequencies, and led the authors to not confirm the true GPS nature of the source. The radio source is associated with a narrow emission line galaxy at z=0.66847 with R=22.0 mag (Stanghellini et al., 1993; Stickel et al., 1996a; Carilli et al., 1998), and is located (in projection) within (3.4 kpc) of the galactic center. Optical images of the host reveal a very red, diffuse, and slightly asymmetric galaxy (perhaps a face-on spiral), although the faintness of the galaxy makes the classification difficult (Stanghellini et al., 1993). There is no evidence for a strong point-source contribution in the R-band image. The I-band image is more compact, leading Stanghellini et al. (1993) to propose an increased contribution from the active nucleus in the NIR, possibly indicating the existence of nuclear obscuration toward the AGN in IERS B0108+388. Variability in the near IR, with a very red observed color () during an IR maximum, was revealed by Stickel et al. (1996a).
By means of the relation, Wu (2009b) estimated a BH mass of .
In the X-ray band, the source was detected for the first time by XMM-Newton in 2004 (Vink et al., 2006), with a luminosity of erg s. The source counts were not sufficient to independently estimate, in the fitting procedure, spectral index and column density . By fixing , cmwas obtained.
The detection of a strong Hi 21-cm absorption line, with a width of 100 km sand optical depth , yields a neutral hydrogen column density cm, under the standard assumption of K and (Carilli et al., 1998). VLBI opacity maps recently allowed to prove that the mechanism responsible for the turnover of the radio spectrum is SSA in the core, whereas in the lobes FFA by ionized gas with a temperature K (Marr et al., 2001).
A.2.1 References for spectrum and SED of Fig. 1
A.3. IERS B0500+019 (PKS 0500+019; OG +003)
Observed in the radio band since the 1970’s, and well known as a convex-spectrum radio source (e.g., Jauncey et al., 1970), this very powerful ( W Hz-1) object was classified as a GPS source by O’Dea et al. (1991). The GPS nature of the source was recently confirmed, on the basis of flux variability and spectral shape, by Torniainen et al. (2007). VLBI, VLBA and VSOP images show a radio structure displaying a symmetric, S-shaped morphology, as other GPS sources do, dominated by components similar to jets and/or micro-lobes, with the possible presence of a weak core, and with the northern part brighter than the southern part (Stanghellini et al., 1997, 2001; Fey & Charlot, 2000; Fomalont et al., 2000). The total extension of the radio sources is 15 mas (96 pc). The total fractional polarization is below 0.1% at 5 GHz (Stanghellini et al., 1998), although polarized emission at the level is detected in the brightest component (Stanghellini et al., 2001).
The optical host of the radio source was the subject of a long debate: originally identified with an unresolved QSO lying 2′′ north of a galaxy with and with extremely red optical spectrum (, with ; Fugmann et al., 1988; Fugmann & Meisenheimer, 1988), it was subsequently associated with the southern, asymmetric galaxy, with total magnitude and dominated by a strong point-like source in the NIR band (Stickel et al., 1996a). Because this galaxy is part of an apparent group of more than 10 galaxies, the observed asymmetry might be generated by gravitational interactions with companion objects (Stickel et al., 1996b). The galaxy produces moderate-ionization narrow emission lines (Stickel et al., 1996b), and is located at (de Vries et al., 1995). Based on the detection of a further, unidentified emission line, Stickel et al. (1996b) proposed that a background, reddened quasar is strongly aligned with the foreground galaxy. This scenario, however, was not confirmed by subsequent observations by de Vries et al. (1998a, b, 2000). Besides confirming the galaxy at to be the host of the radio source, these authors revealed a degree of source nucleation much higher in the K band than in the J and H bands, contrary to the behavior of both the GPS sources of the same redshift and the FRIIs with the same degree of J-band nucleation; this led the authors to suggest that the very red color of the nucleus is produced by an absorption excess in the host galaxy. Jackson et al. (2002) too identified the host as a narrow-line radio galaxy, providing a revised redshift of (Hook et al., 2003).
Whereas the radio emission of the source is fairly stable (Stanghellini et al., 1997; Torniainen et al., 2007), moderate variability was detected in both the optical and NIR bands (Stickel et al., 1996a).
The source is also a MFIR emitter: we detected it in the field of an archival Spitzer/MIPS calibration observation at 24 m (see Section 3, and Appendix B for details).
In the X-ray regime, the Einstein Observatory observed the source in 1980, yielding however only a flux upper limit in the keV energy range (Ledden & O’Dell, 1983).
The source was successfully detected by ROSAT during the RASS as well as in two pointed observations in 1993: although a unique spectral fit was not possible due to the paucity of low-energy counts, the spectrum was found to be consistent with either a significant excess absorption or a hard slope, even though thermal spectral models (however with poorly constrained temperature) could not be ruled out (Kollgaard et al., 1995, and refs. therein). The source spectrum was better determined through the XMM-Newton observations in 2004 (Guainazzi et al., 2006): with a keV luminosity of erg s, the source spectrum was well fitted with a slope and cm.
An independent estimate of the column density of neutral hydrogen comes from the measurements of the redshifted 21-cm absorption lines, yielding cm (Carilli et al., 1998). Based on the standard assumption of K and , yielding cm, Guainazzi et al. (2006) conclude that a difference of a factor 10 between and supports a source scenario in which the absorbed X-rays come from a region located well within the lobe radio hotspots, completely X-ray silent. Assuming a non-thermal radio-to-optical quasar spectrum for the source, Carilli et al. (1998) derived, from the difference between the optical data and the extrapolation of the radio-to-infrared spectrum into the optical band, a lower limit to the rest-frame visual extinction, , implying K, and thus cm. This limit would be largely consistent with the above-mentioned value provided by the X-ray data analysis.
A.3.1 References for spectrum and SED of Fig. 1
A.4. IERS B0710+439 (COINS J0713+4349; OI +417)
This source is a well known CSO (Taylor et al., 1996), with radio power W Hz-1. The flux density is very weakly polarised ( at 5 GHz), and the observed variations of the flux are not statistically significant (Aller et al., 1992; Torniainen et al., 2007). The known GPS nature of the source was recently confirmed, on the basis of flux variability and spectral properties, by Torniainen et al. (2007).
The total angular size of the source is 24.1 mas (Owsianik et al., 1998), which corresponds to a projected linear size of 145 pc. VLBI maps at several frequencies (1.6, 5, 10.7, and 15 GHz) showed the overall triple structure of the source. Despite having three components, this source was provisionally classified as a compact double, based on the fact that more than 80% of the emission came from two almost equally bright components (Pearson & Readhead, 1988). Conway et al. (1992) argued that the two outer components were hotspots and minilobes, whereas the centre of activity was associated with the middle component, based on its compactness, spectrum and weak flux density variability. However, more recent multi-frequency observations reveal a compact component with a strongly inverted spectrum at the southern end of the middle component, suggesting that the true centre of activity lies there (Taylor et al., 1996).
Readhead et al. (1996) gives age estimates of 1200-1800 yr based on synchrotron ageing, and 1500-7500 yrs from energy supply arguments; more recently, the first detection of hotspot advance velocities in a CSO was measured in this source by Owsianik & Conway (1998); these measurements, together with those by Polatidis & Conway (2003), yielded an age smaller than 1000 yr.
In the optical band, IERS B0710+439 has been identified with a galaxy (Peacock & Wall, 1981) of magnitude (Peacock & Wall, 1981). The galaxy displays a very irregular morphology, with large differences in the two bands, and has a very red color (; Stanghellini et al., 1993). There is evidence of strong interaction, and presence of a large amount of obscuring matter. The numerous objects around the source suggest that 0710+439 is the dominant galaxy of a cluster of galaxies (Stanghellini et al., 1993). The emission-line redshift of the galaxy is z=0.518 (Lawrence et al., 1996); the optical spectrum shows absorption lines characteristic of an evolved stellar population, and an optical continuum shape typical of an elliptical galaxy without any evidence for a non-stellar component.
By means of the relation, Wu (2009b) estimated a BH mass of .
At high energies, the source was detected as an X-ray emitter by XMM-Newton in 2004 (Vink et al., 2006). Its keV luminosity is erg s, and the spectral analysis yielded a slope for the energy spectrum, and a source-intrinsic column density cm.
A.4.1 References for spectrum and SED of Fig. 1
A.5. PKS B0941-080
The source has a radio power W Hz-1, and an overall size of 50 mas ( 177 pc) (O’Dea, 1998). Imaging with the VLA shows a slightly resolved secondary component 20′′ (71 kpc) east of the main one (Stanghellini et al., 1998). The VLBI morphology of the main component is that of a compact double (Dallacasa et al., 1998) typical of many CSS/GPS radio galaxies. The source was classified as a GPS source (O’Dea, 1998, and references therein), although recent investigation by Torniainen et al. (2007) did not confirm the GPS-source classification, indicating the object as a steep-spectrum source.
Ground-based optical-NIR observations showed the host galaxy of the main radio source as an elliptical envelope, with magnitude and color , including two cores (Stanghellini et al., 1993). HST-NICMOS (JK) imaging revealed that the system is actually composed of two galaxies, interacting with each other, and characterized by blue nuclei (de Vries et al., 2000). The GPS source is associated with the core of the northern, larger, and brighter galaxy (Stanghellini et al., 1993; de Vries et al., 2000). The prominent emission line spectrum allows one to derive, from seven identified spectral features, a redshift .
By means of the relation, Wu (2009a) recently estimated a central BH mass of .
In the X-ray regime, the source was pointed at by Chandra in 2002 (Guainazzi et al., 2006; Siemiginowska et al., 2008): the target was detected, and subsequent, independent analyses first failed in determining a significant spectral fit (Guainazzi et al., 2006) (fixed ; undetermined), and then derived a steep-spectrum source () not absorbed by any excess hydrogen column (Siemiginowska et al., 2008). The latter analysis also reported the detection of the eastern source component revealed by the VLA, although with very low source counts. The 2–10 keV X-ray luminosity of PKS B0941-080 is the lowest of our GPS-galaxy sample ( erg s; Guainazzi et al., 2006).
A.5.1 References for spectrum and SED of Fig. 1
A.6. IERS B1031+567 (COINS J1035+5628; OL +553)
This source, with radio power W Hz-1, is a known GPS source (O’Dea, 1998, and references therein), and was also included in the sample of bona-fide GPS sources assembled by Torniainen et al. (2007).
The source was found to have a compact double morphology in 5 GHz observations by Pearson & Readhead (Taylor et al., 1996). VLBA observations at 8.4 and 15.4 GHz showed the source to be dominated by two leading edge-brightened, steep-spectrum components (Taylor et al., 1996), proposed by the authors to be the working surfaces and lobes of two oppositely directed jets. Based on these data, the authors concluded that the source was likely to be a CSO, with the center of the activity located in the source center. The CSO morphology was later confirmed by VSOP observations (Fomalont et al., 2000). The overall source size is 40 mas (224 pc).
Measurements of the hotspot separation velocity, based however only on two epochs, yield estimates of 600–1800 yr (Taylor et al., 2000; Polatidis & Conway, 2003).
In the optical band, the source is identified with an elliptical-like galaxy with magnitude , showing a possible asymmetric morphology at low brightness levels; the presence of weak resolved objects in the field suggest that this galaxy is the dominant member of a galaxy cluster.
By means of the relation, Wu (2009b) estimated a BH mass of .
In the X-ray band, the source was detected for the first time in 2004 by XMM-Newton (Vink et al., 2006), with a keV luminosity of erg s. The source counts were not sufficient to independently estimate, in the fitting procedure, spectral index and column density . By fixing , cmwas obtained.
A.6.1 References for spectrum and SED of Fig. 1
A.7. IERS B1345+125 (PKS 1345+12; 4C +12.50)
This is a luminous, compact (170 pc) radio source hosted by an elliptical-like galaxy at , classified as an ultra-luminous infrared galaxy (ULIRG).
The main host-galaxy body displays the same shape from NIR to near-UV wavelengths, is 15′′ (32 kpc) wide and rather asymmetric, and appears to be associated with a group of 15 fainter nebulous objects, many of which are located very close to its distorted halo (Heckman et al., 1986). Ground-based and HST observations clearly reveal two nuclei separated by 1.8′′ (3.8 kpc) embedded in a common, distorted envelope, including a strongly curved tidal tail (e.g., Gilmore & Shaw, 1986; Heckman et al., 1986; Smith & Heckman, 1989; Labiano et al., 2008).
The consistency of the inner () NIR brightness profile with that of a merger remnant, and the little evidence of extinction, indicative of ISM stripping, in the very central region (Shaw et al., 1992), together with the detection of a rich young stellar population (YSP) (Zaurín et al., 2007), confirmed that this complex has a merger origin, as firstly proposed by Gilmore & Shaw (1986) to explain the double nucleus and the asymmetry of the large-scale structure.
The south-eastern (SE) nucleus is believed to belong to an elliptical galaxy (Gilmore & Shaw, 1986), and its NIR color is consistent with reddened starlight (Evans et al., 1999). The north-western (NW) nucleus displays a narrow-line Seyfert-2 optical spectrum (Gilmore & Shaw, 1986), although the presence of a buried quasar is suggested by the detection of NIR broad Pa lines (Veilleux et al., 1997, 1999), by the similarity of the extreme NIR color with that of quasars with a warm (5001000 K) dust component (Evans et al., 1999; Surace & Sanders, 1999), and by the highly-polarized UV emission (Hurt et al., 1999); stellar velocity dispersion derived from NIR VLT spectra indicate the presence of a BH (Dasyra et al., 2006).
The source, detected by IRAS and ISO as a bright MFIR emitter (Golombek et al., 1988; Fanti et al., 2000), was recently observed in the MFIR domain by Spitzer, with both IRAC and MIPS (see Section 3, and Appendix B for details).
Although the optical counterpart of the radio source was originally identified with the SE nucleus (Gilmore & Shaw, 1986), newer astrometry led to the association of the radio activity to the NW nucleus (Stanghellini et al., 1993; Evans et al., 1999; Axon et al., 2000; Batcheldor et al., 2007). The latter identification is adopted throughout this paper.
The powerful ( W Hz-1; O’Dea, 1998) radio source is resolved neither by MERLIN (at 18 cm) nor by VLA (at 6 and 2 cm) observations by Spencer et al. (1989), which constrained the (projected) linear size to ( pc). VLBI images at 5 GHz show a single jet disrupting at 30 mas (60 pc) south of the core, and then expanding in a diffuse 40-mas-sized lobe reaching a distance of 80 mas (170 pc) from the core (Stanghellini et al., 1997; Shaw et al., 1992). The puzzling lack of any counter-lobe at these frequencies (Stanghellini et al., 1997, 2001), together with the observation of highly-polarized components and superluminal motion (Lister et al., 2003) make the source an unusual example of CSO. A more symmetric structure is however detected by the VLBI at lower frequencies ( MHz), where a fainter counter-jet/lobe extending toward the North for 40 mas can be identified (Morganti et al., 2004b). The radio structure is misaligned by 45 with respect to the UV light distribution (Axon et al., 2000).
The source was shown to be non-variable at 318 and 430 MHz over a 14-year period of flux-density monitoring with the Arecibo telescope (Salgado et al., 1999). Although classified as a GPS source (O’Dea, 1998, and references therein), a recent study by Torniainen et al. (2007) did not confirm the GPS nature of the object, classifying the source as a steep-spectrum source.
In the X-ray domain, IERS B1345+125 was first revealed by ASCA (2–10 keV) in 1996 (O’Dea et al., 2000), after a previous non-detection by ROSAT (0.2–2 keV; O’Dea et al., 1996), and was the first GPS source to be reported as an X-ray emitter. The ASCA image does not resolve the two nuclei. However, a comparison of the X-ray power with the H emission-line luminosity makes O’Dea et al. (2000) conclude that the X rays come from the western nucleus, associated with the GPS source. Highly uncertain spectral index () and column density ( cm) are derived from the modeling of these X-ray data. Higher-quality X-ray data were obtained in 2000 with Chandra (Siemiginowska et al., 2008), which also revealed the presence of extended emission on 10 arcsec (20 kpc) scale.
The detection of CO(10) emission implies a mass of molecular hydrogen (Mirabel et al., 1989; Evans et al., 1999), concentrated in the central 2 kpc of the galaxy.
Hi absorption was detected against the radio source by Mirabel (1989), showing a narrower (FWHM200 kms) and a broader (FWHM700 kms) component, and implying an average = cm. More recent measurements by Morganti et al. (2004a, b) revealed a much wider (2000 kms) broad line, blueshifted with respect to the systemic velocity of the galaxy. Morganti et al. (2004b) also assessed, thanks to the spatial resolution of the VLBI, the actual location of the Hi absorber, showing that a single Hi cloud of (projected) size pc, with mass , column density cm, and located at the edge of the northern jet/lobe (projected distance of 40–100 pc from the core), can account for the whole unresolved Hi absorption. This would prove the clumpy nature of the ISM in the nuclear region of this source, making the scenario of a strong jet-cloud interaction a viable interpretation of the observations of not only this galaxy, but also of other young radio sources (Morganti et al., 2004b). Holt et al. (2003) found complex optical emission line profiles at the position of the nucleus with line width of 2000 kmsand blueshifted with respect to the narrow HI absorption component.
Whether the GPS source is truly young is still a matter of debate. A model-dependent estimate by O’Dea et al. (2000) implies the source to be younger than yr. However, Zaurín et al. (2007) find no clear evidence of a time delay of the AGN activity with respect to the major merger-induced starburst (6 Myr ago); this would also be in agreement with the apparent connection between the extended (100 kpc; Stanghellini et al., 2005) and compact radio emission, indicating recursive AGN activity on a time-scale longer than previously thought. Lister et al. (2003) speculate the existence of a precessing BH to explain the S-shaped jet; if confirmed, this would point to an age of the radio source 105 yr.
A.7.1 References for spectrum and SED of Fig. 1
A.8. IVS B1358+624 (COINS J1400+6210; 4C +62.22)
This source has radio power W Hz-1; it is one of the 11 low-frequency variable sources mapped with global VLBI at 608 MHz by Padrielli et al. (1991), who showed the object to be a compact double separated by 46 mas with a possible bridge of emission. Dallacasa et al. (1995) confirm that the two lobes are connected by a knotty, broad jet; Taylor et al. (1996) provide new evidence of the source structure: they resolve the two lobes, and detect a long, one-sided jet with a faint, compact component at the base; based on the compactness of the component, on its inverted spectrum, and on its location, the authors confirmed the source to be a member of the CSO class, with the central component being the center of the activity. No evidence of hotspots on either sides of the central engine was found (Taylor et al., 1996). The overall source size is 70 mas (380 pc).
The convex, stable, and GHz-peaked spectrum enabled the classification of the source as a GPS source (O’Dea, 1998; Torniainen et al., 2007).
An optical image of this source (Stanghellini et al., 1993) shows that the host is a galaxy of mag with a blue color () and a boxy morphology; there is evidence of obscuring material in a direction (NE-SW) roughly perpendicular to the VLBI axis, but on larger scale (Dallacasa et al., 1995).
In the X-ray band, XMM-Newton detected the source in 2004 as an X-ray emitter with keV luminosity of erg s(Vink et al., 2006). The fitting procedure yielded a spectral index and a total-hydrogen column density cm.
By means of the relation, Wu (2009b) estimated a BH mass of .
An independent estimate of the amount of neutral hydrogen comes from the 21-cm observations by Vermeulen et al. (2003), who detected a column density cm, under the usual assumption of K and uniformly covered source.
A.8.1 References for spectrum and SED of Fig. 1
A.9. IERS B1404+286 (MRK 0668; OQ +208)
Observed in the radio band since the 1970’s, this compact radio source is one of the closest bright ( W Hz-1) GPS galaxies. Its radio spectrum is convex, stable, and GHz-peaked, and the classification of the object as a GPS source (O’Dea, 1998) was confirmed also by Torniainen et al. (2007).
The radio source displays a CSO morphology (Stanghellini et al., 2002): it has a weak core at 15 GHz, two-sided faint and short jets, and two mini-lobes located 10 mas apart, giving a projected size of less than 10 pc. The two micro hot-spots of this radio source seem to increase their distance at a rate of about , comparable to what already found in other CSOs, yielding a kinematical age of a few centuries (Stanghellini et al., 2002).
Based on VSOP observations, Kameno et al. (2000) reported a very inverted spectrum below the peak frequency of the weaker SW region of this source. They considered the extremely inverted spectrum inconsistent with SSA, and propose a process of FFA to explain the radio spectral shape. Xiang et al. (2002) confirmed the incompatibility of the spectrum with pure SSA result, on the basis of ground-based VLBI observations.
The host galaxy of the radio source, located at , has and color ; companions in the galactic envelope, and a tail of low brightness emission in N-S direction, suggest that the galaxy is dynamically disturbed (Stanghellini et al., 1993). The optical spectrum is that of a Seyfert 1; however, given the power of the associated radio source, it was classified as a broad line radio galaxy (e.g., Stanghellini et al., 1997, and references therein).
IRAS detected IERS B1404+286 as a bright MFIR emitter (Golombek et al., 1988); recently, the target was re-observed in the MFIR domain by Spitzer, with both IRAC and MIPS (see Section 3, and Appendix B for details).
By means of the relation, Wu (2009b) estimated a central BH mass of .
In the X-ray domain, the source was observed by ASCA and subsequently by XMM-Newton (Guainazzi et al., 2004, and references therein): it displayed the typical features of obscured AGN, despite the optical classification as a Seyfert 1; the detection of a prominent iron emission line strongly suggested a Compton-reflection scenario for the X-ray emission, but the spectrum could be satisfactorily fitted by several different models, and a contribution from upscattered IR radiation off the lobes could not be ruled out by the authors. Depending on the assumed model for the X-ray spectrum, the luminosity of the source in the 2–10 keV range varies from erg sto erg s.
A.9.1 References for spectrum and SED of Fig. 1
A.10. IERS B2128+048 (PKS 2127+04; OX +046)
This is the most radio powerful source of our sample, with W Hz-1. Early VLBI observations at 18 cm were made by Hodges et al. (1984): they found the radio source composed of two resolved components separated by 29 mas (225 pc). More recent VLBI mapping at 6 cm by Stanghellini et al. (1997) revealed a radio emission extending for 35 mas in NW-SE direction, with the typical scaled-down structure of a Classical Double. At the edges, there are two hotspots/lobes; the central, weak component is assumed to be the core; a jet connects the core to the northern lobe. At 15 GHz, the VLBA image shows an aligned structure with four main components, the outer of which are more resolved than the inner ones, although the southernmost is rather weak (Stanghellini et al., 2001): based on morphology, the source is classified as a CSO, with the hotspots being associated with the outer components.
The source integrated radio spectrum is convex, fairly stable, and GHz-peaked, and the classification of the object as a GPS source (O’Dea, 1998, and references therein) was confirmed also recently by Torniainen et al. (2007).
The optical counterpart of this radio source is a very faint () and red () galaxy (Biretta et al., 1985; de Vries et al., 2000), located at (Stickel et al., 1994). The redness of the spectrum is confirmed by de Vries et al. (2000), who also reported the remarkable brightness in the NIR K band.
By means of the relation, Wu (2009b) estimated a mass of for the central BH.
In the X-ray regime, the source was pointed at by Einstein in 1979 (Ledden & O’Dell, 1983), but the low photon counts only enabled the estimate of an upper limit to its flux in the 0.23-3.77 keV band. The source was then successfully observed by Chandra in 2002 (Guainazzi et al., 2006; Siemiginowska et al., 2008) with a 2-10 keV luminosity of erg s; the data spectral fit gave a slope and a column density = cm.
A.10.1 References for spectrum and SED of Fig. 1
A.11. IERS B2352+495 (COINS J2355+4950; OZ +488)
This radio galaxy has a radio power W Hz-1. It was imaged at 4.99 GHz by Pearson & Readhead (1988) and Conway et al. (1992), who reported on a complex structure surrounding a compact core: two distinct components were found, one with a simple structure, and the other with a complex structure. Imaging at 1.67 GHz by Wilkinson et al. (1994) also showed a two-sided morphology, which led the authors to classify the source as a CSO. No radio structure on scales larger than (7 kpc) has been detected for this source (Perley, 1982). Consistently with Pearson & Readhead (1988) and Conway et al. (1992), VLBI imaging at 4.99 GHz by Fey et al. (1996) confirmed the complexity of the source structure, revealing multiple components dominated by a compact core, a region of 2 mas (7 pc); two components within the central core, with flux ratio 2:1, contain 75% of the total flux density at 4.99 GHz.
The source exhibits weak variability (15%) on time scales of a few months (Seielstad et al., 1983) and 0.2%-0.7% polarization at 5 GHz (Perley, 1982) The radio spectrum is convex and GHz-peaked, and the object’s classification as a GPS source (O’Dea, 1998) was confirmed also by Torniainen et al. (2007).
The source is hosted by a galaxy with redshift (O’Dea et al., 1991). In the NIR band, the source is one of the few displaying a higher nucleation (lower extended emission) in the J band than in the H and K bands (de Vries et al., 1998a).
Wu (2009a) and Wu (2009b) recently estimated a central BH mass of and by means of the and , respectively.
IERS B2352+495 was firstly observed in the X-rays by ROSAT and ASCA, being detected by neither of them (O’Dea et al., 2000). Observations by XMM-Newton in 2004 did reveal the source as a keV emitter with a moderate luminosity of erg s(Vink et al., 2006) . The photon statistics was not good enough to independently estimate spectral index and column density . By fixing , cmwas obtained.
A search for 21-cm absorption successfully detected two features, yielding of 0.28 cmand 2.56 cm(Vermeulen et al., 2003), assuming K and unitary covering factor. Recently, Araya et al. (2010) performed high angular resolution Hi measurements of the source, detected the two above absorption features against the radio jet, and associated the broader of them with a circumnuclear gas cloud.
A.11.1 References for spectrum and SED of Fig. 1
Appendix B ANALYSIS OF THE SPITZER DATA
B.1. Analysis of the IRAC data
We analysed the IRAC archival data of IERS B1345+125 and IERS B1404+286 in the following way. The pipeline calibrated BCD files were recombined with MOPEX rebinned to 1/5th the native pixel size of 1.2′′ in an attempt to separate out contribution from surrounding diffuse emission seen in higher resolution NIR images. The smallest practical aperture () was used to extract fluxes most indicative of the central point source, with aperture corrections applied. An uncertainty of roughly 3 in the absolute calibration (Reach et al., 2005) was added in quadrature with measurements of the uncertainties due to background fluctuations and the Poisson noise.
Special care was taken for a proper background evaluation. In the case of IERS B1404+286, in order to avoid the diffraction spike from a nearby point source 83′′ to the SW of the GPS source, half of an annulus was used to measure the background. In the case of IERS B1345+125, due to obvious contamination from field sources, the background was estimated from circular apertures in source-free regions.
To quantify contributions from extended emission surrounding the point source in the IRAC images, corresponding fluxes in a larger () aperture were measured. In IERS B1345+125, this formally resulted in 30, 16, 6, and 6 larger fluxes than those in the original aperture at 3.6, 4.5, 5.8, and 8.0 m, respectively. This confirmed the presence of diffuse emission surrounding the point source (already noticeable by eye) in the two shortest wavelength (highest-resolution) bands, but we consider any similar evidence in the longer wavelength images to be marginal at best due to the large aperture corrections () applied to the small aperture fluxes.
A similar test of IERS B1404+286 hints at an additional (5) extended flux in the 3.6 m image, but the contribution is in the other images.
B.2. Analysis of the MIPS data
We analysed the MIPS archival data of IERS B1345+125, IERS B1404+286, and IERS B0500+019 as follows.
Using a standard () circular aperture and a background annulus of 40′′–50′′ (40′′–60′′) for the 24 m (70 m) image, we measured aperture-corrected source fluxes on the pipeline calibrated PBCD mosaic images. The flux conversion utilized the latest (S18)666http://ssc.spitzer.caltech.edu/mips/calib/conversion.html conversion factors of 0.0454 and 702 MJy/sr per instrument unit, with absolute uncertainties of 4 and 7, respectively. As in the IRAC data, these systematic uncertainties were added in quadrature with the background and counting noise. Additionally, the aforementioned point source 83′′ from IERS B1404+286 is unresolved from the GPS source in the lower resolution IRAS images, so presumably contaminates the older measurements (we measured 117 5 mJy at 24 m).
References
- Abdo et al. (2010) Abdo, A. A., et al. 2010, ApJS, submitted (arXiv:1002.2280)
- Atwood et al. (2009) Atwood, W. B., et al. 2009, ApJ, 697, 1071
- Alexander (2000) Alexander, P. 2000, MNRAS, 319, 8
- Allen (1973) Allen, C. W. 1973, London: University of London, Athlone Press, —c1973, 3rd ed.,
- Aller et al. (1992) Aller, M. F., Aller, H. D., & Hughes, P. A. 1992, ApJ, 399, 16
- Amato et al. (2006) Amato, E., & Arons, J. 2006, ApJ, 653, 325
- Araya et al. (2010) Araya, E. D., Rodríguez, C., Pihlström, Y., Taylor, G. B., Tremblay, S., & Vermeulen, R. C. 2010, AJ, 139, 17
- Axon et al. (2000) Axon, D. J., Capetti, A., Fanti, R., Morganti, R., Robinson, A., & Spencer, R. 2000, AJ, 120, 2284
- Batcheldor et al. (2007) Batcheldor, D., Tadhunter, C., Holt, J., Morganti, R., O’Dea, C. P., Axon, D. J., & Koekemoer, A. 2007, ApJ, 661, 70
- Baum & Heckman (1989) Baum, S. A., & Heckman, T. 1989, ApJ, 336, 702
- Baum et al. (1990) Baum, S. A., O’Dea, C. P., Murphy, D. W., & de Bruyn, A. G. 1990, A&A, 232, 19
- Begelman (1999) Begelman, M. C. 1999, in The Most Distant Radio Galaxies, eds. H.J.A. Röttgering, P.N. Best, M.D. Lehnert (Amsterdam Royal Netherlands Acad. Arts and Sciences), 173
- Begelman & Cioffi (1989) Begelman, M. C., & Cioffi, D. F. 1989, ApJ, 345, L21
- Beichman et al. (1981) Beichman, C. A., Neugebauer, G., Soifer, B. T., Matthews, K., Wootten, H. A., & Pravdo, S. H. 1981, ApJ, 247, 780
- Bessel (1979) Bessel, M. S. 1979, PASP, 91, 589
- Best (2009) Best, P. N. 2009, AN, 330, 184
- Bicknell et al. (1997) Bicknell, G. V., Dopita, M. A., & O’Dea, C. P. O. 1997, ApJ, 485, 112
- Biretta et al. (1985) Biretta, J. A., Schneider, D. P., Gunn J. E. 1985, AJ, 90, 2508
- Bradley et al. (2004) Bradley, L. D., Kaiser, M. E., & Baan, W. A. 2004, ApJ, 603, 463
- Bregman et al. (1985) Bregman, J. N., Glassgold, A. E., Huggins, P., J., & Kinney, A. L. 1985, ApJ, 291, 505
- Brinkmann et al. (1995) Brinkmann, W., Siebert, J., Reich, W., Fürst, E., Reich, P., Voges, W., Trümper, J., & Wielebinski, R. 1995, A&AS, 109, 147
- Brinkmann et al. (1997) Brinkmann, W., Yuan, W., & Siebert, J. 1997, A&A, 319, 413
- Cao (2009) Cao, X. 2009, MNRAS, 394, 207
- Cardelli et al. (1989) Cardelli, J. A., Clayton, C., & Mathis, J. S. 1989, ApJ, 345, 245
- Carilli et al. (1998) Carilli, C. L., Menten, K. M., Reid, M. J., Rupen, M. P., & Yun, M. S. 1998, ApJ, 494, 175
- Celotti & Ghisellini (2008) Celotti, A., & Ghisellini, G. 2008, MNRAS, 385, 283
- Chiaberge et al. (2009) Chiaberge, M., Tremblay, G., Capetti, A., Macchetto, F. D., Tozzi, P., & Sparks, W. B. 2009, ApJ, 696, 1103
- Conway & Blanco (1995) Conway, J. E., & Blanco, P. R. 1995, ApJ, 449, L131
- Conway et al. (1994) Conway, J. E., Myers, S. T., Pearson, T. J., Readhead, A. C. S., Unwin, S. C., & Xu, W. 1994, ApJ, 425, 56
- Conway et al. (1992) Conway, J. E., Pearson, T. J., Readhead, A. C. S., Unwin, S. C., Xu, W., & Mutel, R. L. 1992, ApJ, 396, 62
- Czerny et al. (2009) Czerny, B., Siemiginowska, A., Janiuk, A., Nikiel-Wroczynski, B., & Stawarz, Ł. 2009, ApJ, 698, 840
- Dallacasa et al. (1998) Dallacasa, D., Bondi, M., Alef, W., & Mantovani, F. 1998, A&AS, 129, 219
- Dallacasa et al. (1995) Dallacasa, D., Fanti, C., Fanti, R., Schilizzi, R. T., & Spencer, R. E. 1995, A&A, 295, 27
- Dallacasa et al. (2000) Dallacasa, D., Stanghellini, C., Centonza, M., & Fanti, R. 2000, A&A, 363, 887
- Dasyra et al. (2006) Dasyra, K. M., et al. 2006, ApJ, 638, 745
- Davies & Cummings (1975) Davies, R. D., & Cummings, E. R. 1975, MNRAS, 170, 95
- de Vries (2003) de Vries, W. H. 2003, PASA, 20, 6
- de Vries et al. (1995) de Vries, W. H., Barthel, P. D., & Hes, R. 1995, A&AS, 114, 259
- de Vries et al. (1997) de Vries, W. H., Barthel, P. D., & O’Dea, C. P. 1997, A&A, 321, 105
- de Vries et al. (1998a) de Vries, W. H., O’Dea, C. P., Perlman, E., Baum, S. A., Lehnert, M. D., Stocke, J., Rector, T., & Elston, R. 1998a, ApJ, 503, 138
- de Vries et al. (1998b) de Vries, W. H., O’Dea, C. P., Baum, S. A., Perlman, E., Lehnert, M. D., & Barthel, P. D. 1998b, ApJ, 503, 156
- de Vries et al. (2000) de Vries, W. H., O’Dea, C. P., Barthel, P. D., & Thompson, D. J. 2000, A&A, 143, 181
- de Vries et al. (2007) de Vries, N., Snellen, I. A. G., Schilizzi, R. T., Lehnert, M. D., & Bremer, M. N. 2007, A&A, 464, 879
- de Vries et al. (2009) de Vries, N., Snellen, I. A. G., Schilizzi, R. T., Mack, K.-H., & Kaiser, C. R. 2009, A&A, 498, 641
- Evans et al. (1999) Evans, A. S., Kim, D. C., Mazzarella, J. M., Scoville, N. Z., & Sanders, D. B. 1999, ApJ, 521, L107
- Evans et al. (2006) Evans, A., Armus, L., Hines, D., Lim, J., Mazzarella, J., Surace, J., & Vavilkin, T. 2006, Spitzer Proposal ID #30877
- Fanti et al. (1995) Fanti, C., Fanti, R., Dallacasa, D., Schilizzi, R. T., Spencer, R. E., & Stanghellini, C. 1995, A&A, 302, 317
- Fanti et al. (2000) Fanti, C., et al. 2000, A&A, 358, 499
- Fazio & Wang (2004) Fazio, G., & Wang, Z. 2004, Spitzer Proposal ID #32
- Fazio et al. (2004) Fazio, G. G., et al. 2004, ApJS, 154, 10
- Fey & Charlot (2000) Fey, A. L., & Charlot, P. 2000, ApJS, 128, 17
- Fey et al. (1996) Fey, A. L., Clegg, A. W., & Fiedler, R. L. 1996, ApJ, 468, 543
- Fomalont et al. (2000) Fomalont, E. B., Frey, S., Paragi, Z., Gurvits, L. I., Scott, W. K., Taylor, A. R., Edwards, P. G., & Hirabayashi, H. 2000, ApJS, 131, 95
- Freedman et al. (2001) Freedman, W. L., et al. 2001, ApJ, 553, 47
- Fugmann & Meisenheimer (1988) Fugmann, W., & Meisenheimer, K. 1988, A&AS, 76, 145
- Fugmann et al. (1988) Fugmann, W., Meisenheimer, K., & Röser, H.-J. 1988, A&AS, 75, 173
- Gallimore et al. (1999) Gallimore, J. F., Baum, S. A., O’Dea, C. P., Pedlar, A., & Brinks, E. 1999, ApJ, 524, 684
- García-Burillo et al. (2007) García-Burillo, S., Combes, F., Neri, R., Fuente, A., Usero, A., Leon, S., & Lim, J. 2007, A&A, 468, L71
- Ghisellini et al. (2009) Ghisellini, G., Tavecchio, F., & Ghirlanda, G. 2009, MNRAS, in press
- Gilmore & Shaw (1986) Gilmore, G., & Shaw, M.A. 1986, Nature, 321, 750
- Giroletti et al. (2005) Giroletti, M., Giovannini, G., & Taylor, G. B. 2005, A&A, 441, 89
- Godfrey et al. (2009) Godfrey, L. E. H., et al. 2009, ApJ, 695, 707
- Golombek et al. (1988) Golombek, D., Miley, G. K., & Neugebauer, G. 1988, AJ, 95, 26
- Guainazzi et al. (2004) Guainazzi, M., Siemiginowska, A., Rodriguez-Pascual, P., & Stanghellini, C. 2004, A&A, 421, 461
- Guainazzi et al. (2006) Guainazzi, M., Siemiginowska, A., Stanghellini, C., Grandi, P., Piconcelli, E., & Azubike Ugwoke, C. 2006, A&A, 446, 87
- Gugliucci et al. (2005) Gugliucci, N. E., Taylor, G. B., Peck, A. B., & Giroletti, M. 2005, ApJ, 622, 136
- Gupta et al. (2006) Gupta, N., Salter, C. J., Saikia, D. J., Ghosh, T., & Jeyakumar, S. 2006, MNRAS, 373, 972
- Haas et al. (2004) Haas, M., et al. 2004, A&A, 424, 531
- Heckman et al. (1994) Heckman, T. M., O’Dea, C. P., Baum, S. A., & Laurikainen, E. 1994, ApJ, 428, 65
- Heckman et al. (1986) Heckman, T. M., Smith, E. P., Baum, S. A., van Breugel, W. J. M., Miley, G. K., Illingworth, G. D., Bothun, G. D., & Balick, B. 1986, ApJ, 311, 526
- Heinz et al. (1998) Heinz, S., Reynolds, C. S., & Begelman, M. C. 1998, ApJ, 501, 126
- Hirabayashi et al. (2000) Hirabayashi, H., et al. 2000, PASJ, 52, 997
- Hodges et al. (1984) Hodges, M. W., Mutel, R. L., & Phillips, R. B. 1984, AJ, 89, 1327
- Holt (2009) Holt, J. 2009, AN, 330, 226
- Holt et al. (2003) Holt, J., Tadhunter, C., & Morganti, R. 2003, MNRAS, 342, 227
- Hook et al. (2003) Hook, I. M., Shaver, P. A., Jackson, C. A., Wall, J. V., & Kellermann, K. I. 2003, A&A, 399, 469
- Hoshino et al. (1992) Hoshino, M., Arons, J., Gallant, Y. A., & Langdon, A. B. 1992, ApJ, 390, 454
- Hurt et al. (1999) Hurt, T., Antonucci, R., Cohen, R., Kinney, A., & Krolik, J. 1999, ApJ, 514,579
- Hutchings et al. (1994) Hutchings, J. B., Neff, S. G., Weadock, J., Roberts, L., Ryneveld, S., & Gower, A. C. 1994, AJ, 107, 471
- Isobe et al. (1986) Isobe, T., Feigelson, E.D., & Nelson, P.I. 1986, ApJ, 306, 490
- Jackson et al. (2002) Jackson, C. A., Wall, J. V., Shaver, P. A., Kellermann, K. I., Hook, I. M., & Hawkins, M. R. S. 2002, A&A, 386, 97
- Jauncey et al. (1970) Jauncey, D. L., Niell, A. E., & Condon, J. J. 1970, 162, L31
- Kaiser & Best (2007) Kaiser, C. R., & Best, P. N. 2007, MNRAS, 381, 1548
- Kaiser et al. (2000) Kaiser, C. R., Schoenmakers, A. P., & Röttgering, H. J. A. 2000, MNRAS, 315, 381
- Kameno et al. (2000) Kameno, S., Horiuchi, S., Shen, Z.-Q., Inoue, M., & Kobayashi, H. 2000, PASJ, 52, 209
- Kapahi (1981) Kapahi, V. K. 1981, A&AS, 43, 381
- Kawakatu & Kino (2006) Kawakatu, N., & Kino, M. 2006, MNRAS, 370, 1513
- Kawakatu et al. (2009a) Kawakatu, N., Nagai, H., Kino, M. 2009, AN, 330, 283
- Kawakatu et al. (2009b) Kawakatu, N., Nagao, T., & Woo, J.-H. 2009, ApJ, 693, 1686
- Kellermann et al. (1998) Kellermann, K. I., Vermeulen, R. C., Zensus, J. A., & Cohen, M. H. 1998, AJ, 115, 1295
- Kellermann et al. (2004) Kellermann, K. I., et al. 2004, ApJ, 609, 539
- Knapp et al. (1990) Knapp, G. R., Bies, W. E., & van Gorkom, J. H. 1990, AJ, 99, 476
- Kollgaard et al. (1995) Kollgaard, R. I., Feigelson, E. D., Laurent-Muehleisen, S. A., Spinrad, H., Dey, A., & Brinkmann, W. 1995, ApJ, 449, 61
- Koratkar & Blaes (1999) Koratkar, A., & Blaes, O. 1999, PASP, 111, 1
- Kovalev et al. (1999) Kovalev, Y. Y., Nizhelsky, N. A., Kovalev, Yu. A., Berlin, A. B., Zhekanis, G. V., Mingaliev, M. G., & Bogdantsov, A. V. 1999, A&AS, 139, 545
- Kraemer & Crenshaw (2000) Kraemer, S. B., & Crenshaw, D. M. 2000, ApJ, 544, 763
- Kraemer et al. (2000) Kraemer, S. B., Crenshaw, D. M., Hutchings, J. B., Gull, T. R., Kaiser, M. E., Nelson, C. H., & Weistrop, D. 2000, ApJ, 531, 278
- Krolik (1998) Krolik, J. 1998, Active Galactic Nuclei - From the Central Black Hole to the Galactic Environment (Princeton: Princeton University Press)
- Kühr et al. (1981) Kühr, H., Witzel, A., Pauliny-Toth, I. I. K., & Nauber, U. 1981, A&AS, 45, 367
- Labiano (2008) Labiano, A. 2008, A&A, 488, L59
- Labiano et al. (2008) Labiano, A., O’Dea, C. P., Barthel, P. D., de Vries, W. H., & Baum, S. A. 2008, A&A, 477, 491
- Labiano et al. (2006) Labiano, A., Vermeulen, R. C., Barthel, P. D., O’Dea, C. P., Gallimore, J. F., Baum, S., & de Vries, W. 2006, A&A, 447, 481
- Lara et al. (1999) Lara, L., Márquez, I., Cotton, W. D., Feretti, L., Giovannini, G., Marcaide, J. M., & Venturi, T. 1999, A&A, 348, 699
- La Valley et al. (1992) La Valley, M. P., Isobe, T., & Feigelson, E. D. 1992, BAAS, 24, 839
- Lawrence et al. (1996) Lawrence, C. R., Zucker, J. R., Readhead, A. C. S., Unwin, S. C., Pearson, T. J., & Xu, W. 1996, ApJS, 107, 541
- Ledden & O’Dell (1983) Ledden, J. E., & O’Dell, S. L. 1983, ApJ, 270, 434
- Leipski et al. (2009) Leipski, C., Antonucci, R., Ogle, P., & Whysong, D. 2009, ApJ, 701, 891
- Lister et al. (2003) Lister, M., Kellermann, K. I., Vermeulen, R. C., Cohen, M. H., Zensus, J. A., & Ros, E. 2003, ApJ, 584, 135
- Liszt (2001) Liszt, H. 2001, A&A, 371, 698
- Liu et al. (2000) Liu, X., Stanghellini, C., Dallacasa, D., & Bondi, M. 2000, Chin. Phys. Lett., 17, 307
- Maloney et al. (1994) Maloney, P. R., Begelman, M. C., & Rees, M. J. 1994, ApJ, 432, 606
- Maloney et al. (1996) Maloney, P., Hollenbach, D., & Tielens, A. G. G. M. 1996, ApJ, 466, 561
- Marr et al. (2001) Marr, J. M., Taylor, G. B., & Crawford, F. 2001, ApJ, 550, 160
- Mirabel (1989) Mirabel, I. F. 1989, ApJ, 340, L13
- Mirabel et al. (1989) Mirabel, I. F., Sanders, D. B., & Kazès, I. 1989, ApJ, 340, L9
- Morganti (2008) Morganti, R. 2008, ASPC, 386, 210
- Morganti et al. (2004a) Morganti, R., Oosterloo, T., Emonts, B. H. C., Tadhunter, C. N., & Holt, J. 2004a, in IAUS 217, International Astronomical Union Symposium no. 217, Recycling Intergalactic and Interstellar Matter, ed. P.-A. Duc, J. Braine, & E. Brinks (San Francisco: ASP), 332
- Morganti et al. (2004b) Morganti, R., Oosterloo, T. A., Tadhunter, C. N., Vermeulen, R., Pihlström, Y. M., van Moorsel, G., & Wills, K. A. 2004b, A&A, 424, 119
- Morganti et al. (1997) Morganti, R., Tadhunter, C. N., Dickson, R., & Shaw, M. 1997, A&A, 326, 130
- Murgia et al. (1999) Murgia, M., Fanti, C., Fanti, R., Gregorini, L., Klein, U., Mack, K.-H., & Vigotti, M. 1999, A&A, 345, 769
- Narayan & Yi (1995) Narayan, R. & Yi, I. 1995, ApJ, 444, 231
- O’Dea (1998) O’Dea, C. P. 1998, PASP, 110, 493
- O’Dea & Baum (1997) O’Dea, C. P., & Baum, S. A. 1997, AJ, 113, 148
- O’Dea et al. (1991) O’Dea, C. P., Baum, S., & Stanghellini, C. 1991, ApJ, 380, 66
- O’Dea et al. (1990) O’Dea, C. P., Baum, S. A., Stanghellini, C., Morris, G. B., Patnaik, A. R., & Gopal-Krishna 1990, A&AS, 84, 549
- O’Dea et al. (2000) O’Dea, C. P., de Vries, W. H., Worrall, D. M., Baum, S., & Koekemoer, A. 2000, AJ, 119, 478
- O’Dea et al. (1996) O’Dea, C. P., Worrall, D. M., Baum, S., & Stanghellini, C. 1996, AJ, 111, 92
- Orienti & Dallacasa (2008a) Orienti, M., & Dallacasa, D. 2008a, A&A, 479, 409
- Orienti & Dallacasa (2008b) —. 2008b, A&A, 487, 885
- Ostorero et al. (2009) Ostorero, L., Moderski, R., Stawarz, Ł., Begelman, M.C., Diaferio, A., Kowalska, I., Kataoka, J., & Wagner, S. J. 2009, AN, 330, 275
- Owen & Laing (1989) Owen, F. N., & Laing, R. A. 1989, MNRAS, 238, 357
- Owen & White (1991) Owen, F. N., & White, R. A. 1991, MNRAS, 249, 164
- Owsianik & Conway (1998) Owsianik, I., & Conway, J. E. 1998, A&A, 337, 69
- Owsianik et al. (1998) Owsianik, I., Conway, J. E., & Polatidis, A. G. 1998, A&A, 336, L37
- Padrielli et al. (1991) Padrielli, L., Eastman, W., Gregorini, L., Mantovani, F., & Spangler, S. 1991, A&A, 249, 351
- Parma et al. (2007) Parma, P., Murgia, M., de Ruiter, H. R., Fanti, R., Mack, K.-H., & Govoni, F. 2007, A&A, 470, 875
- Peacock & Wall (1981) Peacock, J. A., & Wall, J. V. 1981, MNRAS, 194,331
- Peacock et al. (1981) Peacock, J. A., Perryman, M. A. C., Longair, M. S., Gunn, J. E.,& Westphal, J. A. 1981, MNRAS, 194, 601
- Pearson & Readhead (1988) Pearson, T. J., & Readhead, A. C. S. 1988, ApJ, 328, 114
- Perley (1982) Perley, R. A. 1982, AJ, 87, 859
- Pihlström et al. (2003) Pihlström, Y. M., Conway, J. E., & Vermeulen, R. C. 2003, A&A, 404, 871
- Press et al. (1992) Press, W. H., Teukolsky, S. A., Vetterling, W. T., & Flannery, B. P. 1992, Numerical recipes in FORTRAN. The art of scientific computing (2nd ed.; Cambridge: Cambridge Univ. Press)
- Polatidis & Conway (2003) Polatidis, A. G., & Conway, J. E. 2003, PASA, 20, 69
- Polletta et al. (2008) Polletta, M., Weedman, D., Höenig, S., Lonsdale, C. J., Smith, H. E., & Houck, J. 2008, ApJ, 675, 960
- Pushkarev et al. (2005) Pushkarev, A., et al. 2005, BaltA, 14, 395
- Rawlings & Saunders (1991) Rawlings, S., & Saunders, R. 1991, Nature, 349, 138
- Readhead et al. (1996) Readhead, A. C. S., Taylor, G. B., Pearson, T. J., & Wilkinson, P. N. 1996, ApJ, 460, 634
- Reynolds & Begelman (1997) Reynolds, C. S., & Begelman, M. C. 1997, ApJ, 487, L135
- Reach et al. (2005) Reach, W. T., et al. 2005, PASP, 117, 978
- Rieke & Lebofsky (1985) Rieke, G. H., & Lebofsky, M. J. 1985, ApJ, 288, 618
- Rieke et al. (2004) Rieke, G. H., et al. 2004, ApJS, 154, 25
- Rieke et al. (2006) Rieke, G., Donley, J., Gorjian, V., Hines, D., Rigby, J., Shi, Y., & Werner, M. 2006, Spitzer Proposal ID #30443
- Rudnick & Jones (1982) Rudnick, L., & Jones, T. W. 1982, ApJ, 255, 39
- Salgado et al. (1999) Salgado, J.-F., Altschuler, D. R., Ghosh, T., Dennison, B. K., Mitchell, K. J., & Payne, H. E. 1999, ApJS, 120, 77
- Sambruna et al. (2006) Sambruna, R. M., Gliozzi, M., Tavecchio, F., Maraschi, L., & Foschini, L. 2006, ApJ, 652, 146
- Scheck et al. (2002) Scheck, L., Aloy, M. A., Martí, J. M., Gómez, J. L., & Müller, E. 2002, MNRAS, 331, 615
- Schlegel et al. (1998) Schlegel, D. J., Finkbeiner, D. P., & Davis, M. 1998, ApJ, 500, 525
- Schoenmakers et al. (2000) Schoenmakers, A. P., de Bruyn, A. G., Röttgering, H. J. A., van der Laan, H., & Kaiser, C. R. 2000, MNRAS, 315, 371
- Scoville et al. (2000) Scoville, N. Z., et al. 2000, AJ, 119, 991
- Seielstad et al. (1983) Seielstad, G. S., Pearson, T. J., & Readhead, A.C.S. 1983, PASP, 95,842
- Shaw et al. (1992) Shaw, M. A., Tzioumis, A. K., & Pedlar, A. 1992, MNRAS, 256, 6
- Shi et al. (2005) Shi, Y., et al. 2005, ApJ, 629, 88
- Shklovsky (1965) Shklovsky, I. S. 1965, Nature, 206, 176
- Siemiginowska et al. (2009) Siemiginowska, A. 2009, AN, 330, 264
- Siemiginowska et al. (2008) Siemiginowska, A., La Massa, S., Aldcroft, T., Bechtold, J., & Elvis, M. 2008, ApJ, 684, 811
- Sikora et al. (2009) Sikora, M., Stawarz, Ł., Moderski, R., Nalewajko, K., & Madejski, G. M. 2009, ApJ, 704, 38
- Silva et al. (1998) Silva, L., Granato, G. L., Bressan, A., & Danese, L. 1998, ApJ, 509, 103
- Smith & Heckman (1989) Smith, E. P., & Heckman, T. P. 1989, ApJS, 69, 365
- Snellen et al. (1996) Snellen, I. A. G., Bremer, M. N., Schilizzi, R. T., Miley, G. K., & van Ojik, R. 1996, MNRAS, 279, 1294
- Snellen et al. (2000) Snellen, I. A. G., Schilizzi, R. T., & van Langevelde, H. J. 2000, MNRAS, 319, 429
- Spencer et al. (1989) Spencer, R. E., McDowell, J. C., Charlesworth, M., Fanti, C., Parma, P., & Peacock, J. A. 1989, MNRAS, 240, 657
- Spergel et al. (2003) Spergel, D. N., et al. 2003, ApJS, 148, 175
- Stanghellini et al. (2001) Stanghellini, C., Dallacasa, D., O’Dea, C. P., Baum, S. A., Fanti, R., & Fanti, C. 2001, A&A, 377, 377
- Stanghellini et al. (2002) Stanghellini, C., Liu, X., Dallacasa, D., & Bondi, M. 2002, NewAR, 46, 287
- Stanghellini et al. (1997) Stanghellini, C., O’Dea, C. P., Baum, S. A., Dallacasa, D., Fanti, R., & Fanti, C. 1997, A&A, 325, 943
- Stanghellini et al. (1993) Stanghellini, C., O’Dea, C. P., Baum, S. A., & Laurikainen, E. 1993, ApJS, 88, 1
- Stanghellini et al. (1998) Stanghellini, C., O’Dea, C. P., Dallacasa, D., Baum, S. A., Fanti, R., & Fanti, C. 1998, A&AS, 131, 303
- Stanghellini et al. (2005) Stanghellini, C., O’Dea, C. P., Dallacasa, D., Cassaro, P., Baum, S. A., Fanti, R., & Fanti, C. 2005, A&A, 443, 891
- Starling et al. (2004) Starling, R. L. C., Siemiginowska, A., Uttley, P., & Soria, R. 2004, MNRAS, 347, 67
- Stawarz et al. (2007) Stawarz, Ł., Cheung, C. C., Harris, D. E., & Ostrowski, M. 2007, ApJ, 662, 213
- Stawarz et al. (2008) Stawarz, Ł., Ostorero, L., Begelman, M. C., Moderski, R., Kataoka, J., & Wagner, S. 2008, ApJ, 680, 911
- Stickel et al. (1994) Stickel, M., Meisenheimer, K., & Kühr, H. 1994, A&AS, 105, 211
- Stickel et al. (1996a) Stickel, M., Rieke, G. H., Kühr, H., & Rieke, M. J. 1996a, ApJ, 468, 556
- Stickel et al. (1996b) Stickel, M., Rieke, M. J., Rieke, G. H., & Kühr, H. 1996b, A&A, 306, 49
- Surace & Sanders (1999) Surace, J. A., & Sanders, D. B. 1999, ApJ, 512, 162
- Taylor et al. (1996) Taylor, G. B., Readhead, A. C. S., & Pearson, T. J. 1996, ApJ, 463, 95
- Taylor et al. (1994) Taylor, G. B., Vermeulen, R. C., Pearson, T. J., Readhead, A. C. S., Henstock, D. R., Browne, I. W. A., & Wilkinson, P. N. 1994, ApJS, 95, 345
- Taylor et al. (2000) Taylor, G. B., Marr, J. M., Readhead, A. C. S., & Pearson, T. J. 2000, ApJ, 541, 112
- Tengstrand et al. (2009) Tengstrand, O., Guainazzi, M., Siemiginowska, A., Fonseca Bonilla, N., Labiano, A., Worrall, D. M., Grandi, P., & Piconcelli, E. 2009, A&A, 501, 89
- Teräsranta et al. (2001) Teräsranta, H., Urpo, S., Wiren, S., & Valtonen, M. 2001, A&A, 368, 431
- Teräsranta et al. (2005) Teräsranta, H., Wiren, S., Koivisto, P., Saarinen, V., & Hovatta, T. 2005, A&A, 440, 409
- Tinti et al. (2005) Tinti, S., Dallacasa, D., De Zotti, G., Celotti, A., & Stanghellini, C. 2005, A&A, 432, 31
- Torniainen et al. (2007) Torniainen, I., Tornikoski, M., Lähteenmäki, A., Aller, M. F., Aller, H. D., & Mingaliev, M. G. 2007, A&A, 469, 451
- Torniainen et al. (2005) Torniainen, I., Tornikoski, M., Teräsranta, H., Aller, M. F., & Aller, H. G. 2005, A&A, 435, 839
- Tschager et al. (2000) Tschager, W., Schilizzi, R. T., Röttgering, H. J. A., Snellen, I. A. G., & Miley, G. K. 2000, A&A, 360, 887
- Ulvestad et al. (1981) Ulvestad, J., Johnston, K., Perley, R., & Fomalont, E. 1981, AJ, 86, 1010
- van Breugel et al. (1984) van Breugel, W., Miley, G. K., & Heckman, T. 1984, AJ, 89, 5
- Veilleux et al. (1997) Veilleux, S., Sanders, D.B., & Kim, D.-C. 1997, ApJ, 484, 92
- Veilleux et al. (1999) —. 1999, ApJ, 522, 139
- Vermeulen et al. (2006) Vermeulen, R. C., Labiano, A., Barthel, P. D., Baum, S. A., de Vries, W. H., & O’Dea, C. P. 2006, A&A, 447, 489
- Vermeulen et al. (2003) Vermeulen, R. C., et al. 2003, A&A, 404, 861
- Vink et al. (2006) Vink, J., Snellen, I., Mack, K.-H., & Schilizzi, R. 2006, MNRAS, 367, 928
- Waldram et al. (2003) Waldram, E. M., Pooley, G. G., Grainge, K. J. B., Jones, M. E., Saunders, R. D. E., Scott, P. F., & Taylor, A. C. 2003, MNRAS, 342, 915
- Wamsteker (1981) Wamsteker, W. 1981, A&A, 97, 329
- Wilkinson et al. (1994) Wilkinson, P. N., Polatidis, A. G., Readhead, A. C. S., Xu, W., & Pearson, T. J. 1994, ApJ, 432, L87
- Wu (2009a) Wu, Q. W. 2009a, MNRAS, 398, 1905
- Wu (2009b) —. 2009b, ApJ, 701, L95
- Xiang et al. (2002) Xiang, L., Stanghellini, C., Dallacasa, D., & Haiyan, Z. 2002, A&A, 385, 768
- Xu et al. (2009) Xu, Y.-D., Cu, X., & Wu, Q. 2009, ApJ, 694, L107
- Zensus et al. (2002) Zensus, A. J., Ros, E., Kellermann, K. I., Cohen, M. H., Vermeulen, R. C., & Kadler, M. 2002, AJ, 124, 662
- Zaurín et al. (2007) Zaurín, J. R., Holt, J., Tadhunter, C.N., & González Delgado, R. M. 2007, MNRAS, 375, 1133
- Zirbel (1996) Zirbel, E. L. 1996, ApJ, 473, 713
| Source | aaRedshift, taken from NED. | Angular | Linear | Scale | log() | ccObserved turnover frequency (or frequency range) of the radio spectrum | ddIntrinsic (source-frame) turnover frequency (or frequency range) of the radio spectrum | vh,sepeeHotspot separation velocity, derived from the projected angular velocities. | AgeffSource age, estimated by means of kinematic (k) and/or spectral ageing (s) methods. | |
|---|---|---|---|---|---|---|---|---|---|---|
| name | SizebbOverall angular size of the radio source, unless otherwise stated. | Size | (kin./spec.) | |||||||
| [mas] | [pc] | [pc/mas] | log(W Hz-1) | [MHz] | [MHz] | [] | [yr] | [ erg s-1] | ||
| IERS B0026+346 | 0.517 | 35 | 211.4 | 6.04 | 27.1ggDerived from . | 630.9611footnotemark: | 957.17 | 1.8422footnotemark: | ||
| IERS B0108+388 | 0.66847 | 633footnotemark: | 40.9 | 6.82 | 27.233footnotemark: | 390047604,5;64,5;6footnotemark: | 65108340 | 77footnotemark: | 88footnotemark: (k) | 2.0099footnotemark: |
| 77footnotemark: (k) | ||||||||||
| 4171010footnotemark: (k) | ||||||||||
| IERS B0500+019 | 0.58457 | 1533footnotemark: | 96.3 | 6.42 | 27.133footnotemark: | 200044footnotemark: | 3169.14 | 4.9522footnotemark: | ||
| IERS B0710+439 | 0.518 | 2533footnotemark: | 151.1 | 6.04 | 27.033footnotemark: | 150019004,54,5footnotemark: | 22772884 | 77footnotemark: | 77footnotemark: (k) | 2.1599footnotemark: |
| 9321010footnotemark: (k) | ||||||||||
| 120018001111footnotemark: (s) | ||||||||||
| PKS B0941-080 | 0.228 | 5033footnotemark: | 177.4 | 3.55 | 26.033footnotemark: | 5004,54,5footnotemark: | 614 | 0.0057822footnotemark: , 0.0051212footnotemark: | ||
| IERS B1031+567 | 0.450 | 4033footnotemark: | 224.0 | 5.60 | 26.833footnotemark: | 5,45,4footnotemark: | 18902030 | 77footnotemark: | 77footnotemark: (k) | 0.3399footnotemark: |
| 18361010footnotemark: (k) | ||||||||||
| IERS B1345+125 | 0.12174 | 80h,3h,3footnotemark: | 170.4 | 2.13 | 25.933footnotemark: | 6005,135,13footnotemark: | 673 | 0.401414footnotemark: , 0.411212footnotemark: | ||
| IVS B1358+624 | 0.4310 | 7033footnotemark: | 382.3 | 5.46 | 26.833footnotemark: | 5004,54,5footnotemark: | 715 | 2.53899footnotemark: | ||
| IERS B1404+286 | 0.07658 | 733footnotemark: | 9.9 | 1.41 | 25.433footnotemark: | 4900534015,615,6footnotemark: | 52805750 | 1616footnotemark: | 1717footnotemark: (k) | 0.038 – 0.91818footnotemark: |
| 2241010footnotemark: (k) | ||||||||||
| IERS B2128+048 | 0.990 | 3511footnotemark: | 271.9 | 7.77 | 27.833footnotemark: | 6008004,54,5footnotemark: | 11941592 | 4.2022footnotemark: , 3.211212footnotemark: | ||
| IERS B2352+495 | 0.23790 | 5033footnotemark: | 183.2 | 3.66 | 26.233footnotemark: | 7009005,45,4footnotemark: | 8701110 | 77footnotemark: | 77footnotemark: (k) | 0.048899footnotemark: |
| 30031010footnotemark: (k) |
References. — (1) Snellen et al. (1996); (2) Guainazzi et al. (2006); (3) O’Dea (1998); (4) de Vries et al. (1997); (5) Stanghellini et al. (1998); (6) Tinti et al. (2005); (7) Taylor et al. (2000); (8) Owsianik et al. (1998); (9) Vink et al. (2006); (10) Polatidis & Conway (2003); (11) Readhead et al. (1996); (12) Siemiginowska et al. (2008); (13) Stanghellini et al. (2001); (14) O’Dea et al. (2000); (15) Dallacasa et al. (2000); (16) Stanghellini et al. (2002); (17) Liu et al. (2000); (18) Guainazzi et al. (2004).
| Source name | IRAC | MIPS | ||||
|---|---|---|---|---|---|---|
| (mJy) | (mJy) | (mJy) | (mJy) | (mJy) | (mJy) | |
| IERS B0500+019 | ||||||
| IERS B1345+125 | ||||||
| IERS B1404+286 | ||||||
Note. — Details on the analysis of the Spitzer data can be found in Appendix B.
| Source name | (a)(a)The Eddington luminosity was computed according to the relation: erg s(e.g., Krolik, 1998). The assumed BH mass is given in square brackets in units of : it is the most recent estimate of the source BH mass when available (from Wu (2009a) when marked with †, from Wu (2009b) when marked with ‡, and from Dasyra et al. (2006) when marked with ⋄), and the average value of the BH mass estimated by Wu (2009b) for his GPS-source sample () otherwise (i.e., for masses marked with ∗). | |||||||||
|---|---|---|---|---|---|---|---|---|---|---|
| ( erg s) | ( erg s) | ( erg s) | ( erg s) | (GHz) | (THz) | |||||
| IERS B0026+346 | 0.70 | 10 | 6.00 | 1.00 | 0.70 | 2.0 | 0.7 | 5 | 0.007 | 0.390 [1.698∗] |
| IERS B0108+388 | 2.05 | 5 | 0.50 | 0.60 | 1.80 | 3.2 | 6.0 | 5 | 0.041 | 0.417 [0.794‡] |
| IERS B0500+019 | 1.80 | 5 | 3.50 | 1.00 | 1.70 | 2.0 | 2.0 | 5 | 0.036 | 0.195 [1.698∗] |
| IERS B0710+439 | 2.80 | 10 | 4.30 | 0.90 | 2.00 | 2.1 | 2.5 | 5 | 0.028 | 0.264 [2.512‡] |
| PKS B0941-080 | 0.40 | 1 | 0.08 | 0.80 | 2.00 | 2.5 | 0.5 | 5 | 0.040 | 0.132 [0.501†] |
| IERS B1031+567 | 0.87 | 5 | 1.40 | 0.30 | 1.90 | 2.0 | 1.0 | 5 | 0.017 | 0.263 [1.259‡] |
| IERS B1345+125 | 0.17 | 5 | 6.00 | 0.90 | 1.40 | 2.0 | 0.4 | 5 | 0.003 | 0.506 [0.654⋄] |
| IVS B1358+624 | 2.10 | 5 | 6.00 | 0.35 | 1.75 | 2.7 | 0.6 | 5 | 0.042 | 0.209 [1.585‡] |
| IERS B1404+286 | 0.30 | 2 | 0.70 | 0.50 | 2.15 | 5.6 | 5.0 | 13 | 0.015 | 0.026 [5.012‡] |
| IERS B2128+048 | 4.00 | 5 | 3.00 | 0.65 | 1.70 | 2.5 | 1.2 | 5 | 0.080 | 0.195 [1.698∗] |
| IERS B2352+495 | 0.45 | 5 | 0.60 | 0.35 | 2.00 | 2.0 | 1.0 | 5 | 0.009 | 0.132 [2.512‡] |
Note. — The fit parameters (cols. 2–9) are described in Sections 2 and 4; the derived quantities (cols. 10 and 11) are discussed in Section 6. Parameters common to all the SED fits, not included in this Table, are as follows: cm, , , , , Hz, Hz. We assumed hotspot propagation velocity when no hotspot separation velocity was available (see Table 1); from the known , we derived by using the appropriate composition law for velocities, yielding in most cases .
| Source name | (a)(a)Equivalent total hydrogen column density, assumed to be located at the source redshift; the values in boldface are those used for the correlation analysis (see Section 5.2, and Tables 5 and 6). | Ref. | (b)(b)Neutral hydrogen column density derived from low resolution measurements, unable to determine the location of the absorbing gas; the values in boldface are those used for the correlation analysis (see Section 5.2, and Tables 5 and 6). | Ref. | ||
|---|---|---|---|---|---|---|
| (cm) | (cm) | ( cm) | ||||
| IERS B0026+346 | 5.6 | 2 | ||||
| IERS B0108+388 | 5.8 | 1.75(c)(c)Fixed. | 3 | 8 | ||
| IERS B0500+019 | 8.3 | 2 | (4.5,2.5) | 8 | ||
| IERS B0710+439 | 8.11 | 3 | ||||
| PKS B0941-080 | 3.7 | 2(c)(c)Fixed. | 2 | 0.80(d)(d)Derived from the value of ,2σ given by (6), which was obtained from the relation: , under the assumption =100 K, km s, and ; no detection of absorption lines. , (e)(e) upper limit. | 6, 10 | |
| 3.7 | 9 | |||||
| 3.67 | (e)(e) upper limit. | 9b | ||||
| 3.67 | (e)(e) upper limit. | (c)(c)Fixed. | 9b | |||
| IERS B1031+567 | 0.56 | 1.75(c)(c)Fixed. | 3 | 0.87(d)(d)Derived from the value of ,2σ given by (6), which was obtained from the relation: , under the assumption =100 K, km s, and ; no detection of absorption lines. , (e)(e) upper limit. | 6, 10 | |
| IERS B1345+125 | 1.1 | 1 | (f)(f) K cmwas obtained by Morganti et al. (2004b) from high-resolution measurements that constrain the location of the absorbing gas. | 7 | ||
| 1.9 | 9 | |||||
| IVS B1358+624 | 1.96 | 3 | (g)(g)Derived from the value of ,2σ given by (6), which was obtained from the relation , under the assumption of =100 K, and . | 6 | ||
| IERS B1404+286(h)(h)For this source, we report the X-ray spectral parameters derived by Guainazzi et al. (2004) by means of different models for the X-ray emission; the first three parameter sets refer to the bow-ties represented in Fig. 1; the third set is bes fitted by our model. | 1.4 | (i)(i)Soft X-rays (). | (i)(i)Soft X-rays ()., (j)(j)Hard X-rays (). | 4 | 1.83(g)(g)Derived from the value of ,2σ given by (6), which was obtained from the relation , under the assumption of =100 K, and . | 6 |
| (i)(i)Soft X-rays (). , (j)(j)Hard X-rays (). | ||||||
| (i,k)(i,k)footnotemark: | (l)(l)Intrinsic, for the Compton-reflection model. | |||||
| (i)(i)Soft X-rays (). | (i)(i)Soft X-rays ()., 2(j,c)(j,c)footnotemark: | |||||
| (i)(i)Soft X-rays (). | ||||||
| IERS B2128+048 | 5.2 | 2 | ||||
| 5.2 | 9 | |||||
| IERS B2352+495 | 12.4 | 1.75(c)(c)Fixed. | 3 | 0.28; (g,n)(g,n)footnotemark: | 6 |
| SampleaaD5 is our sub-sample of - detections; AD indicates - detections for additional sources reported by Tengstrand et al. (2009); see Section 5.2 and Table X-Ray Emitting GHz-Peaked-Spectrum Galaxies: Testing a Dynamical-Radiative Model with Broad-Band Spectra for details. | N | Pearson | Spearman | Kendall | Linear regression | ||||
|---|---|---|---|---|---|---|---|---|---|
| Prob.bbProbability of the null hypothesis of no correlation being true. It is a two-sided significance level: because we are looking a priori for a positive correlation, this value should actually be divided by 2, improving the significance by a factor of 2. | Prob.bbProbability of the null hypothesis of no correlation being true. It is a two-sided significance level: because we are looking a priori for a positive correlation, this value should actually be divided by 2, improving the significance by a factor of 2. | Prob.bbProbability of the null hypothesis of no correlation being true. It is a two-sided significance level: because we are looking a priori for a positive correlation, this value should actually be divided by 2, improving the significance by a factor of 2. | Slope | Intercept | |||||
| D5 | 6 | 0.9966 | 1.739e-05 | 0.3947 | 0.4387 | 0.2981 | 0.4008 | 0.8370.109 | 5.1512.269 |
| D5+AD | 7 | 0.9967 | 1.229e-06 | 0.6301 | 0.1294 | 0.5143 | 0.1048 | 0.9810.100 | 2.1222.067 |
| SampleaaD5 is our sub-sample of - detections; U2 is our sub-sample of and/or upper limits; ADU is the set of detections of and upper limits to, and/or for additional sources reported by Tengstrand et al. (2009); see Section 5.2 and Table X-Ray Emitting GHz-Peaked-Spectrum Galaxies: Testing a Dynamical-Radiative Model with Broad-Band Spectra for details. | N | Generalized Spearman | Generalized Kendall | Schmitt’s linear regression | |||
|---|---|---|---|---|---|---|---|
| Prob.b,cb,cfootnotemark: | dd is defined in Isobe et al. (1986). | Prob.bbProbability of the null hypothesis of no correlation being true. It is a two-sided significance level: because we are looking a priori for a positive correlation, this value should actually be divided by 2, improving the significance by a factor of 2. | Slope | Intercept | |||
| D5+U2 | 8 | 0.670 | 0.0764 | 26. (=1.749) | 0.0804 | 0.94330.0621 | 2.83781.3403 |
| D5+U2+ADU | 11 | 0.738 | 0.0197 | 54. (=2.402) | 0.0163 | 1.07110.0034 | 0.07750.0695 |