Multiwavelength observations of a TeV-Flare from W Comae
Abstract
We report results from an intensive multiwavelength campaign on the intermediate-frequency-peaked BL Lacertae object W Com (z=0.102) during a strong outburst of very high energy gamma-ray emission in June 2008. The very high energy gamma-ray signal was detected by VERITAS on 2008 June 7-8 with a flux F( GeV) cm-2s-1, about three times brighter than during the discovery of gamma-ray emission from W Com by VERITAS in 2008 March. The initial detection of this flare by VERITAS at energies above 200 GeV was followed by observations in high energy gamma-rays (AGILE, 100 MeV), and X-rays (Swift and XMM-Newton), and at UV, and ground-based optical and radio monitoring through the GASP-WEBT consortium and other observatories. Here we describe the multiwavelength data and derive the spectral energy distribution (SED) of the source from contemporaneous data taken throughout the flare.
1 Introduction
W Com (ON 231; ) is a gamma-ray blazar classified as an intermediate-frequency-peaked BL Lac (IBL) object (Nieppola et al, 2006), based on the locations of its low-energy synchrotron peak and high-energy peak in its spectral energy distribution (SED). The majority of the blazars detected at very high energies (VHE, GeV) by ground-based imaging atmospheric Cherenkov telescopes (IACTs) are high-frequency peaked BL Lacs (HBL), characterized by synchrotron peaks in the X-ray band (often at energies of keV). Due to the improved sensitivity of current-generation IACTs such as VERITAS, IBLs are attractive targets of observations at VHE gamma rays, particularly because they offer the possibility of extension of the VHE blazar catalog to include non-HBLs. VHE observations of different blazar classes, including flat-spectrum radio quasars (FSRQs) and BL Lac objects, will help in our understanding of the relationship of the different blazar populations and, ultimately, the mechanism for particle acceleration and emission in the highly-relativistic jets.
W Com was the first IBL to be detected at very high energies (Acciari et al, 2008b). It was discovered as a VHE source by VERITAS during observations carried out over a four month period in 2008 (Jan to Apr). During this time a strong gamma-ray outburst was measured over a 4-day interval, when the source flared in the middle of March. VERITAS reported a steep photon spectrum 111The subscripts stat and sys denote the statistical and systematic error. and an integral flux of 9% of the Crab Nebula flux during the flare nights. The VERITAS detection triggered Swift observations, and the multiwavelength data obtained were adequately explained with a synchrotron-external Compton (EC) leptonic model (Acciari et al, 2008b).
In this article we report on a second VHE flare in W Com observed by VERITAS in 2008 June. During this flare, when the source was approximately three times brighter than during the 2008 March observations, a multiwavelength campaign was triggered, including observations with the space-based AGILE gamma-ray telescope and the Swift and XMM-Newton X-ray telescopes. Here we describe the multiwavelength data and derive the spectral energy distribution (SED) of the source from contemporaneous data taken throughout the flare.
2 Observations and Results
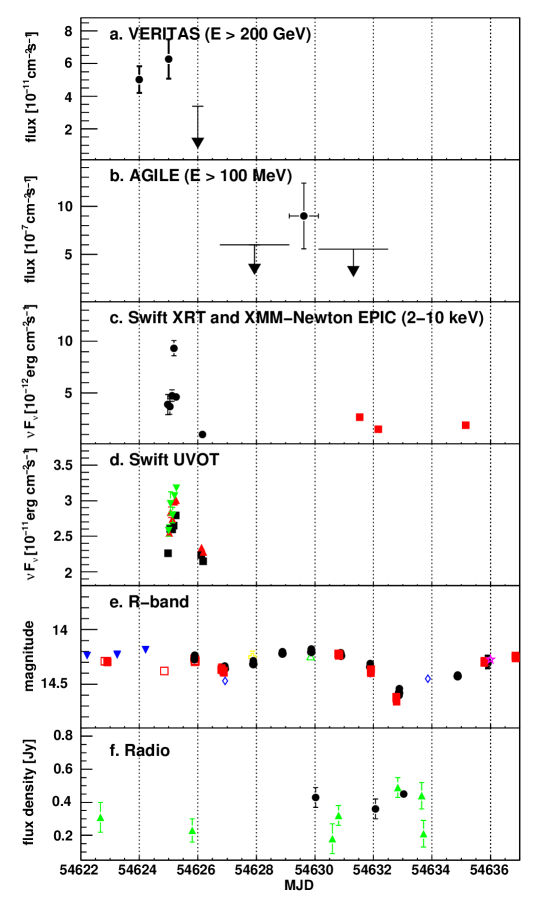
A summary of the complete multiwavelength data set on W Com for observation times close to the VHE detection on 2008 June 7-9 can be found in Table 1 and Figure 1.
2.1 VERITAS: VHE Gamma-ray observations
VERITAS is an array of four imaging Cherenkov telescopes located at the Fred Lawrence Whipple Observatory in southern Arizona. It combines a large effective area (up to m2) over a wide energy range (100 GeV to 30 TeV) with good energy resolution (15-20%) and angular resolution (). The field of view of the VERITAS telescopes is 3.5o. The high sensitivity of VERITAS allows the detection of sources with a flux of 1% of the Crab Nebula in less than 50 hours of observations. For more details on the VERITAS instrument, see Holder et al (2006) or Weekes et al (2002).
VERITAS observed W Com for 230 minutes on 2008 June 7-9. All observations pass quality-selection criteria, which remove data taken during bad weather or affected by hardware-related problems. The data were taken in wobble mode, wherein the source was positioned at a fixed offset of 0.5o in one of four directions (North, South, East, West) from the camera center. This allows the simultaneous estimate of the background (Fomin et al, 1994). The regions around the VHE gamma-ray blazar 1ES 1218+304 (Acciari et al, 2008c), located about 2o north of W Com, and around bright stars (B-band magnitude brighter than 6) are excluded from the background estimation. All observations were undertaken in moonlight conditions, where the elevated background light levels lead to a lower sensitivity for the detection of gamma rays at the threshold. The threshold of the first-level trigger system (Holder et al, 2006) was increased to 70 mV (compared to a default value of 50 mV) to allow for very high background moonlight levels during observations on 2008 June 9. Table 2 lists observation times, elevation range, and background light conditions for the VERITAS observations. The different elevations of observation combined with the continuously changing background light conditions result in a range of energy thresholds from 200 to 420 GeV222 The energy threshold is defined as the energy at which the peak of the differential counting rate for a Crab Nebula-like spectrum occurs. .
The analysis steps consist of calibration and integration of the flash-ADC traces, image cleaning, second-moment parameterization of the telescope images (Hillas, 1985), stereoscopic reconstruction of the event impact position and direction, gamma-hadron separation (see e.g., Krawczynski et al. (2006)), and the generation of photon maps. Most of the far more numerous background events are rejected by comparing the parameterized shape of the event images in each telescope with the expected shapes of gamma-ray showers modeled by Monte Carlo simulations. Mean-reduced-scaled width and mean-reduced-scaled length cuts (see definition in Acciari et al (2008a)), and an additional cut on the arrival direction of the incoming gamma ray (, defined as the square of the angular distance to the position of W Com to the reconstructed shower direction), reject more than 99.9% of successfully reconstructed cosmic-ray background events while keeping 45% of the gamma rays. The cuts applied here are: integrated charge per image 75 photoelectrons, mean-reduced-scaled width and length between -1.2 and 0.5, and deg2. The number of background events in the source region are estimated from the same field of view using the “reflected-region” model with 10 background regions (Aharonian et al, 2001).
The energy of each event is estimated from detailed Monte Carlo simulations of extensive air showers and the response of the telescopes, focal plane detectors and electronics. The energy reconstruction algorithm uses lookup tables and determines the energy of an event as a function of impact parameter, integrated charge per image, background light level, offset of the arrival direction from the center of the camera, and zenith and azimuth angle. Gamma-ray collection areas for these different observing conditions are calculated using the same Monte Carlo simulations (Mohanty et al, 1998). The finite energy resolution is taken into consideration by calculating collection areas as a function of reconstructed energy. The dependence of the collection area on the spectral index is taken into account by an iterative process, where collection areas are calculated using the spectral index obtained in the previous step. Convergence is usually achieved after 2-3 steps. The spectral reconstruction algorithm assigns to each event a collection area according to its estimated energy, background light level, offset of the arrival direction from the center of the camera, assumed spectral index, and zenith and azimuth angles. Varying conditions, like changing elevations or background light levels are therefore taken into account in the flux calculations and spectral energy reconstruction. It should be noted that the definition of energy threshold used here implies that collection areas are non-zero below the stated threshold value. Gamma rays are collected, although with lower efficiency, at energies well below 200 GeV even for the brightest background light levels. The systematic error in the estimation of the gamma-ray energy is dominated by variabilities and uncertainties in the atmospheric conditions, overall Cherenkov photon collection efficiency, and limitations of the Monte Carlo simulations.
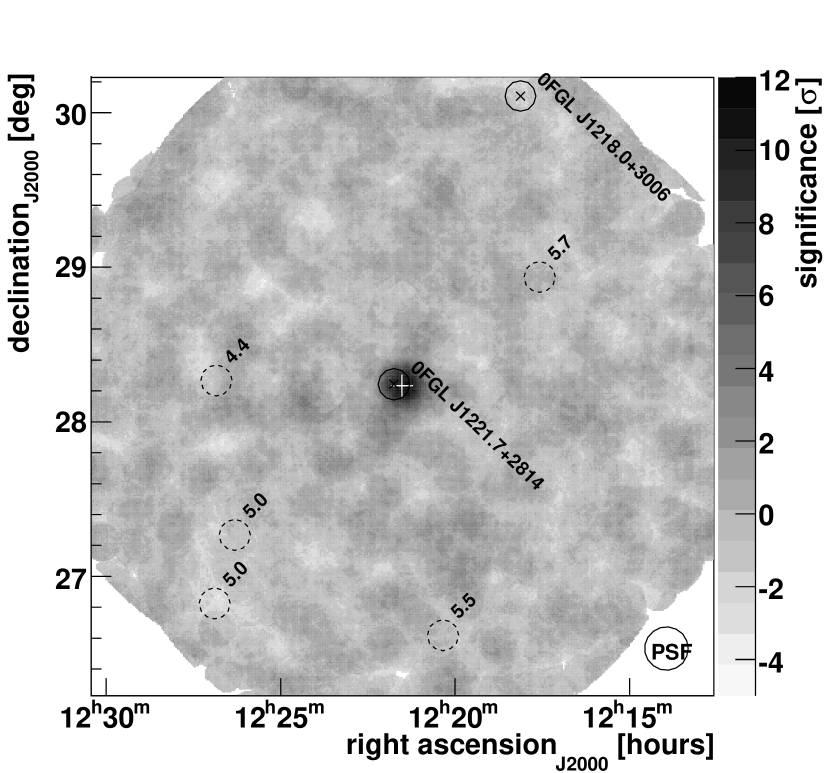
Figure 2 shows the sky around W Com as seen by VERITAS in VHE gamma rays. A significant flux of very-high-energy gamma rays from W Com is detected by VERITAS for the entire data set taken on 2008 June 7-9. A total of 117 excess events (195 on-source events and 78 normalized off-source events, normalization factor of 0.10) are measured. This corresponds to a significance of 10.3 standard deviations, calculated following Equation 17 in Li & Ma (1983). Table 2 lists the daily significances and fluxes above 200 GeV, assuming a power-law like spectral shape with a photon index of 3.68 (see next paragraph); Figure 1 shows the light curve for these observations. W Com is not detected on 2008 June 9 (MJD 54626), but observations were restricted to only 32 min due to very high background light levels caused by the Moon. The average flux on 2008 June 7-8 is 2.5-3 times higher than during the gamma-ray flare from W Com in March 2008 (Acciari et al, 2008b). The position of the peak of the gamma-ray excess, reconstructed by fitting a 2D-Gaussian function to the uncorrelated excess sky map, is in agreement with the position of the radio source associated with W Com (Fey et al, 2004): , . The systematic uncertainty on the pointing, verified with optical pointing monitors, is less than . The morphology of the excess is compatible with the distribution expected from a point source.
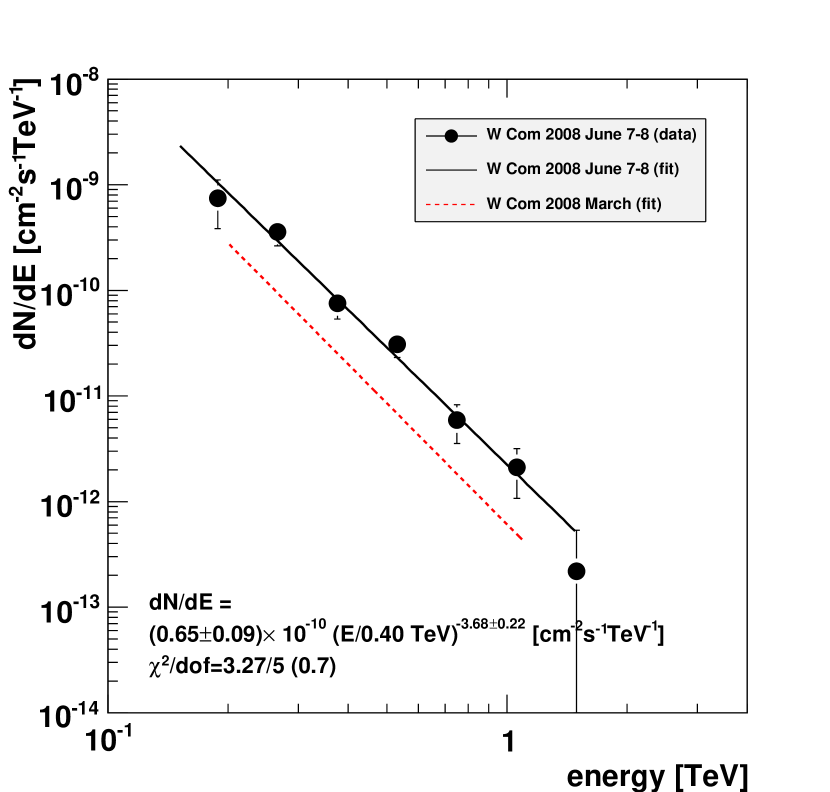
The differential photon spectrum between 180 GeV and 3 TeV for the measurements from 2008 June 7-8 is shown in Figure 3. The shape of the spectrum is consistent with a power law -Γ with an photon index and a flux normalization constant C = cm-2s-1TeV-1. For comparison, the flare in VHE gamma rays from W Com in 2008 March (Acciari et al, 2008b) is well fit by a power law with a consistent , but smaller flux constant C = cm-2s-1TeV-1.
2.2 AGILE: HE Gamma-ray observations
The Gamma-Ray Imaging Detector (GRID, 30 MeV - 30 GeV) onboard the high energy astrophysics satellite AGILE (Tavani et al, 2008a) pointed towards W Com continuously from 2008 June 9 (18:00 UT) to 15 (12:00 UT) (Verrecchia et al, 2008). The GRID data is analyzed using the AGILE standard pipeline (Vercellone et al, 2008), with a bin size of . Only events flagged as gamma rays and not recorded while the satellite crossed the South Atlantic Anomaly are accepted. Events with reconstructed direction less than of the Earth limb are rejected, thus reducing contamination from Earth’s gamma-ray albedo. W Com was observed about 3 degrees off-axis with respect to the boresight and a 3.7 excess (pre-trials) of events 100 MeV is found from 12 (03:00 UT) to 13 (03:00) June 2008, corresponding to a flux of ph s-1 cm-2. It should be mentioned that this flux is roughly a factor of 1.5 higher than the highest flux detected by the Energetic Gamma Ray Experiment Telescope (EGRET; Hartman et al (1999)) onboard the Compton Gamma Ray Observatory and significantly higher than the weekly averaged peak flux of ph s-1 cm-2 reported by the Large Area Telescope onboard the Fermi Gamma-Ray Space Telescope during its first three months of operation (Abdo et al, 2009b). No excess is found in the rest of the observing period and upper limits are obtained; results can be found in Table 3 and Figure 1.
SuperAGILE, the hard X-ray imager onboard AGILE (18-60 keV, Feroci et al (2007)) observed the source for a net exposure time of 253 ks. The source position in the orthogonal SuperAGILE reference system is (3,0) deg, which means that the exposed area is close to the full on-axis effective area (Feroci et al, 2007). W Com is not been detected with SuperAGILE, and we estimate a 3 upper limit in the 20-60 keV energy of 6 mCrab erg cm-2 s-1 (assuming a photon index of ).
2.3 Swift and XMM-Newton: X-ray observations
Observations of W Com with the Swift satellite (Gehrels et al, 2004) were taken on 2008 June 7-9. All Swift X-ray telescope (XRT) data (Burrows et al, 2005) are reduced using the HEAsoft 6.5 package. Event files are calibrated and cleaned following the standard filtering criteria using the xrtpipeline task and applying the most recent Swift XRT calibration files. All data were taken in Photon Counting (PC) mode, with grades 0-12 selected over the energy range 0.3-10 keV. Due to photon pile-up in the core of the point spread function (PSF) at rates larger than 0.5 counts s-1 (PC mode), the source events are extracted from an annular region with an inner radius of 3 pixels and an outer radius of 30 pixels (47.2 arcsec). Background counts are extracted from a 40 pixel radius circle in a source-free region. Ancillary response files are generated using the xrtmkarf task, with corrections applied for the PSF losses and CCD defects. The response matrix Version 11 from the XRT calibration files is applied. To ensure valid minimization statistics during spectral fitting, the extracted XRT energy spectra are re-binned to contain a minimum of 20 counts in each bin. The spectra can be described by a single power-law convolved with galactic and local absorption. Table 4 summarizes the observations along with the best fit model parameters.
W Com was observed by the XMM-Newton Observatory (Jansen et al., 2001) between 2008 June 14 and June 18 over three consecutive orbits. The three observations comprise data from the EPIC detector (0.2-10 keV) in Small Window mode. The data have been analysed using SASv7.1 (Gabriel et al, 2004). Several filtering criteria have been applied to the EPIC data, including filtering for time periods of high background activity following the standard procedure, and filtering only for single- and double-pattern events for EPIC-pn and single to quadruple for EPIC-MOS, as well as including only events with good quality (quality FLAG=0). For the spectral analysis, circular source and annular background extraction regions centered on the source are selected by maximizing the signal-to-noise ratio. The spectra are re-binned in order not to oversample the intrinsic energy resolution of the EPIC cameras by a factor not more than 3, while making sure that each spectral channel contains at least 25 background-subtracted counts. This allows the use of the quality-of-fit estimator to find the best fit model. Fits are performed in the 0.2-10 keV energy range simultaneously for the three EPIC cameras, where the systematic difference between the EPIC cameras is below 5 in normalization. For the spectral analysis and fitting procedure XSPEC v12.4 (Arnaud, 1996) is used. The data can be best described similar to the XRT data by a single power-law convolved with galactic and local absorption. Table 5 summarizes the observations along with the best fit model parameters.
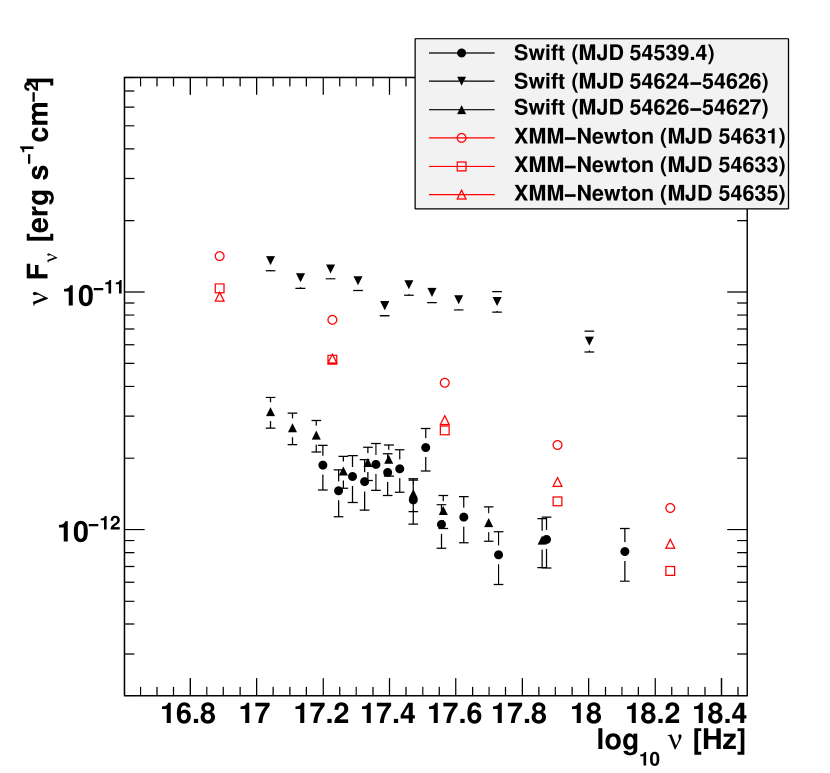
The measurements reveal strong variability in X-rays on time scales of much less than one day. Fig 1 (panel C) and 4 show that the X-ray flux changed by a factor of two during the VHE high state on MJD 54625. This is comparable to observations of W Com with BeppoSax in 1998 by Tagliaferri et al (2000), where flux variations of a factor of three in less than 5 hours is reported. The X-ray flux during the VHE low state of June 2008 is very similar to the X-ray activity measured during the detection of W Com in March 2008 (see Figure 4).
2.4 Optical, Near-IR, UV and Radio Observations
Eight optical, one near-IR and three radio observatories contributed data sets to this campaign; see Table 1 for an overview. The majority of the observatories are part of the GLAST-AGILE Support Program (GASP, see Villata et al (2008)), a subgroup of the Whole Earth Blazar Telescope (WEBT333http://www/oato.inaf.it/blazars/webt). In the period considered here, optical observations of W Com were carried out at the following observatories: Abastumani, Crimean, Roque de los Muchachos (KVA), Talmassons, Torino (for details concerning these observatories, see references provided by WEBT), San Pedro Martir, Northern Optical Telescope (NOT444http://www.not.iac.es/) and Sapienza University (Italy). Magnitude calibration is obtained with respect to the photometric sequence by Fiorucci & Tosti (1996). Near-infrared () data were acquired at the AZT-24 telescope at Campo Imperatore Observatory (Italy). Swift UV/Optical Telescope (UVOT) (Roming et al, 2005) observations were taken in the photometric bands of UVW1 (centered at 2600 Å), UVM2 (centered at 2246 Å), and UVW2 (centered at 1928 Å) (Poole et al, 2008). The uvotsource tool is used to extract counts from the UVOT, correct for coincidence losses, apply background subtraction, and calculate the source flux. The standard 5 arcsec radius source aperture is used, with a 20 arcsec background region.
At radio frequencies, data at 43 GHz were taken with the 32 m antenna at Noto (Bach et al, 2007), at 14.5 GHz with the 26 m telescope of the UMRAO (Aller et al, 2003), and at 36.8 GHz with the 13.7 m Metsähovi radio telescope (Teräsranta et al, 1998).
Data reduction of the optical and radio data followed standard methods and procedures, and we refer to the above papers for details. The near infrared, optical and UV data are corrected for absorption in our Galaxy using the dust maps of Schlegel et al (1998) and the extinction curve of Cardelli et al (1989). Since the blazar is observed in a bright state (see Section 3), a host galaxy contribution has not been subtracted.
3 Modeling and Discussions
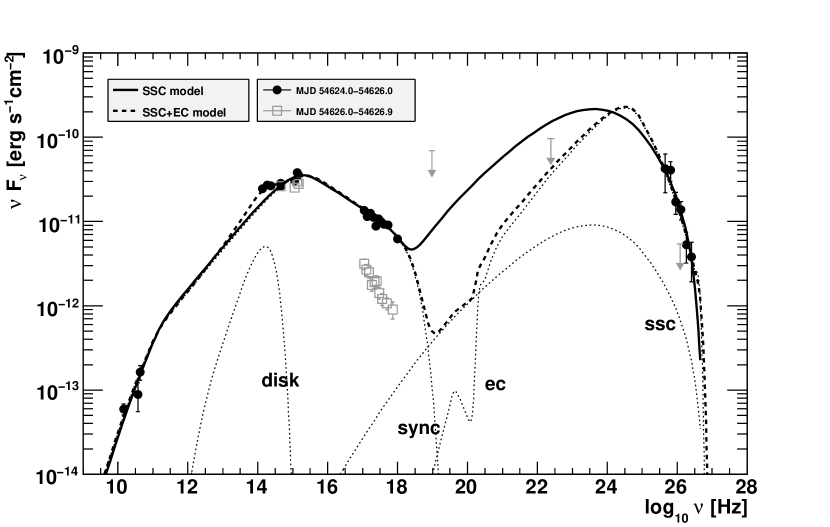
The single-epoch SEDs for two different time intervals are shown in Fig. 5. The broad-band SEDs of W Com show double-humped structures, as found in all known gamma-ray blazars. The photon-production mechanism in these objects are successfully modeled by leptonic (e.g. Böttcher & Chiang (2002), Ghisellini & Madau (1996)) and hadronic model (e.g. Böttcher et al (2002), Mücke et al (2003), Aharonian (2000)). The data presented here have been modeled using a leptonic one-zone jet model. For this purpose, a quasi-equilibrium version of the model described in Böttcher & Chiang (2002) is adopted. In this model, the observed electromagnetic radiation is interpreted as originating from ultrarelativistic electrons (and positrons) in a spherical emission region of co-moving radius , which is moving with a relativistic speed , corresponding to the bulk Lorentz factor . Lacking more detailed constraints on the viewing angle between the jet direction and the line of sight, we fix to be the superluminal angle, for which the bulk Lorentz factor equals the Doppler factor , which determines the Doppler shift of photon energies and relativistic boosting of intensities. We note that our results mainly depend on so that alternative combinations of and yielding the same Doppler factor as the ones used in our model calculations are also possible, although minor differences in the flux of the external-Compton emission with respect to other radiation components (see below) would result (see, e.g., Dermer 1995).
In our calculations, the size of the emission region is constrained by the shortest observed variability time scale through . In the optical and X-rays (Böttcher et al, 2002), variability down to time scales of a few hours has been observed, limiting the blob radius to cm.
Ultrarelativistic electrons are assumed to be instantaneously accelerated into a power-law distribution in electron energy, , as with a low- and high-energy cutoff and , respectively. An equilibrium between this particle injection, radiative cooling, and escape of particles from the emission region yields a temporary quasi-equilibrium state described by a broken power-law. The particle escape is parameterized through an escape time scale parameter as . The balance between escape and radiative cooling will lead to a break in the equilibrium particle distribution at a break Lorentz factor , where . The cooling time scale is evaluated self-consistently taking into account synchrotron, synchrotron-self-Compton (SSC) and external Compton (EC) cooling. Depending on whether is greater than or less than , the system will be in the slow cooling or fast cooling regime. In the fast cooling regime (), the equilibrium distribution will be a broken power-law with for and for . In the slow cooling regime (), the equilibrium distribution will be for and for . The number density of injected particles is normalized to the resulting power in ultrarelativistic electrons propagating along the jet,
| (1) |
The magnetic field in the emission region is a free parameter. The corresponding Poynting flux along the jet is , with the magnetic energy density . For each model calculation, the resulting equipartition parameter, , is evaluated. Modeling results of a large number of blazars, in particular flat-spectrum radio quasars, have shown that leptonic models can achieve reasonable fits with the emission region being close to equipartition, typically . However, there is no a priori argument which would dictate quasi-equipartition. Therefore, while we disfavor possible fit results with far from unity, we can not strictly rule out such scenarios.
Once the quasi-equilibrium particle distribution in the emission region is calculated, our code evaluates the radiative output from synchrotron emission, SSC, and EC emission self-consistently with the radiative cooling rates. For the EC component, we assume an external radiation field which is isotropic in the stationary AGN rest frame and can be approximated by a thermal blackbody with peak frequency and radiation energy density . The latter two quantities are free model parameters. The direct emission from this external radiation field is added to the emission from the jet to yield the total model SED which we fit to the observations.
In all model calculations the luminosity distance to W Com has been calculated using standard -CDM cosmology with and . Absorption of high-energy gamma rays by the extragalactic background light is taken into account using the model of Franceschini et al (2008).
We fit the VERITAS flare detection and high X-ray state (MJD 54624.0 – 54626.0) with a pure SSC model, i.e., without any external radiation fields, and with a model with an EC component. A Doppler factor of 20 (i.e., ) consistent with all observational constraints, and well in the range of Doppler factors commonly adopted in other blazar modeling works, allowed acceptable fits to the SEDs. We therefore fixed for the remainder of the fitting procedure.
For a pure SSC fit, the free parameters were thus (1) , the injection power of ultrarelativistic electrons into the emission region, (2,3) and , the cutoffs of the injected electron distribution, (4) , the injection spectral index, (5) , the magnetic field, (6), , the radius of the emission region, and (7) , the particle escape time scale parameter. The injection spectral index is tightly constrained by the observed X-ray energy spectral index , since electrons emitting synchrotron radiation in the X-ray regime are always above the critical Lorentz factor . The radius of the emission region is constrained through the minimum variability time scale of a few hours, as mentioned above. Together with the value of the magnetic field, the low-energy cutoff , determines the location of the synchrotron and gamma-ray peaks in the SED, while the high-energy cutoff influences the location of the high-energy cutoffs of the SED, in particular the synchrotron component. The cutoff of the SSC component is, in addition, strongly influenced by Klein-Nishina effects. Parameters of the SSC fit shown in Fig. 5 are listed in Table 6.
No SSC model fit was possible with the emission region being close to equipartition. Since there is virtually no observational constraint on the high-energy emission in the low (MJD 54626) and intermediate X-ray state (MJD 54631), we could choose a low injection power and relatively high magnetic field to achieve a synchrotron peak flux comparable to the flaring state, but at a much lower SSC flux. Such a choice of parameters allowed us to bring the system close to equipartition. However, almost any positive detection either in the Fermi or the VHE gamma-ray range could rule out this interpretation. In the SSC interpretation, the most significant difference between the various states consists of a change in the electron injection spectral index q from 2.55 in the flaring state to 3.50 and 3.40 in the low and intermediate state.
For a model with an EC component, two more parameters need to be specified: (8) the peak frequency and the energy density of the external radiation field. As with the SSC model, the electron spectral index is tightly constrained through the X-ray spectral index, while the variability time scale constrains the radius of the emission region. In order to avoid the problem of required large injection powers (to obtain a high SSC flux) and accordingly small magnetic fields (not to overpredict the synchrotron flux), the VHE gamma-ray emission can be interpreted as external-Compton emission. In order for Comptonization of an external radiation field to be efficient out to gamma-ray energies of GeV, the external radiation field has to peak at energies eV, i.e., in the near-infrared. Therefore, line emission from a putative broad-line region (for which there is no evidence in W Comae), would have a too high photon energy characteristic to serve efficiently as a source photon field for EC scattering to produce an IC spectrum with peak energy near the VHE gamma-ray band. It is therefore more likely that infrared emission, e.g., from a near-nuclear dust torus, dominates the external radiation field responsible for EC emission at VHE gamma rays. We find that an external radiation field peaking at Hz can, at the same time, serves as an efficient source for EC emission and explains the slight near-IR bump in the SED of W Comae. This bump could also be due to the host galaxy, and future observations of variability of the IR component or very high-resolution imaging are required to break this degeneracy. With the assumption of such an external radiation field, acceptable fits to each of the states of W Comae can be achieved within a factor of of equipartition. The parameters of our SSC+EC fit are listed in Table 6.
4 Conclusions
W Com belongs to the IBL class of blazars, a group with a now-growing number of VHE-detected blazars. Other blazars detected with VHE gamma rays that are not of the HBL class include the IBLs 3C 66A (Acciari et al, 2009) and PKS 1424+240 (Ong et al, 2009), low-frequency-peaked BL Lac objects (LBLs) such as BL Lacertae (Albert et al, 2007), and the flat-spectrum radio quasar 3C279 (Albert et al, 2008). In this article, we described a second VHE flare measured from W Com by VERITAS. The object was detected by VERITAS at a significance level of 10.3 standard deviations during 2008 June 7-8. The VERITAS observations triggered a multiwavelength campaign including AGILE gamma-ray, Swift and XMM-Newton X-ray, UV, optical and radio observations. We have carried out extensive modeling of the SED of W Com constructed from this contemporaneous multiwavelength data set, using a leptonic model considering synchrotron, SSC, and external-Compton emission. The SED can be modeled by a simple leptonic SSC model, but the wide separation of the peaks in the SED requires a rather low ratio of the magnetic field to electron energy density of . The SSC+EC model returns magnetic field parameters closer to equipartition, providing a satisfactory description of the broadband SED. These findings are similar to the results obtained from the first W Com VHE flare reported by Acciari et al (2008b).
The strong variability of W Com at X-ray and gamma-ray energies on time scales of days or less shows that only truly contemporaneous data can provide serious constraints on the various emission models. Future observations with VERITAS and the Fermi Gamma-Ray Space Telescope should provide even more detailed data to better resolve the short variability timescales, helping to further constrain model calculations.
References
- Abdo et al (2009a) Abdo, A.A. et al (Fermi LAT Collaboration) 2009a, ApJS, 183, 46
- Abdo et al (2009b) Abdo, A.A. et al (Fermi LAT Collaboration) 2009b, ApJ, 700, 597
- Acciari et al (2008a) Acciari, V.A. et al (VERITAS Collaboration) 2008a, ApJ, 679, 1427
- Acciari et al (2008b) Acciari, V.A. et al (VERITAS Collaboration) 2008b, ApJ, 684, L73
- Acciari et al (2008c) Acciari, V.A. et al (VERITAS Collaboration) 2008c, ApJ, 695, 1370
- Acciari et al (2009) Acciari, V.A. et al (VERITAS Collaboration) 2009, ApJ, 693, L104
- Aharonian (2000) Aharonian, F. 2000, New Astronomy, 5, 377
- Aharonian et al (2001) Aharonian, F. et al (HEGRA Collaboration) 2001, A&A, 370, 112
- Albert et al (2007) Albert, J. et al (MAGIC Collaboration) 2007, ApJ, 666, L17
- Albert et al (2008) Albert, J. et al (MAGIC Collaboration) 2008, Science, 320, 1752
- Aller et al (2003) Aller, M.F. et al 2003, ApJ, 586, 33
- Arnaud (1996) Arnaud, K. A. 1996; in ASP Conf. Ser. 101: Astronomical Data Analysis Software and Systems (ADASS) V, 17.
- Bach et al (2007) Bach, U. et al 2007, A&A, 464, 175
- Berge et al. (2007) Berge, D. et al. 2007, A&A, 466, 1219
- Böttcher & Chiang (2002) Böttcher, M. & Chiang, J. 2002, ApJ, 581, 127
- Böttcher et al (2002) Böttcher, M., Mukherjee, R. & A.Reimer 2002a, ApJ, 581, 143
- Burrows et al (2005) Burrows D. et al 2005, SSRv, 120, 165
- Cardelli et al (1989) Cardelli, J.A., Clayton, G.C., & Mathis, J.S. 1989, ApJ, 345, 245
- Dermer (1995) Dermer, C.D. 1995, ApJ, 446 L63
- Dickney & Lockman (1990) Dickney, J.M. & Lockman F.J. 1990; ARA&A. 28, 215
- Feroci et al (2007) Feroci, M., et al. 2007, Nucl. Instrum. Methods Phys. Res. A, 581, 728
- Fey et al (2004) Fey, A.L. et al. 2004, AJ, 127, 3587
- Fiorucci & Tosti (1996) Fiorucci, M. & Tosti, G. 1996, A&AS, 116, 403
- Fomin et al (1994) Fomin, V.P. et al 1999, Astroparticle Physics 2, 137
- Franceschini et al (2008) Franceschini, A. & Rodighiero, G. & Vaccari, 2008, A&A487, 837
- Gabriel et al (2004) Gabriel, C., Denby, M., Fyfe, D. J. et al. 2004; in ASP Conf. Ser. 314: Astronomical Data Analysis Software and Systems (ADASS) XIII, 759.
- Gehrels et al (2004) Gehrels, N. et al 2004, ApJ, 611, 1005
- Ghisellini & Madau (1996) Ghisellini, G. & Madau, P. 1996, MNRAS280, 67
- Hartman et al (1999) Hartman, R.C., et al. 1999, ApJS, 123, 79
- Helene (1983) Helene, O. 1983, Nuclear Instruments & Methods 212, 319
- Hillas (1985) Hillas M. 1985, Proc. of the 19th ICRC (La Jolla, USA), 3, 445
- Holder et al (2006) Holder, J. et al (VERITAS Collaboration) 2006, Astroparticle Physics 25, 391
- Jansen et al. (2001) Jansen, F. et al. 2001, A&A, 365, L1.
- Krawczynski et al. (2006) Krawczynski H. et al. 2006, Astroparticle Physics, 25, 380
- Li & Ma (1983) Li, T.P. & Ma, Y.Q. 1983, ApJ, 272, 317
- Mücke et al (2003) Mücke, A. et al 2003, Astroparticle Physics 18, 593
- Mohanty et al (1998) Mohanty, G. et al. 1998, Astroparticle Physics, 9, 15
- Nieppola et al (2006) Nieppola, E., Tornikoski, M. & Valtaoja, E. 2006 A&A, 445, 441
- Ong et al (2009) Ong, R.A. (VERITAS Collaboration) 2009, ATEL 2084
- Poole et al (2008) Poole T.S. et al 2008, MNRAS, 383, 627
- Roming et al (2005) Roming, P.W. et al 2005, Space Science Reviews, 120, 95
- Schlegel et al (1998) Schlegel, D.J., Finkbeiner, D.P., & Davis, M. 1998, ApJ, 500, 525
- Tagliaferri et al (2000) Tagliaferri, G. et al. 2000., A&A, 354, 431
- Tavani et al (2008a) Tavani, M., et al. 2008, Nucl. Instrum. Methods Phys. Res. A, 588, 52
- Teräsranta et al (1998) Teräsranta, H. et al, A&AS, 132, 305
- Vercellone et al (2008) Vercellone, S., et al. 2008, ApJL, 676, 13
- Verrecchia et al (2008) Verrecchia, F., et al. 2008, The Astronomer’s Telegram #1582
- Villata et al (2008) Villata, M. et al. 2008, A&A, 481,L79
- Weekes et al (2002) Weekes, T.C. et al 2002, Astroparticle Physics 17, 221
- Wing (1973) Wing, R.F. 1973, AJ, 78, 684
| Waveband | Observatory | Frequency/Band/ | MJD Range |
|---|---|---|---|
| Energy Range | |||
| Radio | UMRAO | 14.5 GHz | 54630-54633 |
| Metsähovi | 36.8 GHz | 54623-54634 | |
| Noto | 43 GHz | 54611 | |
| NIR/Optical/UV | NOT | U/B/V/R/I | 54636 |
| Tuorla | R | 54622 - 54645 | |
| Abastumani | R | 54617 - 54637 | |
| Sapienza University | R | 54627 - 54634 | |
| San Pedro Martir | R | 54620 - 54624 | |
| KVA | R | 54626 - 54633 | |
| Crimean | R | 54623 - 54627 | |
| Talmassons | R | 54628 | |
| Torino | R | 54630 | |
| Campo Imperatore | J/H/K | 54627 - 54633 | |
| Swift UVOT | U/B/V/UV | 54625 - 54626 | |
| X-ray | Swift XRT | 0.3-10 keV | 54625 - 54626 |
| SuperAGILE | 20-60 keV | 54626 - 54630 | |
| XMM-Newton EPIC | 0.2-10 keV | 54631 - 54635 | |
| HE Gamma-ray | AGILE GRID | 30 MeV - 30 GeV | 54626 - 54632 |
| VHE Gamma-ray | VERITAS | 0.1-30 TeV | 54624 - 54626 |
| MJD | elevation | observation | average pedestal | significance | flux or |
|---|---|---|---|---|---|
| range | time | variationsaaThe average pedestal variation in digital counts [dc] indicates the background light level. Values of 6.5 to 6.8 are typical for regular observations of extragalactic targets on moonless nights. All observations presented here are taken in moonlight conditions. | (pre-trials) | upper flux limit | |
| [min] | [dc] | [] | [cm-2 s-1] | ||
| 54624.16 - 54624.23 | 53-73o | 100.2 | 7.8-8.0 | 8.9 | |
| 54625.17 - 54625.24 | 49-68o | 100.2 | 8.1-9.7 | 7.9 | |
| 54626.18 - 54626.20 | 59-60o | 32.0 | 12.2-12.3bbData taken with increased pixel (PMT) trigger threshold (at 70 mV CFD trigger threshold instead of the regular 50 mV). | -1.0 |
| MJD | significance | flux or |
|---|---|---|
| (pre-trials) | upper flux limits | |
| [cm-2 s-1] | ||
| 54626.75 - 54629.12 | ||
| 54629.12 - 54630.12 | ||
| 54630.12 - 54632.50 |
| MJD | Exposure | Photon index | Flux F2-10keV |
|---|---|---|---|
| [ksec] | [10-12 ergs cm-2 s-1] | ||
| 54624.97 - 54624.98 | 0.52 | ||
| 54625.04 - 54625.05 | 0.84 | ||
| 54625.11 - 54625.12 | 1.38 | ||
| 54625.17 - 54625.20 | 2.51 | ||
| 54625.24 - 54625.27 | 2.47 | ||
| 54626.11 - 54626.21 | 5.07 |
| MJD | Exposure | NH | Photon index | Flux F2-10keV |
|---|---|---|---|---|
| [ksec] | [1020 cm-2] | [10-12 ergs cm-2 s-1] | ||
| 54631.50 - 54631.55 | 28.0 | 2.20 | 2.79 | 2.69 |
| 54633.15 - 54633.17 | 16.0 | 1.39 | 2.88 | 1.53 |
| 54635.14 - 54635.16 | 11.0 | 1.05 | 2.77 | 1.89 |
| Parameter | Symbol | SSC | SSC+EC |
|---|---|---|---|
| Doppler factor | 20 | ||
| Electron power [erg s-1] | |||
| Blob radius [cm] | |||
| Low-energy cutoff | |||
| High-energy cutoff | |||
| Electron injection index | 2.55 | 2.55 | |
| Magnetic field [G] | 0.24 | 0.35 | |
| B-field equipartition parameter | 0.32 | ||
| Electron escape time scale parameter | 300 | 300 | |
| Minimum variability time scale [hr] | 1.5 | 5.1 | |
| External radiation peak frequency [Hz] | – | ||
| External radiation energy density [erg cm-3] | – |