Extragalactic CS survey
Abstract
We present a coherent and homogeneous multi-line study of the CS molecule in nearby (D10Mpc) galaxies. We include, from the literature, all the available observations from the to the transitions towards NGC 253, NGC 1068, IC 342, Henize 2-10, M 82, the Antennae Galaxies and M 83. We have, for the first time, detected the CS(7-6) line in NGC 253, M 82 (both in the North-East and South-West molecular lobes), NGC 4038, M 83 and tentatively in NGC 1068, IC 342 and Henize 2-10. We use the CS molecule as a tracer of the densest gas component of the ISM in extragalactic star-forming regions, following previous theoretical and observational studies by Bayet et al. (2008a,b and 2009). In this first paper out of a series, we analyze the CS data sample under both Local Thermodynamical Equilibrium (LTE) and non-LTE (Large Velocity Gradient-LVG) approximations. We show that except for M 83 and Overlap (a shifted gas-rich position from the nucleus NGC 4039 in the Antennae Galaxies), the observations in NGC 253, IC 342, M 82-NE, M 82-SW and NGC 4038 are not well reproduced by a single set of gas component properties and that, at least, two gas components are required. For each gas component, we provide estimates of the corresponding kinetic temperature, total CS column density and gas density.
1 Introduction
Detection of star-forming gas is one of the most direct ways to measure the star formation rate and activity in a galaxy, allowing us to significantly improve our understanding of galaxy formation and evolution. Star-forming regions of very dense gas (n(H2)cm-3) are needed to maintain star formation activity, even in hostile environments associated with young massive stars. In these environments, star-forming regions are able to resist the disruptive forces (winds or radiation) from nearby newly formed stars longer than the local gas in the local interstellar medium (Klein et al., 1983; Larosa, 1983). Determining the physical conditions of the very dense gas in which massive stars form is, thus, essential. In this paper, we study such dense gas and estimate its properties over a large range of nearby galaxy types.
Following theoretical studies by Bayet et al. (2008b) and the first detections of extragalactic very dense gas presented in Mauersberger & Henkel (1989); Mauersberger et al. (1989); Walker et al. (1990); Martín et al. (2005, 2006a, 2006b); Bayet et al. (2008a); Greve et al. (2009), we have carried out multi-line observations of the CS molecule in nearby (D10Mpc) extragalactic environments, enhancing significatively the current data set of extragalactic CS observations. Indeed, CS lines have not been observed so far but in few brightest nearby nuclei such as NGC 253, IC 342 and M 82 and mainly in their lower-J rotational levels (see references above). Hence, the physical properties of such galaxies namely the kinetic temperature, gas density, etc were estimated using only a small sample of CS lines. Gas traced by higher-J of species such as CS has not be characterized so far. In addition, even for the brightest sources (e.g. NGC 253 and M 82), no study of the various velocity components nor various positions in the same galaxy has been performed so far in a systematic way. In this paper, first of a series, we thus aim at investigating in much more details the very dense gas properties in many extragalactic sources as traced by the CS molecule.
Sulphur-bearing species are shown to be particularly enhanced during massive star formation, while species such as HCN, although a useful dense gas tracer, may not be tracing the sites where star formation occurs (Lintott & Viti, 2006). Recently, Martín et al. (2005) showed that sulfur emission in the nuclear region of the nearby starburst galaxy NGC 253 is very strong. Amongst sulfur-bearing species, the CS molecule appears as one of the best tracers of dense gas, especially its high-J rotational transitions such as the CS line with an excitation threshold higher than 104-105 cm-3 (Bronfman et al., 1996) and the CS line with a critical density of n cm-3 (Plume et al., 1992).
Selection of nearby sources where we have proposed to observe the CS lines was made through a comparison with past and recent CS observations (see references above). Sources where no CS detections were available from the literature (e.g. Henize 2-10) were chosen on the basis of the detections of the CO(6-5) or CO(7-6) lines since these lines are also good tracers of a relatively dense and quite warm gas (Bayet et al., 2004, 2006). The source selection also aimed at presenting various nearby galaxy types where CS line emission can be studied and compared. This sample is far from being unbiased but it gathers so far the most complete CS data sample ever obtained in extragalactic sources.
Thus, the centers of NGC 253, IC 342, Henize 2-10, the two molecular lobes of M 82 (North-East and South-West positions), three positions in the Antennae Galaxies (the two nuclei: NGC 4038 and NGC 4039, and a shifted position from NGC 4039 called Overlap) and the center of M 83 were selected, covering a large range of galaxy types and star-formation activities (starburst, irregular, merging galaxies, more quiet star-forming galaxies, etc). We have also included in our source sample the center of NGC 1068 (AGN-dominated galaxy) where HCN has been detected (Planesas et al., 1991; Krips et al., 2008).
We present our observations, data reduction and results in Sect. 2. In Sect. 3 we analyze the data set both under Local Thermodynamical Equilibrium (LTE) and non-LTE (Large Velocity Gradient-LVG) approximations (see Subsects. 3.1 and 3.2). In Sects. 4 and 5 we discuss our findings and conclude, respectively.
2 Observations and Results
2.1 Observational parameters
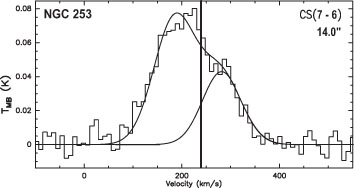
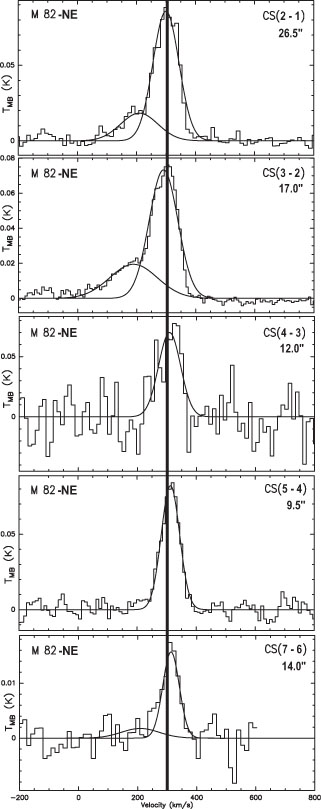
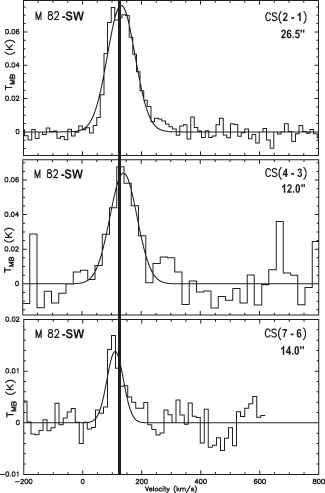
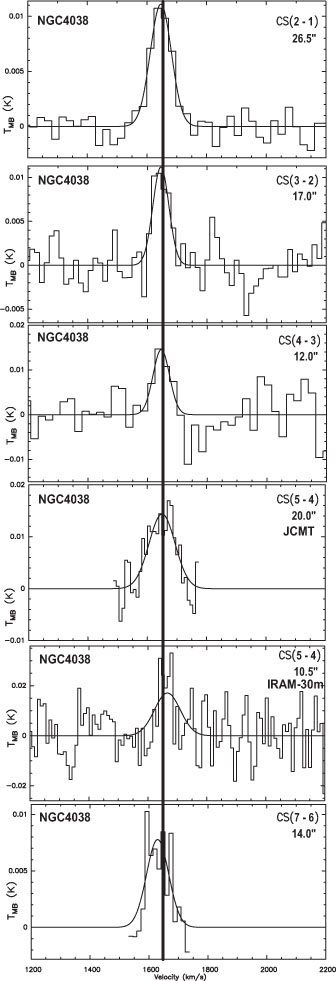
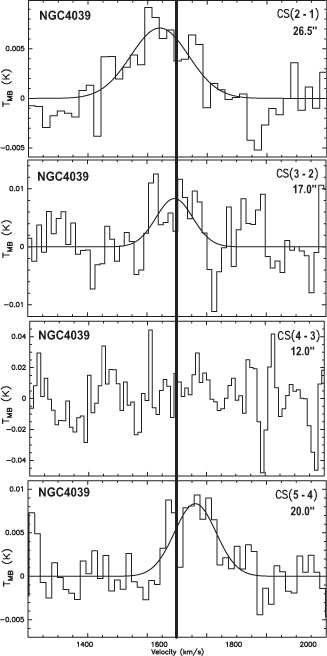
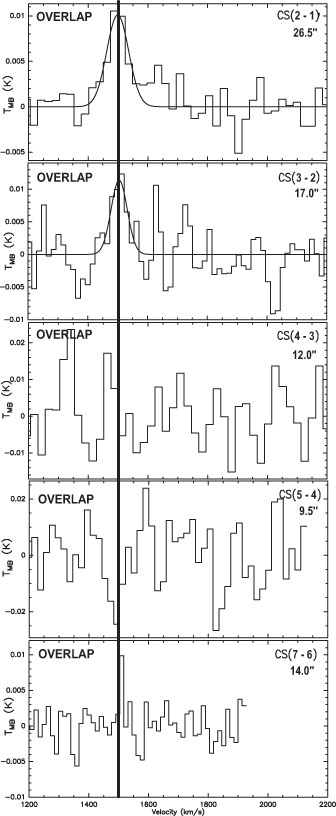
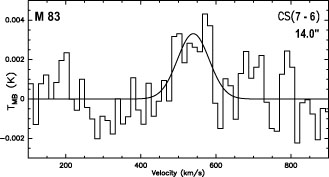
The observations have been performed using the IRAM-30m telescope for the CS(2-1), CS(3-2) and CS(4-3) lines ( 97.980 GHz, 146.969 GHz and 195.954 GHz, respectively) and the James Clerk Maxwell Telescope (JCMT) for the detection of the CS(7-6) transition ( 342.883 GHz). Every two-three hours, when using both telescopes, the pointing, focus and calibration were performed carefully on planets (Mars and Jupiter) and on evolved stars. The pointing error was estimated to be 3′′ in both cases. We have observed the CS(5-4) line with both telescopes but we have not averaged the signals because the weather conditions were significantly different. Between the two telescope observational sessions, for all the sources but NGC 4038, we have kept the less noisy spectrum (i.e. the spectrum showing the highest S/N ratio). These (reduced) spectra are shown in Figs. 1 to 10 and their Gaussian fitting parameters are seen in Table 1. Unfortunately, for NGC 4038, the reduced spectra obtained with the IRAM-30m and with the JCMT are equally noisy (i.e. they have similar S/N ratio) and thus we present both spectra in Fig.7.
The IRAM-30m telescope observations were carried out in June 2008 under various weather conditions ( 1.5-6 mm of water vapor). Scans were taken using the wobbling secondary with a throw of 120′′ for the two positions in M 82 (NE and SW components) while for the Antennae positions (NGC 4038, NGC 4039 and Overlap) we have used the position switching mode with a larger throw of 1′ (reference positions are indicated in columns 12 and 13 of Table 1). The 100 GHz, 150 GHz, 230 GHz and 270 GHz receivers (A/B/C/D) were used under several configurations, optimizing the allocated time. The 1 MHz and 4 MHz backends were used providing velocity resolution between 1.2 kms-1 (at 244 GHz) and 3.0 kms-1 (at 98 GHz), and, 4.9 kms-1 (at 244 GHz) and 12.3 kms-1 (at 98 GHz), respectively. At the observed frequencies of 97.980 GHz, 146.969 GHz, 195.954 GHz and 244.936 GHz, the IRAM-30m has a HPBW of 25′′, 17′′, 13′′ and 10′′ with main beam efficiencies of 0.75, 0.69, 0.65, 0.52111See IRAM-30m website: http://www.iram.es/IRAMES/ mainWiki/AbcdforAstronomers, respectively. The system temperature ranged from 200 K to 1800 K, depending on the frequency and the weather conditions. The data reduction was performed using the CLASS program of the GILDAS package developed at IRAM.
We have used the JCMT in March 2007, February 2008, July 2008 and February 2009 under medium weather conditions ( 0.15). We have either used a beam switch mode with a throw of 180′′ or a position switch mode with hard off-source reference, depending on the source. We have used the RxA3 and the 16-pixel camera HARP receivers for the detection of the CS(5-4) and the CS(7-6) transitions, respectively. The ACSIS digital autocorrelation spectrometer with a bandwidth of 1000MHz was used at both frequencies and in all the sources because the lines were expected to be broad (see Figs. 1 to 10). The HPBW and the main beam efficiencies of the JCMT at 244 GHz and 343 GHz are 20′′, 14′′ and 0.69, 0.63222See JCMT website: http://www.jach.hawaii.edu/JCMT/ instruments/, respectively (see Table 1). The system temperatures ranged between 200 K and 400 K. The data pre-reduction was done using Starlink softwares (KAPPA, SMURF, and STLCONVERT packages) and subsequently translated to CLASS format for final reduction.
All the spectra obtained are shown in Figs. 1 to 10 while the Gaussian fit parameters are listed in Table 1. In this Table, we have also included detections of CS lines from the literature (see references mentioned in the last column of the table). Hence this table contains the most complete compilation of CS transitions observed in external galaxies.
2.2 Results
For each source, we find a general good agreement between the Gaussian fits and the observations (see Figs. 1 to 10). Table 1 also shows that the velocity positions of the lines and the line widths of the CS transitions are consistent among each other and with previous data from the literature.
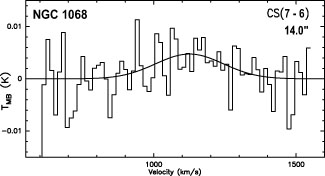
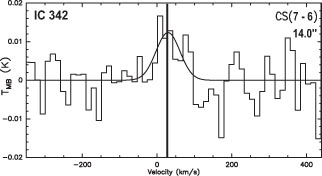
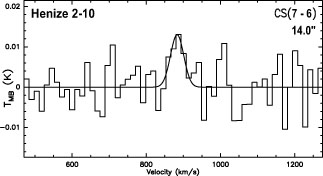
For some sources, some lines of CS are only marginally detected. For instance, the CS(7-6) line in NGC 1068 (Fig. 2) and in IC 342 (Fig. 3) have both a signal-to-noise ratio lower than 3 and thus can not been considered as detections. We have also obtained for NGC 4039 a hint of a marginal detection but due to the uncertainty on the velocity position of the line, we have not shown the spectrum. Except for NGC 4039, in all the marginal cases presented here, the fitted line width and velocity position match those expected either from lower-J CS lines (when available) or in the case where no other CS lines are available, from other molecular lines such as CO as in the case of the CS(7-6) line in Henize 2-10. For this source, we have derived an upper limit of the source-averaged CS column density of N(CS)cm-2 from the CS(7-6) marginal detection, using a source size of 13′′ (see Meier et al. 2001; Bayet et al. 2004). Due to the fact that there is only one CS observation so far (see Fig. 4), we have excluded Henize 2-10 from the data analysis presented in Sect. 3.
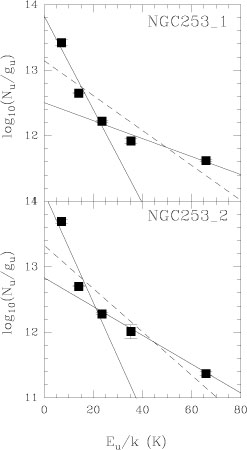
For NGC 253, based on the literature, it is expected that some CS detections show a double peak emissions corresponding to two gas components (see Martín et al. 2005 and Fig 1). Thus, in NGC 253, we have called NGC 253-1, the gas component whose line emission is located at a velocity position of about 180-200kms-1 while NGC 253-2 corresponds to the higher velocity gas component located at about 280-300kms-1. A two-components Gaussian fit has thus been applied. We have listed the fit parameters obtained in Table 1.
In some of the M 82-NE CS spectra (see Fig. 5), one also notice a double peak emission. However the nature of this emission differs significantly from the one observed in NGC 253. Indeed, after having compared Fig. 5 with the data from Bayet et al. (2008a), we have concluded that the weaker peak (seen on the left side of the spectra) corresponds to a contamination from the nucleus (partially included into the telescope beam). We have thus excluded such emission from the analysis performed in Subsects. 3.1 and 3.2.
3 Molecular excitation
3.1 LTE analysis
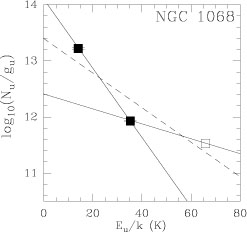
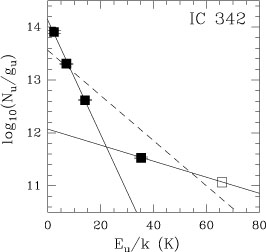
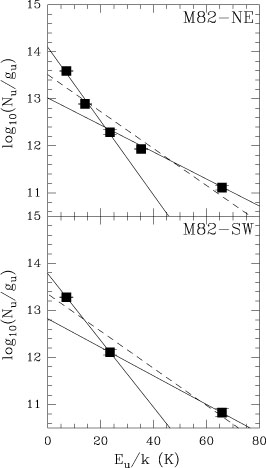
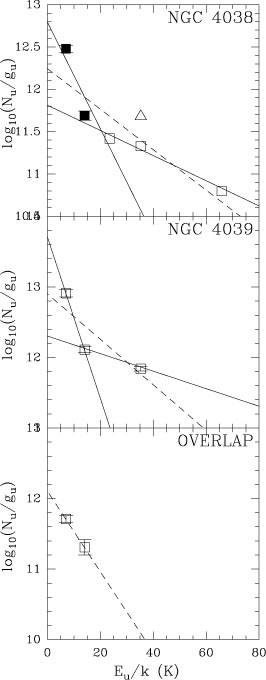
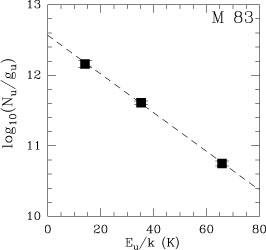
To obtain an estimation of the kinetic temperature and the total CS column density in the various extragalactic star-forming regions we survey here, we have used first the rotational diagram method, corrected for beam dilution effects and assuming optically thin emission (antennae temperature proportional to the column density in the upper level of the observed transition). The beam dilution effect has been removed assuming a source size of 20′′, 20′′, 4′′, 6′′, 6′′, 8.5′′, 7′′, 5.5′′, 20′′ and 5′′ for NGC 253-1, NGC 253-2, NGC 1068, IC 342, M82-NE, M 82-SW, NGC 4038, NGC 4039, Overlap and M 83, respectively. These values have been selected from the available maps of CS published in the literature or from maps of other tracers of dense gas. When neither was available, we have used, by default, interferometric CO maps. Namely, for the NGC 253 source size, we refer to the CS(2-1) map of Peng et al. (1996), in agreement with the values used for SO2, NS and NO emission (tracers of relatively dense gas) presented in Martín et al. (2003). For NGC 1068, we have used the HCN maps from Helfer & Blitz (1995) and Krips et al. (2008) for deriving the CS emitting source size. For IC 342, we base our estimation on the HCN interferometric map of Schinnerer et al. (2008) whereas for M 82, we used SiO and HCO interferometric maps from García-Burillo et al. (2001, 2002), respectively. For the three positions in the Antennae Galaxies, we have used the interferometric CO map from Wilson et al. (2000) as an upper limit of the CS emitting source size while for M 83, we have used the recent HCN interferometric map of Muraoka et al. (2009). In Figs. 11 to 16, we show the resulting rotational diagrams for all the sources.
The rotational diagram approach (see Goldsmith & Langer 1999 and appendix in Turner 1991; Girart et al. 2002; Martín et al. 2005) assumes the gas in Local Thermodynamical Equilibrium (LTE). If correct, then the data are well fitted by a linear regression using a single-component. In fact, assuming LTE in rotational diagrams implies that the rotational temperature is equal to the excitation temperatures of all the observed transitions. As the gas may not be thermalized, the derived rotational temperature is thus a lower limit to the kinetic temperature.
The LTE solutions are shown in Figs. 11 to 16 by dashed lines (single-component fit)333The fits have been performed by the xmgrace software.. As clearly shown by the figures, most of the data are not well fitted by a single-component fit. This is not surprising since it is expected that the gas contained in the nucleus of galaxies such as NGC 253, IC 342, etc is not in thermal equilibrium. Thus, to better reproduce the data, we have adopted a very simple approach assuming that, when the single-component fit is not applicable, at least, two gas components exist in the observed regions: one responsible for the low-J CS emission and one for the high-J CS line emissions. The fits performed with two components are shown by solid lines in Figs. 11 to 15. Note however that when a source shows two clear detections and an upper limit, our approach is crude. Whereas we simply fitted the rotation diagrams with two temperature components, it is clear that there is a continuum change of the excitation temperature.
The exceptions to this approach are M 83 and the Overlap position. Indeed, for these sources, the CS data appear to be well fitted by a single-component fit. This means that, in these sources, the gas might be more homogeneously distributed than in other sources. This feature has already been observed in M 83 with the CO data (Bayet et al., 2006). Bayet et al. (2006) indeed showed that the same gas component well reproduce the CO(3-2), CO(4-3) and CO(6-5) lines in the center of M 83, the requirement for another (colder) gas component appearing only when considering lower-J CO lines. The current rotational diagram for M 83 and Overlap contains only three and two CS detections, respectively. It may be that two-components fit may be necessary once the CS(1-0), CS(2-1), CS(4-3) lines will be observed in M 83 and when the CS(1-0), CS(4-3), CS(5-4) and CS(7-6) transitions will be added to the rotational diagram of Overlap.
In Figs. 11 to 16, we have used different symbols to represent marginal detections (open white squares) and detections (black filled squares). For NGC 4038, two CS(5-4) (marginal) detections exist. We have shown the IRAM-30m one with an open white triangle and the JCMT with an open white square since it appears in better agreement with the rest of the data and shows a higher signal-to-noise ratio (see Fig. 7 and Table 1).
The rotational temperatures we have obtained for each source are listed in Table 2. The typical uncertainties on the rotational temperatures are of 5%-6%. We have also derived the source-averaged total column densities N(CS) for each component in each source (see Table 2). For determining such values, we have used the partition function from the CDMS website444See http://www.astro.uni-koeln.de/site/vorhersagen/catalog/ partition_function.html, extrapolating their values to the range of rotational temperatures listed in Table 2 (linear interpolation applied).
Below, we compare our results with those available in the literature.
-
-
NGC 253: As expected, the CS column densities for both NGC 253-1 and NGC 253-2 sources (low- and high-velocity component of NGC 253) are in agreement with the values derived by Martín et al. (2005). Indeed, for the NGC 253-1 source the CS column density we have computed for the single-component fit is in agreement within a factor of 0.9. For the NGC 253-2 source, the CS column density for the single-component fit is in agreement within a factor of 1.8. The differences between these two studies originate clearly from the presence of the new CS(7-6) observations. This transition reveals or confirms in most of the cases the need of at least one more component to better reproduce the data.
-
-
IC 342: Mauersberger et al. (1989) have also observed in various CS transitions the center of the galaxy IC 342. They estimated the column density to be N(CS)=cm-2, in agreement (with a factor of 0.5) with our estimate (single-component fit).
-
-
Molecular lobes in M 82: M 82-NE and M 82-SW lobes have never been observed previously in any CS lines. However, Bayet et al. (2008a) showed that in the center of M 82, the CS column density is estimated to be N(CS)=cm-2. This is of the same order of magnitude of the values presented in Table 2 (single-component fit) for the lobes positions.
-
-
The Antennae Galaxy: Similarly to the lobes in M 82, no CS detection has been published so far neither in NGC 4039 nor in the Overlap position in the Antennae Galaxies. Only for NGC 4038 Bayet et al. (2008a) have obtained N(CS)=cm-2 (from the single CS(5-4) observation). This estimate is in agreement with the values listed in Table 2 (single-component fit).
- -
In the Antennae Galaxies case, using CO data for representing the more compact (CS) emitting source size is misleading and can cause large uncertainties on the results as shown by Helfer & Blitz (1995) for NGC 1068. Taking NGC 4038 as a representative example, we have thus investigated the influence of the source size choice on the results (LTE and non-LTE models, see Subsect. 3.2) in the following way:
-
1.
We have compared the physical parameters of column density and temperature derived assuming a source extent of 7 ′′, with those obtained by assuming sizes of , and smaller (i.e. 5.25 ′′, 3.5 ′′ and 1.75 ′′) similar to all transitions. We have rebuilt consistently the rotational diagrams and re-calculated in the same way as previously described, the rotational temperature and the total CS column densities values. When these values were compared to those obtained in the case of a 7 ′′ source size, we have obtained rotational temperatures difference less than 7% and column densities differences within a factor of 14.8 (for the smallest size considered), whatever the number of component considered (see Table 2).
-
2.
We compared the result of a common 7 ′′ source size for all transitions with the case of a gradually smaller size for the higher transitions. Starting with a source size of 7 ′′ for the CS(2-1) transition, we assumed a 20% smaller size for the 3-2 and the 4-3 (i.e. 5.6′′) and an additionally 20% decrease in the size for the 5-4 and the 7-6 (i.e. ). When comparing these cases with the case of a 7′′ source size applied homogeneously to all the CS lines, it resulted a 15%-30% difference in rotational temperatures and less than a factor of 2 in column density.
As shown in both cases (see Table 2), though the column densities might be significantly affected by the assumed source extent, both the derived rotational temperatures and therefore the different temperature components described in this paper will be basically unaffected.
In all the cases dealt with above, the CS line ratios used for constraining the LVG model do change by no more than a factor of 1.5 (for the CS(7-6)/CS(4-3) line ratio). Considering the degeneracy of the LVG models, as noted in Sect. 3.2, we thus believe that these variations of line ratios are negligible and that the results presented in Table 3 still provide qualitative estimates of the properties of the gas emitting the CS lines.
3.2 non-LTE models
It is well-known that rotational diagrams give only approximate estimates of the kinetic temperature and the column density. To get more accurate values, we have ran Large Velocity Gradients (LVG) models (Goldreich & Kwan, 1974; de Jong et al., 1975). These models are described in various papers and the version we use in this study is the one presented in Bayet et al. (2004, 2006, 2008a). The LVG model runs with three free parameters: the gas density n(H2), the kinetic temperature (Tk) and the CS column density divided by the line width (N(12CS)). Using as model constraints the integrated line intensities ratios computed from Table 2, and corrected for beam dilution effect (as done in Subsect. 3.1), we have investigated the following range of LVG input parameters : 5K T 150K, cm-2(kmsN(12CS)555We have assumed for all the sources and line profiles a kms-1cm-2(kms and cmn(H2)cm-3.
For determining the set of parameters (TK, n(H2), N(12CS)) able to reproduce best the observations, we have constrained the predicted CS line intensity ratios with the observed values via a reduced method as performed in Bayet et al. (2004, 2006, 2008a), including 20% uncertainties on the observed integrated line intensities. Except for M 83 and Overlap, we have separated the models results into two: the low-temperature component constrained by, for example, line intensity ratios such as CS(3-2)/CS(2-1) or CS(4-3)/CS(2-1), and the high-temperature component characterized by, for example, line intensity ratios such as CS(5-4)/CS(4-3) or CS(7-6)/CS(4-3). The choice of the CS line intensity ratios used for calculating the depends on the source and the available data set for CS (see Table 1). For M 83 and Overlap, since the CS data are well arranged alongside a line in the rotational diagram, only a single-temperature component model has been investigated using the available CS detections. The physical properties which reproduce best the observations are summarized in Table 3.
Unfortunately, as already shown by e.g. Bayet et al. (2004, 2006) and Martín et al. (2005, 2006a), there is no unique solution for reproducing the observational line ratios of each gas component, in each galaxy. Indeed, it is well-known that degeneracies in the physical parameters predictions exist in LVG models. To remove this degeneracy and obtain more accurate estimations of the physical parameters, one should correlate LVG models solutions obtained for various molecular species. However, this methodology is only effective if all species are emitted from the same gas phase (see e.g. Martín et al. 2005, 2006a). For most of the sources observed here, no other tracers of very dense gas (n(H2) ) has been detected so far. We thus did not cross correlate our LVG results with those from other molecular emission.
4 Discussion
We find that CS is indeed tracing very dense gas. For most sources, low-J and high-J CS lines trace different components. The low-temperature component, on average over the sources, has a T 30K, N(CS)cm-2 and n(H2)cm-3, while the high-temperature component has a T 45K with N(CS)cm-2 and n(H2)cm-3. For the brightest sources, we compared the physical properties of these two CS components with the physical properties derived from other tracers of dense gas, when available. For the M 82-NE and M 82-SW molecular lobes, the low-temperature CS component is in very good agreement with the low-temperature component of methanol (see Martín et al. 2006a). Indeed their predicted (from LVG) kinetic temperatures are in agreement within a factor of 2-3 while the gas densities and the column densities are in agreement within a factor of 3 and 2, respectively. Similarly, the physical properties of the high-temperature component of the CS is in good agreement with those of the high-temperature component of the methanol. Hence, it may be that the warm and dense methanol gas (respectively cold and less dense methanol gas) might be well mixed with the warm and dense CS gas (respectively cold and less dense CS gas) in these two positions. We do not know if this correlation is common to all PDR-dominated galaxies, or if it depends on the galaxy type. Unfortunately, in the literature, no sample of methanol lines as complete as the one provided by Martín et al. (2006a) for M 82 exists. Detections of methanol in another starburst-dominated galaxy, NGC 253, exist (see e.g. Martín et al. 2006b) but the authors do not distinguish between NGC253-1 and NGC253-2 and do not provide LVG predictions. In the same vein, in pure AGN-dominated galaxies (such as NGC 1068) or in merging-dominated systems (such as the Antennae Galaxies), no large sample of methanol lines have been analyzed under LVG approximations so far.
Similarly to the molecular lobes of M 82, in both NGC253-1 and NGC253-2, the low-temperature CS component show physical properties in very good agreement with the properties derived for HCN (single-temperature component whose properties are derived using an LTE analysis; see Martín et al. 2006b). The rotational temperature for HCN and CS in NGC253-1 (and NGC 253-2) are in agreement within a factor of 2 (respectively 1.4) while the HCN and the CS column densities in NGC253-1 (and NGC 253-2) agree within a factor of 1.5 (respectively 2.9). Similarly, in both NGC 253 sources, the high-temperature CS component show physical properties in agreement with those derived from HCO+, H2CO and HNC (single-temperature component whose properties are derived using an LTE analysis; see Martín et al. 2006b). This shows that the HCN and the low-temperature CS gas on one side, and the HCO+, H2CO, HNC and the high-temperature CS gas on the other side form two distinguished groups.
Furthermore, it is of particular interest to compare CS and HCN data in NGC 1068 (AGN-dominated galaxy). For this source, Krips et al. (2008) presented a low-temperature HCN component from LVG modelling constrained by a reasonable sample of HCN lines. This HCN gas component has TK, n(H2), N(CS) = 20K, cm-3, cm-2 which is a less dense and higher column density component than either our low-temperature or our high-temperature CS component. However, taking into account the limitations and uncertainties of LVG models, it may not be appropriate to compare the two sets of data.
In parallel, for M 82-NE and M 82-SW molecular lobes, Table 1 shows a significant narrowing of the FWHM of the CS(7-6) lines, as compared with the FWHM of the lower-J CS transitions. This feature has already been observed and analyzed by Bayet et al. (2008a) in the nucleus position. They interpreted this characteristic as the presence of multiple gas components in the source, the CS(7-6) line tracing a gas component warmer and denser than the gas traced by lower-J CS lines. Population rotational diagrams as well as LVG analysis (see Subsects. 3.1 and 3.2) confirm that this feature also appears in the molecular lobes of M 82. However such narrowing does not appear in the other sources. Observations of the CS(7-6) transition in a larger sample of galaxies are needed in order to reveal very dense gas properties in PDR-dominated galaxies.
5 Conclusions
In order to better determine the properties of the very dense star-forming gas over a large range of physical conditions, we present the most complete, extragalactic CS survey ever performed on nearby galaxies. In particular, we detect for the first time the CS(5-4) and CS(7-6) lines, in various environments such as starburst, AGN-dominated galaxies, irregular galaxies, merging galaxies, etc.
In this first paper out of a series, we simply analyzed the data through a rotational diagram method and an LVG modelling and we show that for most sources at least two gas components are needed to reproduce the observations. The low-temperature gas component properties, derived from the CS(2-1), CS(3-2) and CS(4-3) lines (low-J CS lines), vary from source to source within the range TK, n(H2), N(CS) = 10-30K, 0.16-1.60cm-3, 0.25-6.30cm-2, respectively. The high-temperature gas component properties, derived from the CS(5-4) and CS(7-6) lines (high-J CS lines), vary from source to source within the range TK, n(H2), N(CS) = 45-70K, 6.30-40.0cm-3, 0.16-1.00cm-2, respectively. We also show that, using the current data set of CS observations, in Overlap and M 83, it appears that the very dense gas may be more homogeneously distributed than in other nearby sources.However, we again underline here that our estimates of the physical properties of these galaxies suffer from LVG degeneracy.
Comparison with other tracers of dense gas such as HCN, HNC, HCO+, etc even in the brightest sources of our sample is very difficult to perform. However, in the molecular lobes of M 82, we have been able to show a good correlation between the CS and the methanol. In both NGC 253-1 and NGC 253-2, we showed that the HCN and the low-temperature CS gas on one side, and the HCO+, H2CO, HNC and the high-temperature CS gas on the other side have compatible rotational temperatures and column densities.
In pure AGN-dominated galaxy such as NGC 1068, we find no correlation between the HCN and CS.
Forthcoming papers will focuss on detailed studies of the very dense gas properties in individual nearby sources, investigating for instance their dense gas star-formation efficiencies, their dense gas masses based on CS modelling, etc, as well as on a more statistical analysis such as Kennicutt-Schmidt laws in both extragalactic and galactic sources.
| Source | Line | Tsys | beam | Telesc. | (Tmb dv) | Vpeak | FWHM | Tpeak | rms | RA(J2000) | DEC(J2000) | Refs1 | |
| size | name | ||||||||||||
| (GHz) | (K) | (′′) | (Kkms-1) | (kms-1) | (kms-1) | (mK) | (mK) | (h:m:s) | (∘ : ’ : ”) | ||||
| NGC 253-1 | CS(2-1) | 97.980 | - | 51.0 | SEST | 4.40.5 | 172 | 96 | 43.4 | 5.2 | 00:47:33.4 | -25:17:23.0 | d |
| CS(3-2) | 146.969 | - | 16.7 | IRAM-30m | 11.90.2 | 185 | 100 | 111.2 | 4.1 | ” | ” | d | |
| CS(4-3) | 195.954 | - | 12.6 | IRAM-30m | 11.50.4 | 185 | 100 | 108.2 | 7.0 | ” | ” | d | |
| CS(5-4) | 244.936 | - | 21.0 | SEST | 4.40.4 | 158 | 107 | 38.2 | 10.8 | ” | ” | d | |
| CS(7-6) | 342.883 | 679 | 14.0 | JCMT | 7.90.3 | 1852 | 110.14.4 | 67.1 | 5.1 | ” | ” | a | |
| NGC 253-2 | CS(2-1) | 97.980 | - | 51.0 | SEST | 8.20.5 | 290 | 116 | 66.5 | 5.2 | 00:47:33.4 | -25:17:23.0 | d |
| CS(3-2) | 146.969 | - | 16.7 | IRAM-30m | 13.70.2 | 288 | 117 | 110.3 | 4.1 | ” | ” | d | |
| CS(4-3) | 195.954 | - | 12.6 | IRAM-30m | 13.40.5 | 288 | 121 | 104.5 | 7.0 | ” | ” | d | |
| CS(5-4) | 244.936 | - | 21.0 | SEST | 5.41.3 | 262 | 108 | 46.7 | 10.8 | ” | ” | d | |
| CS(7-6) | 342.883 | 679 | 14.0 | JCMT | 4.40.3 | 2882 | 107.17.1 | 38.7 | 5.1 | ” | ” | a | |
| NGC 1068 | CS(3-2) | 146.969 | 600 | 16.7 | IRAM-30m | 9.11.5 | 1100 | 245.0 | 30.0 | 10.0 | 02:42:40.7 | -00:00:47.6 | e |
| CS(5-4) | 244.936 | - | 10.0 | IRAM-30m | 3.30.3 | 11259.0 | 180.020.0 | 17.6 | 3.0 | ” | ” | f | |
| CS(7-6) | 342.883 | 307 | 14.0 | JCMT | 1.40.5 | 1125.449.0 | 279.099.3 | 4.8 | 8.1 | ” | ” | a | |
| IC 342 | CS(1-0) | 48.991 | 350-550 | 36.0 | NRO | 2.50.4 | 30 | 50-60 | 50.0 | 12.0 | 03:46:48.3 | 68:05:46.0 | g |
| CS(2-1) | 97.980 | 188 | 25.1 | IRAM-30m | 5.00.1 | 31.70.6 | 53.91.5 | 87.4 | 2.5 | ” | ” | c | |
| CS(3-2) | 146.969 | 225 | 16.7 | IRAM-30m | 4.90.1 | 31.20.6 | 51.71.6 | 88.6 | 3.0 | ” | ” | c | |
| CS(5-4) | 244.936 | 378 | 10.0 | IRAM-30m | 2.50.2 | 38.22.0 | 63.45.1 | 37.6 | 2.9 | ” | ” | c | |
| CS(7-6) | 342.883 | 525 | 14.0 | JCMT | 1.00.4 | 29.315.3 | 75.630.6 | 12.3 | 8.5 | ” | ” | a | |
| Henize 2-10 | CS(7-6) | 342.883 | 252 | 14.0 | JCMT | 0.60.2 | 883.17.4 | 42.016.1 | 13.0 | 7.4 | 08:36:15.2 | -26:24:34.0 | a |
| M 82_NE | CS(2-1) | 97.980 | 236 | 25.1 | IRAM-30m | 9.40.2 | 299.91.3 | 103.43.3 | 85.7 | 8.5 | 09:55:54.4 | 69:40:54.6 | a |
| CS(3-2) | 146.969 | 278 | 16.7 | IRAM-30m | 8.90.1 | 290.90.7 | 114.62.0 | 73.3 | 1.7 | ” | ” | a | |
| CS(4-3) | 195.954 | 1425 | 12.6 | IRAM-30m | 6.50.8 | 309.26.1 | 87.712.1 | 70.1 | 17.2 | ” | ” | a | |
| CS(5-4) | 244.936 | 772 | 10.0 | IRAM-30m | 6.40.2 | 313.01.1 | 73.52.6 | 82.1 | 4.8 | ” | ” | a | |
| CS(7-6) | 342.883 | 309 | 14.0 | JCMT | 1.10.2 | 313.24.4 | 58.16.8 | 15.7 | 2.9 | ” | ” | a | |
| M 82_SW | CS(2-1) | 97.980 | 237 | 25.1 | IRAM-30m | 8.90.2 | 131.41.2 | 109.82.7 | 75.9 | 3.8 | 09:55:49.4 | 69:40:39.6 | a |
| CS(4-3) | 195.954 | 1628 | 12.6 | IRAM-30m | 7.31.0 | 140.06.6 | 104.717.2 | 65.5 | 17.9 | ” | ” | a | |
| CS(7-6) | 342.883 | 340 | 14.0 | JCMT | 1.00.2 | 110.28.8 | 60.314.8 | 13.8 | 5.1 | ” | ” | a | |
| NGC 4038 | CS(2-1) | 97.980 | 201 | 25.1 | IRAM-30m | 1.00.1 | 1646.83.0 | 79.66.7 | 11.6 | 2.2 | 12:01:52.8 | -18:52:05.3 | a |
| CS(3-2) | 146.969 | 471 | 16.7 | IRAM-30m | 0.80.1 | 1645.23.8 | 62.27.6 | 11.4 | 2.6 | ” | ” | a | |
| CS(4-3) | 195.954 | 1396 | 12.6 | IRAM-30m | 1.10.3 | 1646.08.6 | 65.415.8 | 15.3 | 6.5 | ” | ” | a | |
| CS(5-4) | 244.936 | 326 | 20.0 | JCMT | 1.60.2 | 1649.96.5 | 103.212.7 | 14.4 | 6.4 | ” | ” | b | |
| CS(5-4) | 244.936 | 1924 | 10.5 | IRAM-30m | 1.90.4 | 1666.39.7 | 103.0 | 17.1 | 9.5 | ” | ” | a | |
| CS(7-6) | 342.883 | 250 | 14.0 | JCMT | 0.70.1 | 1629.47.6 | 88.615.0 | 7.8 | 2.7 | ” | ” | a | |
| NGC 4039 | CS(2-1) | 97.980 | 226 | 25.1 | IRAM-30m | 1.70.2 | 1640.816.3 | 228.233.6 | 7.1 | 3.2 | 12:01:53.5 | -18:53:11.3 | a |
| CS(3-2) | 146.969 | 547 | 16.7 | IRAM-30m | 1.30.3 | 1691.619.1 | 145.030.2 | 8.3 | 5.8 | ” | ” | a | |
| CS(4-3) | 195.954 | 1275 | 12.6 | IRAM-30m | - | - | - | - | 17.9 | ” | ” | a | |
| CS(5-4) | 244.936 | 277 | 20.0 | JCMT | 1.40.2 | 1757.612.7 | 157.126.5 | 8.2 | 4.0 | ” | ” | a | |
| OVERLAP | CS(2-1) | 97.980 | 203 | 25.1 | IRAM-30m | 0.90.2 | 1498.85.6 | 81.218.9 | 10.6 | 2.7 | 12:01:54.9 | -18:52:59.0 | a |
| CS(3-2) | 146.969 | 467 | 16.7 | IRAM-30m | 0.80.2 | 1504.86.4 | 61.818.7 | 11.7 | 4.8 | ” | ” | a | |
| CS(4-3) | 195.954 | 1290 | 12.6 | IRAM-30m | - | - | - | - | 14.0 | ” | ” | a | |
| CS(5-4) | 244.936 | 1763 | 10.0 | IRAM-30m | - | - | - | - | 14.4 | ” | ” | a | |
| CS(7-6) | 342.883 | 230 | 14.0 | JCMT | - | - | - | - | 4.3 | ” | ” | a | |
| M 83 | CS(3-2) | 146.969 | 600 | 16.7 | IRAM-30m | 1.20.3 | 553.011.0 | 78.024.0 | 15.0 | - | 13:36:59.2 | -29:52:04.5 | e |
| CS(5-4) | 244.936 | - | 10.0 | IRAM-30m | 2.30.3 | 504.07.0 | 82.41.1 | 26.5 | 0.5 | ” | ” | d | |
| CS(7-6) | 342.883 | 121 | 14.0 | JCMT | 0.40.1 | 540.09.5 | 99.118.8 | 3.3 | 1.1 | ” | ” | a |
1 Refs: a: This work, b: See Bayet et al. (2008a), c: See Aladro et al. (2009), d: Martín et al. (2005), e: Mauersberger et al. (1989), f: Martín et al. (2009) and g: Paglione et al. (1995); 2: The velocity positions of the two components in NGC 253 have been fixed to 185 kms-1 and 288 kms-1, consistently to what it has been performed in Martín et al. (2005).
| Source (Nb. of | slope | Correl. | N(CS)1 | Trot 1 |
| fit components) | () | Coeff. | () | (in K) |
| NGC 253-1 (one) | -2.67 | 0.878 | 1.79 | 16.3 |
| NGC 253-1 (two) | -7.14 | 0.970 | 2.65 | 6.1 |
| -1.33 | 0.969 | 0.80 | 32.7 | |
| NGC 253-2 (one) | -3.40 | 0.910 | 2.47 | 12.8 |
| NGC 253-2 (two) | -8.34 | 0.952 | 4.39 | 5.2 |
| -2.14 | 0.999 | 0.97 | 20.3 | |
| NGC 1068 (one) | -3.13 | 0.921 | 2.88 | 13.9 |
| NGC 1068 (two) | -6.09 | 1 | 5.80 | 7.1 |
| -1.31 | 1 | 0.68 | 33.2 | |
| IC 342 (one) | -4.26 | 0.936 | 2.67 | 10.2 |
| IC 342 (two) | -10.87 | 0.997 | 2.87 | 4.0 |
| -1.50 | 1 | 0.27 | 28.9 | |
| M82-NE (one) | -3.91 | 0.958 | 2.64 | 11.1 |
| M82-NE (two) | -7.81 | 0.992 | 4.25 | 5.6 |
| -2.77 | 0.999 | 1.04 | 15.7 | |
| M82-SW (one) | -3.94 | 0.975 | 1.80 | 11.0 |
| M82-SW (two) | -7.10 | 1 | 2.39 | 6.1 |
| -3.02 | 1 | 0.74 | 14.4 | |
| size=7 ′′ | ||||
| NGC 4038 (one) | -2.38 | 0.895 | 0.25 | 18.3 |
| NGC 4038 (two) | -6.24 | 0.936 | 0.29 | 7.0 |
| -1.52 | 0.991 | 0.15 | 28.6 | |
| size=25%7 ′′ | ||||
| NGC 4038 (one) | -2.43 | 0.891 | 0.42 | 17.9 |
| NGC 4038 (two) | -6.49 | 0.943 | 0.51 | 6.7 |
| -1.48 | 0.993 | 0.24 | 29.2 | |
| size=50%7 ′′ | ||||
| NGC 4038 (one) | -2.46 | 0.887 | 0.88 | 17.6 |
| NGC 4038 (two) | -6.67 | 0.947 | 1.10 | 6.5 |
| -1.45 | 0.995 | 0.49 | 29.9 | |
| size=75%7 ′′ | ||||
| NGC 4038 (one) | -2.47 | 0.885 | 0.34 | 17.6 |
| NGC 4038 (two) | -6.74 | 0.949 | 4.29 | 6.5 |
| -1.42 | 0.997 | 1.85 | 30.5 | |
| variable size | ||||
| NGC 4038 (one) | -1.90 | 0.885 | 0.36 | 22.9 |
| NGC 4038 (two) | -5.40 | 0.962 | 0.34 | 8.0 |
| -1.16 | 0.928 | 0.26 | 37.5 | |
| NGC 4039 (one) | -3.21 | 0.847 | 0.81 | 13.5 |
| NGC 4039 (two) | -11.34 | 1 | 1.01 | 3.8 |
| -1.27 | 1 | 0.55 | 34.1 | |
| Overlap (one) | -5.67 | 1 | 0.07 | 7.7 |
| M 83 (one) | -2.73 | 0.999 | 0.45 | 15.9 |
1: The total source-averaged CS column density is derived using the following formulae: N(CS)=Qrot(Trot) where intersect is the value of the intersection of the linear regression with the y-axis (see Figs. 11 to 16) and Qrot(Trot) is the partition function at the rotational temperature Trot (linear interpolation realized when the available range of Trot was not relevant for the studied case - see text). The rotational temperature is calculated using the formulae: T.
| Source | TK | n(H2) | N(CS) | |
|---|---|---|---|---|
| in K | ( cm-3) | (cm-2) | ||
| NGC 253-1 | 30 | 0.40 | 2.50 | |
| 65 | 25.0 | 0.63 | ||
| NGC 253-2 | 15 | 0.16 | 4.00 | |
| 70 | 10.0 | 1.00 | ||
| NGC 1068 | 20 | 1.50 | 6.30 | |
| 65 | 40.0 | 0.63 | ||
| IC 342 | 15 | 0.63 | 1.00 | |
| 50 | 16.0 | 0.25 | ||
| M82-NE | 10 | 1.00 | 4.00 | |
| 65 | 6.30 | 1.00 | ||
| M82-SW | 15 | 1.60 | 2.50 | |
| 45 | 6.30 | 0.63 | ||
| NGC 4038 | 10 | 1.00 | 0.25 | |
| 50 | 40.0 | 0.16 | ||
| NGC 4039 | 10 | 0.40 | 1.00 | |
| 45 | 2.50 | 0.40 | ||
| Overlap | 10 | 2.50 | 0.06 | |
| M 83 | 65 | 6.30 | 0.15 |
Acknowledgments
EB acknowledges financial support from the Leverhulme Trust and M. Banerji for her participation to one the observational sessions on the top of the Mauna Kea. The James Clerk Maxwell Telescope is operated by The Joint Astronomy Centre on behalf of the Science and Technology Facilities Council of the United Kingdom, the Netherlands Organization for Scientific Research, and the National Research Council of Canada. Authors acknowledge the anonymous referee for his/her useful comments which significantly improved the paper.
References
- Aladro et al. (2009) Aladro, R., Martin, S., Martin-Pintado, J., & Bayet, E. 2009, ApJ, in preparation
- Bayet et al. (2004) Bayet, E., Gerin, M., Phillips, T. G., & Contursi, A. 2004, A&A, 427, 45
- Bayet et al. (2006) —. 2006, A&A, 460, 467
- Bayet et al. (2008a) Bayet, E., Lintott, C., Viti, S., Martín-Pintado, J., Martín, S., Williams, D. A., & Rawlings, J. M. C. 2008a, ApJ, 685, L35
- Bayet et al. (2008b) Bayet, E., Viti, S., Williams, D. A., & Rawlings, J. M. C. 2008b, ApJ, 676, 978
- Bronfman et al. (1996) Bronfman, L., Nyman, L.-A., & May, J. 1996, A&AS, 115, 81
- de Jong et al. (1975) de Jong, T., Dalgarno, A., & Chu, S.-I. 1975, ApJ, 199, 69
- García-Burillo et al. (2001) García-Burillo, S., Martín-Pintado, J., Fuente, A., & Neri, R. 2001, ApJ, 563, L27
- García-Burillo et al. (2002) García-Burillo, S., Martín-Pintado, J., Fuente, A., Usero, A., & Neri, R. 2002, ApJ, 575, L55
- Girart et al. (2002) Girart, J. M., Viti, S., Williams, D. A., Estalella, R., & Ho, P. T. P. 2002, A&A, 388, 1004
- Goldreich & Kwan (1974) Goldreich, P. & Kwan, J. 1974, ApJ, 189, 441
- Goldsmith & Langer (1999) Goldsmith, P. F. & Langer, W. D. 1999, ApJ, 517, 209
- Greve et al. (2009) Greve, T. R., Papadopoulos, P. P., Gao, Y., & Radford, S. J. E. 2009, ApJ, 692, 1432
- Helfer & Blitz (1995) Helfer, T. T. & Blitz, L. 1995, ApJ, 450, 90
- Klein et al. (1983) Klein, R. I., Sandford, II, M. T., & Whitaker, R. W. 1983, ApJ, 271, L69
- Krips et al. (2008) Krips, M., Neri, R., García-Burillo, S., Martín, S., Combes, F., Graciá-Carpio, J., & Eckart, A. 2008, ApJ, 677, 262
- Larosa (1983) Larosa, T. N. 1983, ApJ, 274, 815
- Lintott & Viti (2006) Lintott, C. & Viti, S. 2006, ApJ, 646, L37
- Martín et al. (2006a) Martín, S., Martín-Pintado, J., & Mauersberger, R. 2006a, A&A, 450, L13
- Martín et al. (2009) —. 2009, ApJ, 694, 610
- Martín et al. (2005) Martín, S., Martín-Pintado, J., Mauersberger, R., Henkel, C., & García-Burillo, S. 2005, ApJ, 620, 210
- Martín et al. (2003) Martín, S., Mauersberger, R., Martín-Pintado, J., García-Burillo, S., & Henkel, C. 2003, A&A, 411, L465
- Martín et al. (2006b) Martín, S., Mauersberger, R., Martín-Pintado, J., Henkel, C., & García-Burillo, S. 2006b, ApJS, 164, 450
- Mauersberger & Henkel (1989) Mauersberger, R. & Henkel, C. 1989, A&A, 223, 79
- Mauersberger et al. (1989) Mauersberger, R., Henkel, C., Wilson, T. L., & Harju, J. 1989, A&A, 226, L5
- Meier et al. (2001) Meier, D. S., Turner, J. L., Crosthwaite, L. P., & Beck, S. C. 2001, AJ, 121, 740
- Muraoka et al. (2009) Muraoka, K., Kohno, K., Tosaki, T., Kuno, N., Nakanishi, K., Handa, T., Sorai, K., Ishizuki, S., & Okuda, T. 2009, PASJ, 61, 163
- Paglione et al. (1995) Paglione, T. A. D., Jackson, J. M., Ishizuki, S., & Rieu, N. 1995, AJ, 109, 1716
- Peng et al. (1996) Peng, R., Zhou, S., Whiteoak, J. B., Lo, K. Y., & Sutton, E. C. 1996, ApJ, 470, 821
- Planesas et al. (1991) Planesas, P., Scoville, N., & Myers, S. T. 1991, ApJ, 369, 364
- Plume et al. (1992) Plume, R., Jaffe, D. T., & Evans, II, N. J. 1992, ApJS, 78, 505
- Schinnerer et al. (2008) Schinnerer, E., Böker, T., Meier, D. S., & Calzetti, D. 2008, ApJ, 684, L21
- Turner (1991) Turner, B. E. 1991, ApJS, 76, 617
- Walker et al. (1990) Walker, C. E., Walker, C. K., Carlstrom, J. E., & Martin, R. N. 1990, NASA Conference Publication, 3084, 78
- Wilson et al. (2000) Wilson, C. D., Scoville, N., Madden, S. C., & Charmandaris, V. 2000, ApJ, 542, 120