Direct detection of a flared disk around a young massive star HD200775
and its 10 to 1000AU scale properties∗
Abstract
We made mid-infrared observations of the 10 M⊙ Herbig Be star HD200775 with the Cooled Mid-Infrared Camera and Spectrometer (COMICS) on the 8.2 m Subaru Telescope. We discovered diffuse emission of an elliptical shape extended in the north-south direction in 1000 AU radius around unresolved excess emission. The diffuse emission is perpendicular to the cavity wall formed by the past outflow activity and is parallel to the projected major axis of the central close binary orbit. The centers of the ellipse contours of the diffuse emission are shifted from the stellar position and the amount of the shift increases as the contour brightness level decreases. The diffuse emission is well explained in all of geometry (the shape and the shift), size, and configuration by an inclined flared disk where only its surface emits the mid-infrared photons. Our results give the first well-resolved infrared disk images around a massive star and strongly support that HD200775 is formed through the disk accretion. The disk survives the main accretion phase and shows a structure similar to that around lower-mass stars with ’disk atmosphere’. At the same time, the disk also shows properties characteristic to massive stars such as photoevaporation traced by the 3.4 mm free-free emission and unusual silicate emission with a peak at 9.2 m, which is shorter than that of many astronomical objects. It provides a good place to compare the disk properties between massive and lower-mass stars.
1 Introduction
In these two decades, many circumstellar disks around young forming/formed stars less than several solar masses are found by direct images in the infrared/visible observations (e.g. McCaughrean & O’dell 1996; Fukagawa et al. 2004; Fujiwara et al. 2006; Lagage et al. 2006; see also web database 111A comprehensive list of spatially resolved disks is available (www.circumstellardisks.org).). Radio, infrared, and visible line observations confirmed that some disks have rotating disk kinematics as expected (Simon, Dutrey, & Guilloteau 2000; Pontoppidan et al. 2008; Acke, van den Ancker, Dullemond 2005). In contrast, the formation scenario for massive stars (8M☉) is still unclear. Since, for such massive stars, the time scale for the Kelvin-Helmholtz contraction is shorter than that of free-fall or accretion with accretion rate similar to low mass star cases, they start releasing energy through nuclear fusion even during accretion (Palla & Stahler 1993). Then radiation pressure due to their large luminosities may prevent surrounding material from accreting onto the star, in particular, in the case of very massive stars (Kahn 1974; Wolfire & Cassinelli 1987). Several ideas are proposed to overcome the problem: mass accretion through circumstellar disks (Yorke & Sonnhalter 2002; Krumholz et al. 2009), mass accretion under a much larger accretion rate than that usually considered for low mass stars (McKee & Tan 2002; Krumholz et al. 2009), or merging of low mass stars (Bonnell, Vine, & Bate 2004). Among these ideas, non-isotropic accretion through their circumstellar disks seems most plausible at present. Such non-isotropic accretion alleviates effective radiation pressure on the accreting material. Supporting evidence for this disk scenario is recent discoveries of rotating gas fragments around possible massive young stellar objects (YSOs) by interferometric observations in the radio, especially in millimeter and submillimeter wavelength regions (Cesaroni et al. 2007). Some of them have a velocity gradient in a direction orthogonal to molecular outflow lobes, which suggests that the gas fragments rotate around the central YSOs (Zhang, Hunter, Sridharan 1998; Cesaroni et al. 2005). About a dozen of objects as candidate disks around massive YSOs of up to 20 M☉ are found so far (Zhang et al. 1998; Patel et al. 2005; Cesaroni et al. 2006; Beltrán et al. 2006; Cesaroni et al. 2007). Typically, their estimated stellar mass, luminosity, and disk radius are 4 to less than about 20 M⊙, a few (103–104) L⊙, and 500–2000 AU, respectively. It is suggested that early B Herbig Be stars are surrounded by flattened structures from measurement of depolarization across H line although the discussed scale is much smaller (order of several stellar radii) than the disk size indicated above (Vink et al. 2002).
While radio interferometric observations have so far been the most successful in unveiling the disk existence around massive YSOs, the resolution around 1′′ is not sufficient to draw the detailed disk geometry. It is in contrast to the situation that disks around young forming stars less than several solar masses have been well depicted by direct images in visible to infrared wavelengths. For some massive YSOs, existence of disks is discussed from the polarization vector distribution of infrared scattered light image of the outflow cavities (Jiang et al. 2005), but their disks themselves are not seen because such objects are still embedded deeply in their envelopes. Direct images are strongly required to establish the existence and shape of the disks around massive YSOs. Our new approach is to search for disks in the mid-infrared around massive YSOs that have emerged from their natal clouds. Owing to the large luminosities of the central stars, the disk surface can be heated up out to large radii enough to be resolved in the mid-infrared with 8 m-class telescopes, which provide 100 AU resolution for nearby (400 pc) targets. We carry out survey observations for extended emission around Herbig Be stars and report the discovery of a disk around HD200775 in this paper.
2 HD200775
HD200775 is a Herbig Be star located at 430 pc from the Sun 222 The distance, 430pc, is derived by observations with the Hipparcos satellite (van den Ancker et al. 1997) based on the parallax measurement. Monnier et al. (2006) re-examined the distance taking account of the effect of the close-binary orbit and estimated it to be 360pc. Their estimate, however, also suggests a much lower stellar mass for HD200775, which obviously conflicts with the established spectral type. Since the original estimate of 430pc agrees with the distance by Monnier et al. (2006) within the error, we adopt 430pc as the distance in this paper. (van den Ancker et al. 1997). The spectral type is estimated to be B3(1)e based on the equivalent width of several optical lines such as He I+Fe I at 4922 Å and H at 4102 Å (Hernández et al. 2004). Its intrinsic bolometric luminosity is estimated as 5400 to 15000 L⊙ after corrected for the extinction by assuming =3.1 to 5.0, respectively (Hernández et al. 2004), where =5.0 better agrees with the extinction derived independently from B-V and V-R colors. HD200775 appears above the zero-age main sequence on the HR diagram (Hernández et al. 2004), which supports the youth of the system as does the CO biconical cavity formed by the outflow activity extending in the east-west direction with a size of 1.5 pc0.8 pc (Fuente et al. 1998a; Ridge et al. 2003). No high velocity gas component related to the outflow is currently seen, which suggests that the system is at a stage after its outflow activity. The observed CO gas wall corresponds to the ridge of the famous optical reflection nebula NGC7023 (Fuente et al. 1992), which is illuminated by HD200775. Since the gas wall around the east and west cavities has red- and blue-shifted velocity components, the outflow is thought to be observed as an almost edge-on configuration (Fuente et al. 1998a).
The stellar mass of HD200775 is estimated by various studies. Hernández et al. (2004) show that HD200775 is located at the evolutionary tracks of a star with 8.9 to 12.5 M⊙ on the HR diagram, which evolvs into a B3–B0 zero age main sequence star. Based on the time variations of the H line, Miroshnichenko et al. (1998) point out that the star might have a close companion. Recent near-infrared interferometric multi-epoch observations derive the orbital parameters of the close binary, such that the semi-major axis is 15.140.70 mas (corresponding to 6.5 AU at 430 pc) and the orbital period is 137725days (Monnier et al. 2006). On the basis of these data, Monnier et al. (2006) independently estimated the mass of the sum of the primary () and companion stars () as =10.4 M☉ 333 Monnier et al. (2006) used an orbital period of =3.740.06 yr, which is the weighted average between their astrometric measurement and radial velocity measurement by Pogodin et al. (2004). They assumed the distance as 430 pc. . The mass ratio of the companion to the whole stellar system is derived as 0.1750.035 from the variability and the bisector radial velocity of H emission of the system (Pogodin et al. 2004). All these characteristics indicate that the primary star of HD200775 is likely to be a massive YSO with the mass larger than 8 M⊙ or more.
Alecian et al. (2008) made monitoring observations of the polarization in H and some photospheric lines of HD200775. They fit a number of photospheric absorption lines with a combination of the the primary and the secondary stars and estimate the orbital parameters. They obtain 3.870.15 yr, which is similar to those obtained by Pogodin et al. (2004) and Monnier et al. (2006). They attribute shaper, deeper absorption lines to the primary and broader, shallower absorption lines to the secondary star. They find that the radial velocity of the H line follows that of the secondary 444 From the time variation of the radial velocity of H, Alecian et al. (2008) derived the mass ratio =0.810.22. Note that the assignment of the primary and the secondary by Alecian et al. (2008) is based not on the measured mass but on the line profiles. As a result, their analysis indicates that the primary star has a larger velocity variation and thus the primary star has a less mass than the secondary. On the other hand, they estimated the mass ratio as =1.10.5 from the luminosity analysis described below, which is consistent with the orbital analysis. Both of Alecian et al. (2008) and Pogodin et al. (2004) show the time variation plot of the H radial velocities, where that assigned as the secondary’s one by Alecian et al. (2008) is very similar to the bisector velocity by Pogodin et al. (2004) who concluded it to follow the velocity of the primary. See Alecian et al. (2008) for the details. . All lines observed in their spectrum of the secondary are also detected in the spectrum of the primary. They speculate that the higher rotational velocity and slightly fainter luminosity of the secondary star make the lines broader and shallower, concluding that the temperature of the secondary star is similar to that of the primary star. The optical spectrum of HD200775 can be fitted with a combination of two stars better than with a single star. From the fitting, they estimated that the primary and the secondary stars have similar effective temperatures (186002000 K) and that luminosity ratio as =0.670.05. With the total luminosity of 15000L (Hernández et al. 2004) and the luminosity ratio, the two stars can be plotted on the HR diagram independently, from which the stellar masses are estimated as 10.72.5 and 9.32.1 M☉, respectively. The total mass (20.0M☉) agrees with a simple estimate of the total mass M☉, which is directly derived from the orbital parameters by Monnier et al. (2006) and the distance of 430 pc 555The value is different from Monnier et al. (2006), but is still within their errors that take account of uncertainties in several parameters systematically. . The orbital parameters, luminosity, spectrum analysis, and spectral type can all be accounted for consistently by the assumed distance of 430 pc. Thus, it is most likely that the HD200775 system has at least one massive star of 10M and that the 15000 L is close to the real total luminosity.
From the location on the primary and secondary stars on the HR diagram, Alecian et al. (2008) estimated the system age is 0.10.05 Myr from the birthline. It is in contrast with Fuente et al. (1998b), who suggest it more likely that HD200775 is a post-main sequence star that left the main sequence 8 Myr ago, just because a pre-main sequence star has a very short life time. Alecian et al. (2008) also estimated the inclination of the binary orbit and of the stellar rotation axis of the primary star as 48 degrees and 6011 degrees, respectively. The latter one is derived from the analysis of the magnetic field of the stars.
3 Observations and Reduction
3.1 Mid-Infrared Imaging with the COMICS
The imaging of HD200775 with the Cooled Mid-Infrared Camera and Spectrometer (COMICS; Kataza et al. 2000; Okamoto et al. 2003; Sako et al 2003; Ishihara et al. 2006) on the 8.2 m Subaru Telescope was made with four filter bands at 8.75 (=0.752) m, 11.74 (=1.058) m, 18.75 (=0.90) m, and 24.56 (=0.75) m. The observations were made on 2006 August 20-21 and 2007 June 5-6 (UT) for the 8.8 and 11.7 m bands, and on 2008 July 19 (UT) for the 18.8 and 24.5 m bands. The pixel scale in the imaging is 0.13′′/pix and the achieved spatial resolutions are 0.26, 0.32, and 0.55, 0.66′′ as the full width at half maximum of the 8.8, 11.7, 18.8, and 24.5 m point spread functions (PSFs), respectively. During the observations, the secondary mirror was chopped to cancel the background radiation. For the 8.8 and 11.7 m observations, we used an on-chip chopping method with a 0.43–0.45 Hz and 12′′ chop throw nearly along the disk major axis. For the 18.8 and 24.5 m observations, we used 20 or 30′′ throw with 0.43 Hz along the disk minor axis. For data reduction, we applied a shift-and-add method to produce the images as described below. For the sky subtraction, we used a standard chop subtraction method. Flat fielding was done with self-sky flat. The flux calibration was made based on Cohen et al. (1999).
For both of the 8.8 and 11.7 m filter bands, we repeated many short exposures (100 ms and 80 ms, respectively) for the object and the standard stars (HD198149 or HD186791) as the flux and the PSF reference. The standards were observed either before or after HD200775. Because the observations were made on several nights, we have several sets of the object and standard exposures pairs. The numbers of the pairs is 3 and 4, and the total integration time of the object observations for each pair is 43–108 sec and 43–96 sec, for the 8.8 and 11.7 m band, respectively. For each exposures pair, we divided the original pixel into 1010 sub-pixels and applied shift-and-add image stacking to keep the spatial resolution of the stacked images. Then we obtained seven sets of final images. Fluctuations among these sets are taken into account in the uncertainty in the disk model fit in section 4.1. Finally we stacked all the pair images. The total integration time summed up for all the pairs amounts to 195 and 243 sec for the 8.8 and 11.7 m bands, respectively.
For the 18.8 m filter band, the total integration time is 3134 sec. The PSF reference is HD3712 and the flux references are HD3712, HD189319, HD186791, HD198149, and HD213310. Reduction similar to the 10 m images was made.
For the 24.5 m filter band, the total integration time is 4412 sec. The flux and PSF references are HD3712, HD189319, and HD213310. We employed a shift-and-add method, but we did not divide the original COMICS pixels because the object was faint at 24.5 m. Nevertheless, accuracy of the peak detection was good enough (0.12′′ in rms).
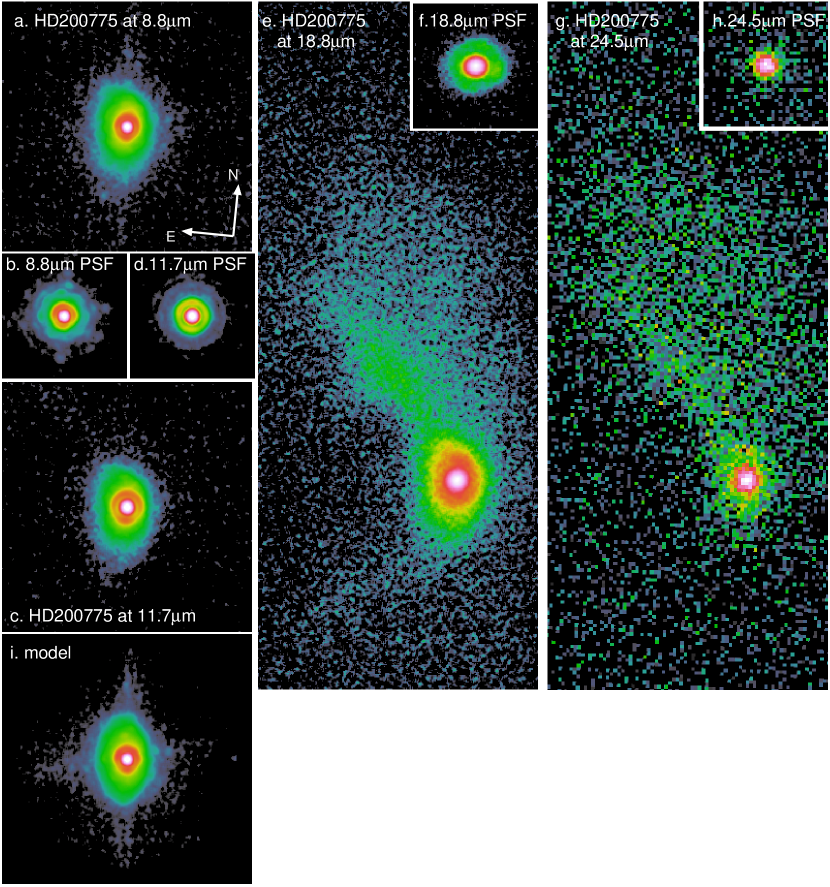
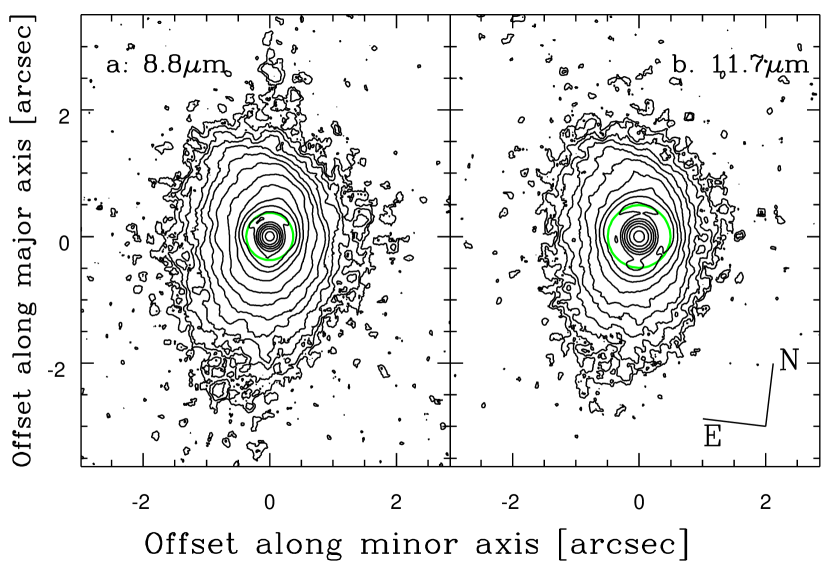
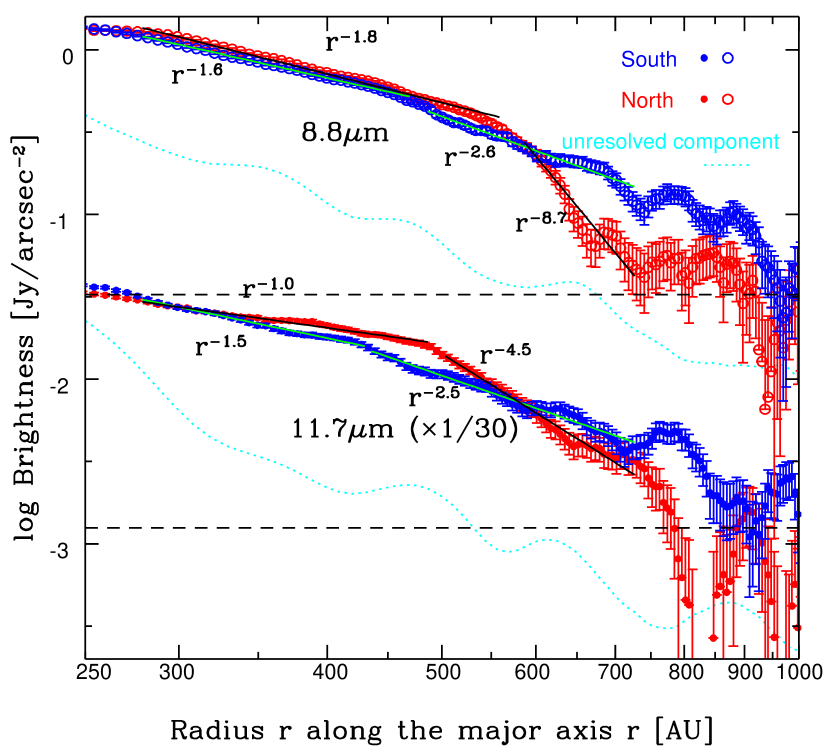
The obtained images are shown in Figures 1 and 2. The brightness profiles at the 10 m bands are shown in Figure 3.
3.2 Spectroscopy with the COMICS
We have made low dispersion (R250) spectroscopy at the 10 m region with the COMICS on the Subaru Telescope on 2006 August 20–21 (UT). We used the long-slit of 0.33′′36′′ in size along the disk major axis and 0.45 Hz chop with 12′′ throw along the slit. We measured the slit position precisely from the slit-viewer images. For the flat-fielding, we used thermal spectra of the cell-cover of the primary mirror. The distortion of the spectra on the detector was corrected based on the standard stars, which were observed with the same instrument rotator angle as used for HD200775. The wavelength was calibrated based on the atmospheric emission lines. The atmospheric absorption was corrected by the spectra of the standard star HD198149. The spectra are calibrated to give the absolute flux and the wavelength dependence of the slit efficiency. The standard deviation of the sky background in each wavelength is taken as an error. The obtained spectra at several positions are shown in Figure 4.
3.3 350.3GHz Observations with the Submillimeter Array
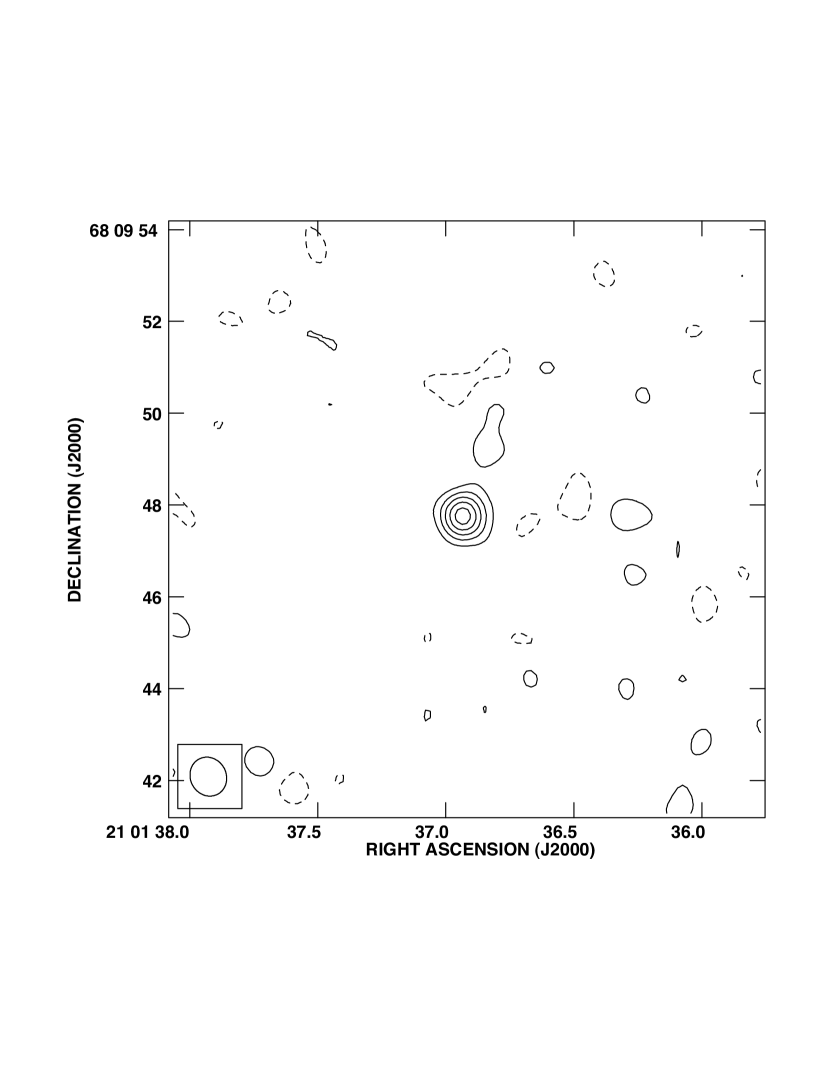
Submillimeter Array 666 The Submillimeter Array is a joint project between the Smithsonian Astrophysical Observatory and the Academia Sinica Institute of Astronomy and Astrophysics and is funded by the Smithsonian Institution and the Academia Sinica. (SMA; Ho, Moran, & Lo 2004) observations of the continuum emission at 345 GHz in the lower side band and at 355 GHz in the upper side band were made on 2008 July 9th (UT). The extended array configuration consisting of 7 antennas provided projected baseline lengths between 33 k to 212 k, and the largest structure to which these observations are sensitive enough (more than 50% level) is expected to be 2.7′′ (Wilner & Welch 1994). 3C279 was observed to obtain the passband characteristics of the system, while the two quasars 1849+670 and 2009+724 were observed every 15 minutes to track the time variation of the complex gain. Visibility data were calibrated with IDL MIR package for the SMA. After the correction for the visibility amplitude by using the record of system temperature, the gain table constructed from 1849+670 data was applied to the visibilities of HD200775. Flux density of 1849+670 at 350GHz was estimated to be 1.50 Jy from the comparison with Uranus. Both the data sets from the upper and lower side bands are combined, and natural weighting is applied in the image construction process. The synthesized beam size (, or PSF) is 0.87′′0.78′′ (FWHM) and its position angle of the major axis is 27.7 degrees. The obtained image is shown in Figure 5.
4 Results and Discussion
4.1 The Mid-Infrared Images and a Flared Disk Model
The obtained 8.8, 11.7, and 18.8 m images (Figs. 1 and 2) have enough S/N ratios and consist of unresolved source emission and elliptical diffuse emission of 2′′ in the semi-major axis, whose shape appears as an inclined disk. At 18.8 m, additional diffuse emission with a curved tail extending toward the northeast is also seen. The observed total fluxes are 9.40.2 Jy, 6.70.7 Jy, and 26.21.3 Jy at 8.8, 11.7, and 18.8 m, respectively. The fluxes of the unresolved component are 5.4 Jy, 3.5 Jy, and 2.0 Jy, which are much larger than the expected photospheric emissions 0.2 Jy, 0.1 Jy, 0.04 Jy, at 8.8, 11.7, and 18.8 m (Acke & van den Ancker 2004), respectively. The size of unresolved source emission is estimated from comparison of the azimuthally averaged radial profiles between the unresolved source and the PSFs. If we assume a Gaussian radial profile for the unresolved source, it is estimated that the 95% of the unresolved flux arises from 22AU and 29 AU at the 8.8 and 11.7 m bands, respectively. Thus the unresolved mid-infrared emission arises mostly from the circumstellar dust in the vicinity of the central star(s). The elliptical emission has a position angle of 6.91.5 degrees and is detected out to 750–1000 AU in radius along the major axis (Fig. 3). It is similar to the radii of disk candidates around massive YSOs (Cesaroni et al. 2007) and disks around low and intermediate mass stars (200–1000 AU; Dutrey, Guilloteau, & Ho 2007), while it is much smaller than the envelope radius (28000 AU) estimated from the north-south distance of the CO cavity wall at the apex. The major axis of the diffuse elliptical emission is orthogonal to the cavity. Also the major axis is in the same direction as the ascending node (PA= -0.27.6 degree) of the binary orbit. All the observed shape, size, and configuration support that the elliptical emission arises from the circumbinary disk around HD200775, which is in almost the same plane as the binary orbit. The results strongly support that the star formed through the disk accretion and that the disk around a massive star still remains even after the outflow phase, that is, the main accretion phase. The 18.8 m tail extends toward the southern edge of the northern part of the CO cavity apex. It may indicate a structure that bridges the disk and the outer region. The 24.5 m image is relatively similar to that at 18.8 m.
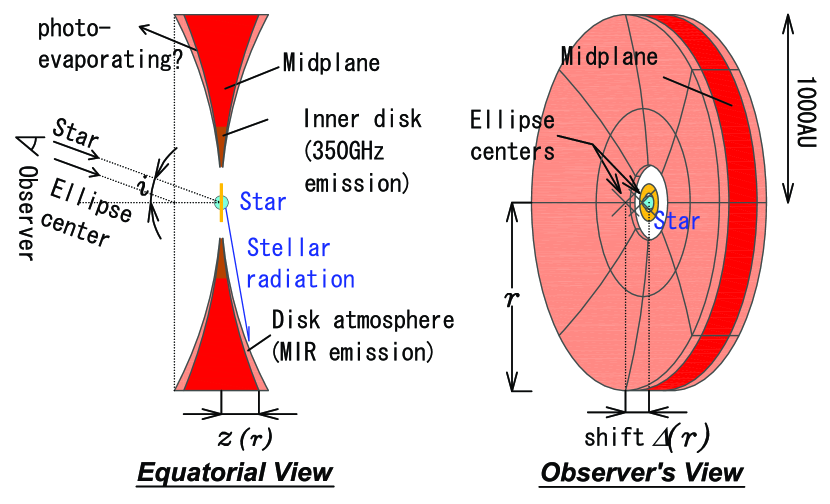
For the disk emission, the isophotal contours are roughly elliptical. The ellipse center is shifted toward the east from the unresolved flux peak source, where the amount of the shift is larger for the fainter isophotal contours. Brightness contribution from the PSF skirt of the unresolved source is still not negligible (cf. figure 3), especially for the inner radius region. However, the shift phenomenon cannot be explained only by the diffraction effect. Such a shift is characteristic to a flared disk, where the ratio of disk height to radius increases monotonically toward the outer region and only the surface emits the mid-infrared photons (Figure 6). It is consistent with that HD200775 shows a spectral energy distribution (SED) steeply arising toward the far-infrared (Acke and van den Ancker 2004), suggesting a circumstellar flared disk whose surface is irradiated by the central star even at outer regions (group I by Meeus et al. 2001). It is very similar to the geometry confirmed for the intermediate mass young star HD97048 (Herbig B9.5e/A0 star with 2.5 M☉ and 40 L☉; Lagage et al. 2006). In the case of HD200775, the east side surface faces us.
To derive the disk geometry, we employed a model image fitting method. We assume a simple axisymmetric disk model, where the emitting surface is flared as from the inner edge () to the outer edge (), to see if the flared disk accounts for our obtained images. It is assumed that only the disk surface emits in the mid infrared, that the disk surface beyond the midplane is completely extinguished, and that the surface brightness of one side per projected midplane area is given by . It corresponds to a passive disk where the disk is mainly heated by the radiation onto the disk surface, which is consistent with the fact that the outflow is not active in HD200775’s case. The unresolved source is not included in the model, but subtracted from the observed images by a ’clean’ analysis method. The model disk is inclined toward us by an angle from face-on and is convolved with the PSF. It is fitted to the observed (peak-subtracted) HD200775 images at 8.8 and 11.7m with free parameters of , , , , , and . We use individual exposure pairs for the fitting because we cannot obtain good PSF images for the pair-averaged images. The best fit result (Figure 1i) shows that the observed image and the shift in the centers of the contours are well reproduced by the simple model with =67948 AU, =15925 AU, =-1.80.3, =54.51.2 degrees and [AU]=(19.616.9) ([AU]/280 AU)2.1±1.1. For each observed pair image, the difference between the model and the observed images is less than twice the sky noise level on the average 777 In detail, we combined 55 subpixels into one pixel at the fitting to reduce calculation time. The difference between the observed image after the clean and the model diffuse disk image is calculated, is squared, and is summed up for the fitted region. The value averaged for the combined pixels is minimized by the fitting. The resulted values for individual pair images are 1.1 to 1.8 times larger than the spatial deviation of the sky area of the observed images. We did not calculate the , because the pixel flux of the observed images are not independent because of the pixel size is smaller than the PSF sizes. . The inclination of the disk agrees with the inclinations of the binary orbit and the stellar rotation axis derived by Alecian et al. (2008; see 2) within errors, suggesting that the axes of the stellar rotation, binary orbit, and the disk are aligned relatively well. The observed brightness profile (fig. 2a) is proportional to at 500 AU, where the agreement with our disk model is fairly good. In the outer region, the observed profile becomes steeper as in the south or more in the north. The fitted outer radius is similar to the radius where the slope of the observed profile becomes much steeper in the north ( in the 11.7 m band and in the 8.8 m band). Most of the fit parameters do not show significant difference between 8.8 and 11.7 m, while the fitted beta is slightly larger for 8.8 m (2.00.2) than for 11.7 m (1.650.24). It seems to correspond to the shallower brightness slope for 11.7 m and suggests that the fit procedure works well. The real inner radius could be smaller due to possible false removal of the emission in the clean procedure, where we allowed multiple peak detection within 0.33′′ radius for 8.8 m and 0.46′′ for 11.7 m from the brightest peak. The criteria are adopted since very short-time seeing fluctuation cannot be treated perfectly even in the shift-and-add process and could produce spurious sub-peaks. While most detected sub-peaks distribute very close to the brightest peak, some sub-peaks are seen along the major axis. Part of the emission coming from the inner disk could have been removed by this process. In general, the simple flared disk model accounts for most of the observed characteristics of HD200775. Our results, the first well-resolved direct infrared images around a massive star, clearly reveal the geometry of the disk around the massive YSO.
The derived flared geometry of the HD200775 disk is much flatter than the disk around the intermediate mass star HD97048. The maximal and average opening angle of the HD200775 disk is much smaller than the HD97048 disk where [AU]=51.3([AU]/135 AU)1.26±0.05 (Lagage et al. 2006). Then becomes 0.12 (at 680 AU radius) to 0.27 (if we extend our fit result to 1000 AU radius) for HD200775 while is 0.49 (at 370 AU radius which is the outer limit discussed by Lagage et al. (2006)). In fact, it is suggested that disks around massive stars generally appear to be flatter since estimated from the SED is typically much smaller for early Herbig Be stars than in Herbig Ae stars (e.g. Acke & van den Ancker 2004). It supports the idea that there is a qualitative difference between disks around massive stars and low mass stars. It may be related to rapid disruption of disks around massive stars due to the large luminosities and/or photoevaporation (see 4.4).
In a hydrostatic disk in Keplerian rotation around a star, it is expected that becomes (e.g. Dutrey et al. 2007). Here we assume that the hydrostatic structure is determined based on the temperature at the equatorial plane and the surface density of the disk, both of which have power-law dependence on radius. Also we assume that the temperature decreases as the radius. Owing to the large uncertainty in , we could not conclude from the model fit whether or not the HD200775 disk is flared more steeply than the HD97048 disk (=1.26), which is consistent with a hydrostatic one. In our fitting, we fix between 0 and 4.1 with a step of 0.1 and search for a combination of the free parameters that minimizes the squared sum of difference between the model images and the observed images. We find that is strongly correlated with in our model fitting. Thus and can not be determined independently. However, the disk height within tends to become similar even if the combination of and changes. The other parameters (, , , ) does not change largely.
The disk detected here is clearly related with the past outflow activity, binary orbit, and inclination of the star. It strongly suggests that this star is still at a pre-main sequence stage, as discussed by Alecian et al. (2008). The present observations indicates the presence of a disk around a high-mass pre-main sequence star.
4.2 Thermal Structure of the Circumbinary Disk around HD200775
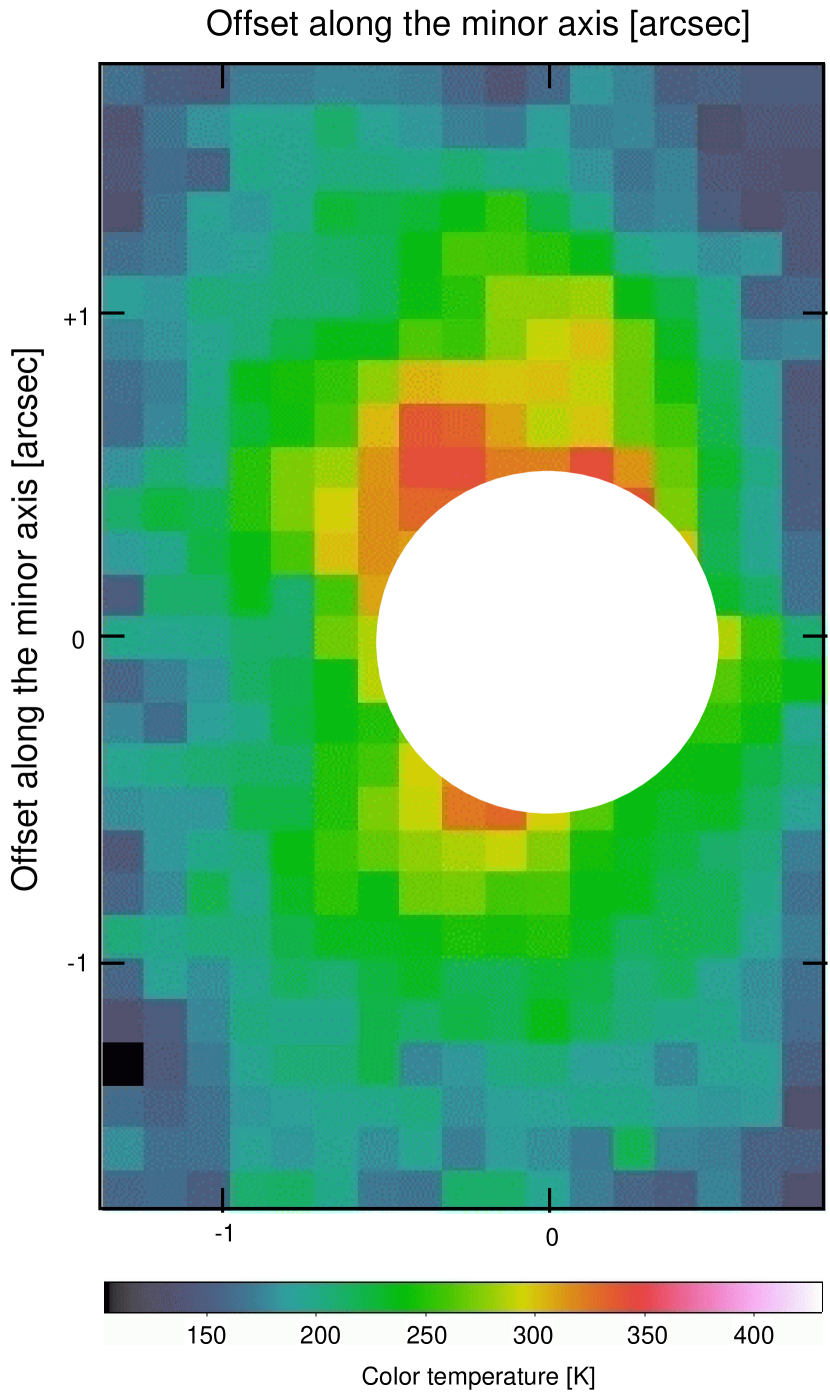
Figure 7 shows the distribution of color temperature of the HD200775 circumbinary disk. It is estimated by using the brightness ratios of the 11.7 and 18.8 m images where the unresolved components are subtracted. The difference of the diffraction size in the two bands is not corrected here. In addition, the 11.7 and 18.8 m bands contain contributions from the silicate feature emission, from which the estimated temperature may suffer. The ISO/SWS spectrum toward HD200775 shows the moderate silicate emission at 10 m region, but has no prominent silicate emission at 18.8 m region. The 11.7 m band is located at the skirt of the 10 m silicate feature. Thus the estimated temperatures may be overestimated. Since it is not necessary that the flux at the two bands comes exactly from the same grains and areas, the actual temperature distribution would be more complicated: grains at the surface has higher temperatures and those at a deeper location in the disk have lower temperatures. Figure 7 indicates that the color temperature is 180–330 K. Black grains becomes only 113 K or 149 K at 430 AU and 77 K or 97 K at 1000 AU from a 6000 L⊙ or 15000 L⊙ star, respectively. It suggests that the grains are not blackbodies but they are small and absorb the stellar photons efficiently in visible wavelengths and radiate in the infrared inefficiently. Figure 8 shows the temperature distribution of blackbody and small (radius =0.1 and 1 m) grains that absorb the stellar light completely but have an emissivity of in the infrared. It suggests that grains of 0.1 m radius have temperatures similar to that of the observed diffuse disk emission.
By assuming amorphous Mg-pure pyroxene grains with 0.1 m radius (Jäger et al. 2003; see section 4.5) at 300 K, we derive the mass of the dust emitting at 10 m as 8 M☉. The total mass including gas is very small (8 M☉), when the gas-to-dust mass ratio is assumed as 100. Also it is difficult to heat up grains in the midplane warm enough (300 K) to be detected in the 10 m bands at the observed large radii in a passive disk. We conclude that the mid-infrared disk emission arises from the disk atmosphere, or the superheated surface layer illuminated directly by the central star as modeled for low to intermediate mass stars (Chiang & Goldreich 1997, Chiang et al. 2001, Dullemond & Dominik 2004). If the beam filling factor by the diffuse disk emission is assumed as unity, the brightness at 10 and 18.8 m suggests the optical depth in the mid-infrared () of – and – for the dust temperatures of 300 K and 200 K, respectively. It corresponds to the optical depth at 0.55 m () of –. It should be noted that the optical depth normal to the disk surface is smaller than most model predictions (e.g. Chiang & Goldreich 1997; for the HD200775 disk) where it is assumed that the surface height is proportional to the vertical gas scale height at any radius and that the absorbed flux of the stellar radiation at the disk surface is proportional to the sine of the local grazing angle ().
There are several possible reasons for the small optical depth. Firstly, the temperatures of the dust emitting in the mid-infrared region might be lower than those assumed (300K for 10m region and 200K for 20m region, respectively). As we mentioned, the silicate features may cause overestimate of the temperatures. If the dust temperature is 150K, the optical depth in the 10m region becomes 60 to 240 times higher. Secondly, the photospheric emission of HD2000775 (=19000 K) peaks around 0.1m in the ultra-violet (UV) region. The interstellar extinction at 0.1m is larger than at the V-band as / is about 5 in a typical case or higher (10) in other cases (Ryter 1996). Since the thickness or the optical depth of the disk atmosphere is determined so that the most stellar emission is absorbed by the disk surface, the thickness of the HD200775 disk case is likely to be determined by the optical depth at the UV rather than visible wavelengths. Thirdly, the ratio of extinction between the mid-infrared and optical wavelengths for grains in the HD200775 disk may not be the same for interstellar grains we assumed (Rieke & Lebofsky 1985). In fact, it is suggested that the grains in the HD200775 disk are different from those in the interstellar medium (ISM) as discussed in 4.5. If in HD200775 is much larger than the ISM, we will have a larger . The ratio becomes larger if the grains are much blacker in the visible to UV wavelengths than in the ISM, or if the grains have much lower emissivity in the mid-infrared than in the ISM. Lastly, the small optical depth in HD200775 might be understood in terms of the thermal instability of protoplanetary disks. Watanabe & Lin 2008 predict that thermal wave can be excited to make ripples of the disk surface in a disk with a low accretion rate. They predict that normal to the disk is 1 only at the excited ripples (thermal wave pulse) and becomes much lower (a few tenths to less than ) at the other most areas.
The ratio of the infrared excess emission () to the total luminosity () is estimated to be 0.07 from the SED (Acke & van den Ancker 2004). The flared geometry derived by our disk model fit gives the fraction of the intercepted stellar radiation of 0.12–0.27. Taking account of the radial optical opacity of the surface layer (), becomes much lower than that from the SED. It can be attributed partly to the small again, and partly to the following fact. In HD200775, extended far infrared emission that roughly traces the outflow cavity wall (NGC7023) is detected (Kirk et al. 2009; we also confirmed it with data of AKARI satellite (Murakami et al. 2007)). Therefore the far infrared flux of the SED (IRAS data and even ISO data) has a significant contribution from the wall. The large of 0.07 indicates that the cavity wall intercepts a large fraction of the stellar flux. The disk itself does not have to absorb a large fraction.
4.3 The 350.3 GHz Image and Mass Estimate
From our 350.3 GHz SMA observations, we detected an unresolved emission source of 35.15.2 mJy at the star position with the 1 noise level of 3.0 mJy/beam (Fig. 5). If we assume the mass absorption coefficient in the radio region given by Hildebrand (1983) and the spectrum (flux ) slope from submillimeter to millimeter wavelengths as , the mass opacity at 350 GHz becomes 0.0085 cm2 g-1. Then the observed flux gives a lower limit for the total disk mass () of 0.022 or 0.010 M☉ for the dust temperature at the midplane of 50 K or 100 K (), respectively. The assumed spectrum slope is in agreement with the SED in Acke and van den Ancker (2004). It is also compatible with the upper limit of the flux at 1.3mm (6 mJy) of past bolometer observations of a 10′′ beam (Fuente et al. 2001). The slope indicates that a majority of the grains in HD200775 is small in size and not fully grown since large grains have a slower wavelength dependence.
The mass above is similar to the estimated minimum mass for the protoplanetary disk around the Sun. If it is distributed uniformly in a sphere of the beam radius (180 AU), it amounts to visible extinction of 190 mag toward the central star, which is much larger than the observed one (1.8 and 3.0 mag under =3.1 and 5.0, respectively; Hernández et al. 2004). Here, we assume the optical to mid-infrared extinction ratio given by Rieke & Lebofsky (1985) and value in Cox (2001). Thus the mass must be distributed in a flattened structure, which consists of the inner part of the disk.
If we assume the brightness of the 2 detection limit of our SMA observations (6 mJy/beam) for the extended emission, the mid-infrared extinction becomes at least 2.0 mag (for 100 K dust) or 4.4mag (for 50 K dust) at 11.7 m even in the outer region. Extinction at 8.8 m is 1.5 times larger than that at 11.7 m (Rieke & Lebofsky 1985). Extinction at 18.8 m is not well known and we assume that it is similar to that at 11.7m (Draine & Lee 1984; McClure 2009). Then, the mid-infrared emission from the further side of the disk should be extinguished mostly by the midplane before reaching us even in the outer region. The observations of the mid-infrared and 350 GHz can be interpreted in terms of the thick disk in the mid-infrared.
4.4 Photoevaporating Disk
While the disk shows geometry and structures relatively similar to low mass stars as described above, there are clear differences, too. Since the primary star is hot enough, its ionizing photons can photoionize the disk gas. It leads to disk dispersal due to photoevaporation in the region where the sound speed of ionized gas exceeds the escape speed against gravity. The inner radius (photoevaporation radius ) is estimated as 70 AU for a 10 M☉ star in a weak stellar wind case (Hollenbach et al. 1994). The mid-infrared elliptical emission of HD200775 corresponds to the region outside . The distribution of the free-free emission at 3.4 mm detected toward HD200775 (Fuente et al. 2001) resembles the elliptical disk and the tail in the mid-infrared well in size and shape. Though it was considered to arise from the stellar wind previously (Fuente et al. 2001), the 3.4 mm and mid-infrared emissions are likely to trace the surface of the photoevaporating disk (Fig. 6). When we assume the ionizing flux from a B3 zero-age main sequence star ( photons s-1 ; Panagia 1973), the mass loss rate due to the photoevaporation is estimated as 7.7 M☉ yr-1 (Hollenbach et al. 1994). It suggests that a mass of 0.01 M☉ to 0.1 M☉ will be dispersed within an order of 1000 to 10000 yrs. The disk around HD200775 seems to be a short-lived phenomenon.
4.5 Spectra: Innermost Circumstellar Disk and Characteristic Diffuse Silicate Emission
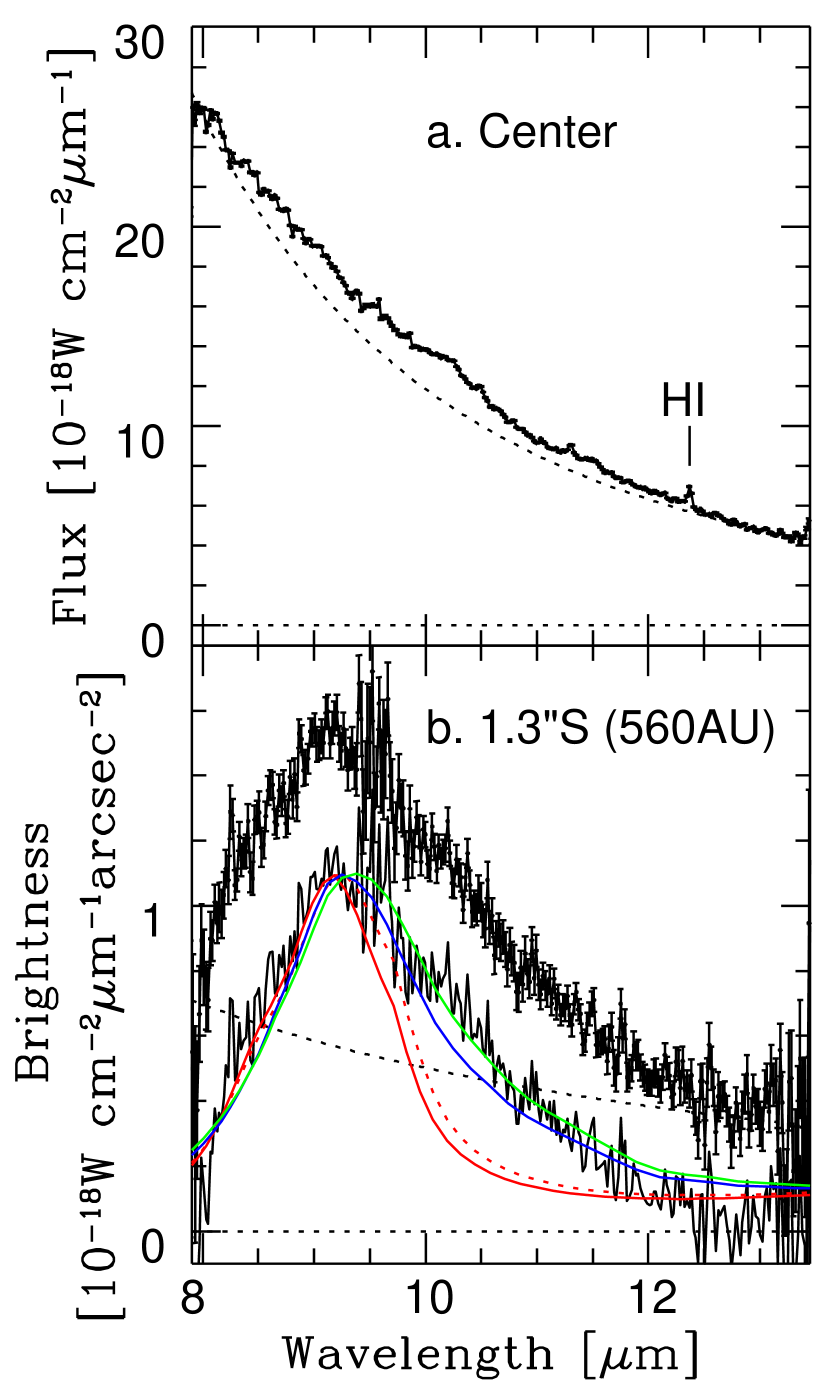
The spatially resolved 10m band spectra of the circumstellar disks have much information on the properties of grains and related processes (e.g., Okamoto et al. 2004). Fig. 4 shows the spectra of the unresolved source and at a typical position in the diffuse disk along the major axis.
The spectrum of the unresolved source (fig. 4a) is dominated by the featureless continuum emission and shows the H I line at 12.37 m of n=76 and n=118 transitions with a line flux of (4.1 W m-2. The innermost disk is well heated deep into the midplane and radiates an optically thick blackbody emission. The temperature estimated from the spectrum is 1600 K (1000 K considering the 1 error of the flux calibration), which is close to the evaporation temperature of silicate and graphite. Black grains illuminated by a 15000 L☉ star become 1600 K at 3.7 AU from the star. Since it is smaller than the binary orbit, the unresolved source emission arises not from the circumbinary disk but from circumstellar disk(s) 888 Black grains become 1000 K at 9.5 AU from a 15000 L☉ source. However, Artymowicz & Lubow (1994) points out that a circumbinary disk with typical viscous disk parameters around a binary system with a semi-major axis tends to have an inner truncated radius of 1.8–2.6 for the binary eccentricity from 0 to 0.25. They also point out that the minimum separation between the component star and the inner circumbinary disk edge is larger than for the binary eccentricity less than 0.75. The HD200775 binary orbit has an eccentricity of 0.300.06 (Monnier et al. 2006). Thus, it is unlikely that 9.5AU is larger than the inner edge of the circumbinary system. It is most likely that the unresolved source emission originates from circumstellar disk(s). . The surface area of the blackbody emission ( arcsec2) indicates a dust ring (or inner wall) at 3.7 AU radius with only a 0.06 AU width (or height). Lépine & Nguyen-Quang-Rieu (1974) detected an OH maser line emission at 1667 MHz toward HD200775 and concluded that the line profile may be formed in a rotating gaseous disk-shaped envelope within 8 stellar radii. The detected H I line emission probably stems from the ionized gas in the dust disk surface or the innermost gas disk where the grains are evaporated.
The diffuse emission at 1.3′′ south from the unresolved source (fig. 4b) shows the amorphous silicate feature with a triangular shape. The peak is located at 9.2 m which is largely shifted from the 9.5–9.8 m amorphous silicate peak often seen toward the interstellar medium (Kemper, Vriend, & Tielens 2004), evolved mass-losing stars (Dorschner et al. 1995), and disks around low to intermediate mass young stars (Honda et al. 2006). It is also shorter than the averaged peak of absorption features of dust grains in outer envelopes of massive protostars and is more compatible with pyroxene ((Mg, Fe)SiO3) than olivine ((Mg, Fe)2SiO4). We compare the continuum subtracted emission with the normalized emission from amorphous silicate grains at 300 K based on Jäger et al. (2003) (Mg0.7SiO2.7) and pyroxene (MgSiO3) grains with 0.1 and 1.0 m radii. As can be seen in fig. 4b, the peak wavelength decreases as the SiO2 fraction in silicate increases (Koike & Hasegawa 1987; Jäger et al. 2003). It suggests the dominance of pyroxene grains or grains with larger SiO2 fraction rather than olivine. The observed peak wavelength is better matched with Mg0.7SiO2.7 grains, but MgSiO3 gives a better fit in the feature width. There is a report (Tamanai et al. 2007) that SiO2 grains of 0.5– 5m diameter have a peak between 8.9–9.5 m. However, our spectra do not show a feature around 12.5 m characteristic to SiO2. Thus the grains are in form of silicate and not pure SiO2. The presence of a 8.9 m feature in H II regions is reported by Peeters et al. (2005), but it seems not to coincide with the observed 9.2 m feature. Grain properties very close to massive stars, especially in disks, may be different from those of disks around low mass stars and even their own envelopes.
To understand the characteristic dust properties, the photoevaporation, that is, the ionizing flux or ionized gas might be an important factor. There are many reports of experiments of irradiating ions such as H+ and He+ on cosmic grains or model grains. Irradiating crystalline olivine with high energy protons of a few MeV, typical of cosmic rays, makes no alteration of the crystalline structure at fluences relevant to the ISM (Day 1977). In contrast, irradiation of H+ and He+ ions of a few to several tens keV can amorphize olivine and pyroxene crystals and change the chemical composition of the grains (Bradley 1994; Dukes et al. 1999; Demyk et al.2001). Demyk et al. (2001) made an irradiation experiment on crystalline olivine with He+ ions at energies of 4 to 10keV and fluences from 5 to 1018 ions cm-2. It caused amorphyzation of olivine in conjunction with an increase in the porosity of the material due to the formation of bubbles. Furthermore, the amorphized layer was deficient in oxygen and magnesium. They found that the O/Si and Mg/Si ratios decreased as the He+ fluence increased. It suggests the change of the olivine to pyroxene structure in the grains. Bradley (1994) investigated a pyroxene crystal on the surface of an interplanetary dust particle and its rim, where alternation has occurred by the irradiation by solar wind ions. He found that the rim was stoichiometrically depleted in Mg and Ca and enriched in S, Si, and Fe relative to pyroxene. He also made irradiation experiments of 20keV protons onto a sample of fine-grained matrix from the Allende chondritic meteorite. Irradiation of both of olivine and pyroxene crytals in Allende again led to the stoichiometric depletion of Mg and Ca. He concluded that ion irradiation first striped cations such as Mg and Ca with the weakest bond strengths and then more strongly bound cations such as Si. These results indicate that irradiation of energetic ions such as H+ and He+ causes a change in the lattice structure of grains from olivine to pyroxenes, then to more SiO2 rich structures. Since the HD200775 disk is photoevaporating and a stellar wind activity is suggested (Skinner, Brown, & Stewart 1993), the grains of the HD200775 disk might be alternated by such a mechanism in plasma of the disk surface or by the stellar wind. Further study is required to investigate whether or not the alternation is a common phenomenon in the formation of massive stars.
5 Conclusions
We have made mid-infrared imaging and spectroscopy of the Herbig B3e star HD200775 of 10 M☉ with Subaru/COMICS. We found elongated emission around the unresolved excess emission in all of the 8.8, 11.7, 18.8, and 24.5m bands. The elongated elliptical emission has a radius of about 1000 AU and configuration perpendicular to the CO cavity wall formed by the past outflow and parallel to the projected major axis of the central close binary orbit. The brightness contours of the elliptical emission are shifted from the stellar position or from the unresolved source position. All of these observed characteristics are well explained as the surface emission of the tilted flared circumbinary disk. The present observations provide the first well-resolved infrared images of a disk around 10 M☉ YSO and strongly support that HD200775 is formed through the disk accretion. The optical depth and the silicate features of the disk emission support the ’disk atmosphere’ configuration, which is well modeled for low to intermediate mass stars. We fit the observed image with a flared disk model. The overall observed structure is well explained by the model. The derived flared geometry is much flatter than the disk around the intermediate mass star HD97048. The value of is estimated to be 0.12 to 0.27 for the HD200775 disk, while it is 0.49 for the HD97048 disk. It supports the idea that there is a qualitative difference between disks around massive stars and lower mass stars. The 3.4 mm free-free emission image in literature is very similar to the mid-infrared elliptical disk emission in size and shape. It suggests that the disk surface photoevaporates due to the ionizing photons from the central star. The SMA 350 GHz observations detect the unresolved emission with a 0.8′′ beam. The disk mass concentrated around the star is estimated as around 0.02 M☉, which is similar to that of the minimum mass the solar nebula. The 10 m region spectra of the peak unresolved source and at the 1.3′′ south are discussed. The spectrum of the unresolved source shows 1600 K featureless emission, which correspond to the innermost circumstellar disk in the vicinity of the central star(s). The spectrum of the diffuse emission at 1.3′′ south is dominated by the amorphous silicate emission. The peak at 9.2 m is shorter than the usual silicate features and unique to the HD200775 disk. It may suggest alternation of grains due to plasma irradiation.
References
- Acke & van den Ancker (2004) Acke, B. & van den Ancker, M. E. 2004, A&A, 426, 151
- Acke, van den Ancker, and Dullemond (2005) Acke, B. & van den Ancker, M. E., Dullemond, C. P., 2005, A&A, 436, 209
- Alecian et al. (2008) Alecian, E. et al., 2008, MNRAS, 385, 391
- Artymowicz (1994) Artymowicz, P. & Lubow, S. H., 1994, ApJ, 421, 651
- (5) Beltrán, M. T., Cesaroni, R., Codella, C., Testi, L., Furuya, R. S., Olmi, L., 2006, Nature, 443, 427
- Bonnell, Vine, & Bate (2004) Bonnell, I. A., Vine, S. G., & Bate, M. R., 2004, MNRAS, 349, 735
- Bradley (1994) Bradley, J. P., 1994, Science, 265, 925
- Cesaroni et al. (2005) Cesaroni, R., Neri, R., Olmi, L., Testi, L., Walmsley, C. M., Hofner, P., 2005, A&A, 434, 1039
- Cesaroni et al. (2006) Cesaroni, R., Galli, D., Lodato, G., Walmsley, C. M., & Zhang, Q., 2006, Nature, 444, 703
- Cesaroni et al. (2007) Cesaroni, R., Galli, D., Lodato, G., Walmsley, C. M., & Zhang, Q., 2007, in Protostars and Planets V, ed. Reipurth, B., Jewitt, D., & Keil, K. (Univ. Arizona Press, Tucson, 2007), 197
- Chiang & Goldreich (1997) Chiang, E. I. & Goldreich, P., 1997, ApJ, 490, 368
- Chiang et al. (2001) Chiang, E. I. et al. 2001, ApJ, 547, 1077
- Cohen et al. (1999) Cohen, M., Walker, R. G., Carter, B., Hammersley, P., Kidger, M., Noguchi, K., 1999, ApJ, 117, 1864
- Cox (2001) Cox, A. N., 2001, Allen’s Astrophysical Quantities, Fourth Edtition (4th ed.; New York: Springer)
- Day (1977) Day, K. L., 1977, MNRAS, 178,49
- Demyk et al. (2001) Demyk, K., et al., 2001, A&A, 368, L38
- Dorschner et al. (1995) Dorschner, J., Begemann, B., Henning, Th, Jäger, C., & Mutschke, H., 1995, A&A, 300, 503
- Draine & Lee (1984) Draine, B. T. & Lee, H. M. 1984, ApJ, 285, 89
- Dukes, Baragiola, McFadden (1999) Dukes, C. A., Baragiola, R. A., McFadden, L. A., 1999, JGR, 104, 1865
- Dullemond & Dominik (2004) Dullemond, C. P. & Dominik, C., 2004, A&A, 417, 159
- Dutrey, Guilloteau, & Ho (2007) Dutrey, A., Guilloteau, S., & Ho, P., 2007, in Protostars and Planets V, ed. Reipurth, B.,
- Fuente et al. (1998b) Fuente, A., et al., 1998b, A&A, 334, 253
- Fuente et al. (1992) Fuente, A., Martin-Pintado, J., Cernicharo, J., Brouillet, N., Duvert, G., 1992, A&A, 260, 341
- Fuente et al. (1998a) Fuente, A., Martin-Pintado, J., Rodriguez-Franco, A., & Moriarty-Schieven, 1998a, G. D. A&A, 339, 575
- Fuente et al. (2001) Fuente, A., Neri, R., Martin-Pintado, J., Bachiller, R., Rodriguez-Franco, A., & Palla, F. 2001, A&A, 366, 873
- Fujiwara et al. (2006) Fujiwara, H., et al.. 2006, ApJ, 644, L133
- Fukagawa et al. (2004) Fukagawa, M., et al. 2004, ApJ, 605, L53
- Hernández et al. (2004) Hernández, J., Calvet, N., Riceño, C., Hartmann, L., Berling, P., 2004, AJ, 127, 1682
- Hildebrand (1983) Hildebrand, R. H., 1983, Roy. Astron. Soc. Quart. Jrn. 24, 267
- Ho, Moran, & Lo (2004) Ho, P. T. P., Moran, J. M., Lo, K. Y., 2004, ApJ, 616, L1
- Hollenbach et al. (2004) Hollenbach, D., Johnstone, D., Lizano, S., Shu, F., 1994, ApJ, 428, 654
- Honda et al. (2006) Honda, M. et al., 2006, ApJ, 646, 1024
- Ishihara et al. (2006) Ishihara, D., et al. 2006, ApJ, 131, 1074
- Jäger et al. (2003) Jäger, C., Dorschner, J., Mutschke, H., Posch, Th., & Henning, Th., 2003, A&A, 408, 193
- Jiang et al. (2005) Jiang, Z., Tamura, M., Fukagawa, M., Hough, J., Lucas, P., Suto, H., Ishii, M., Yang, J., 2005, Nature, 437, 112
- Kahn (1974) Kahn, F. D., 1974, A&A, 37, 149
- Kataza et al. (2000) Kataza, H., Okamoto, Y., Takubo, S., Onaka, T., Sako, S., Nakamura, K., Miyata, T., Yamashita, T. et al. 2000, Proc. SPIE, 4008, 1144
- Kepmer, Vriend, & Tielens (2004) Kemper, F. Vriend, W. J., & Tielens, A. G. G. M., 2004, ApJ, 609, 826
- (39) Kirk, J. M., et al. 2009, astro-ph arXiv:0903.4063
- Krumholz et al. (2009) Krumholz, M. R. et al. 2009, Science, 323, 754
- Koike & Hasegawa (1987) Koike, C. & Hasegawa, H. 1987, Ap&SS, 134, 361
- Lagage et al. (2006) Lagage, P-O et al., 2006, Science, 314, 621
- Lépine & Nguyen-Quang-Rieu (1974) Lépine, J. R. D. & Nguyen-Quang-Rieu, 1974, A&A, 36, 469
- McCaughrean & O’dell (1996) McCaughrean, M. J. & O’dell, C. R., 1996, AJ, 111, 1977
- McClure (2009) McClure, M., 2009, ApJ, 693, L81
- McKee & Tan (2002) McKee, C. F. & Tan, J. C., 2002, Nature, 416, 59
- Meeus et al. (2001) Meeus, G., Waters, L. B. F. M., Bouwman, J., van den Ancker, M. E., Waelkens, C., Malfait, K., 2001, A&A, 365, 476
- Monnier et al. (2006) Monnier, J. D. et al. 2006, ApJ, 647, 444
- Miroshnichenko et al. (2004) Miroshnichenko, A. S., Mulliss, C. L., Bjorkman, K. S., Morrison, N. D., Glagolevskij, Y. V., Chountonov, G. A., 1998, PASP, 110, 883
- Murakami et al. (2007) Murakami, H., et al. 2007, PASJ, 59, 369
- Okamoto et al. (2004) Okamoto, Y. K., et al. 2004, Nature, 431, 660
- Okamoto et al. (2003) Okamoto, Y. K., Kataza, H., Yamashita, T., Miyata, T., Sako, S., Takubo, S., Honda, M., Onaka, T. et al., 2003, Proc. SPIE, 4841, 169
- Palla & Stahler (1993) Palla, F. & Stahler, S. W., 1993, ApJ, 418, 414
- Panagia (1973) Panagia, N., 1973, AJ, 78, 929
- Patel et al. (2005) Patel, N. A. et al., 2005, Nature, 437, 109
- Peeters et al. (2005) Peeters, E., Tielens, A. G. G. M., Boogert, A. C. A., Hayward, T. L., and Allamandra, L. J., 2005, ApJ, 620, 774
- Pogodin et al. (2004) Pogodin, M. A. et al. 2004, A&A, 417, 715
- Pontoppidan et al. (2008) Pontoppidan, K. M., Blake, g. Z., van Dishoeck, E. F., Smette, A., Ireland, M. J., Brown. J., 2008, ApJ, 684, 1323
- Ridge et al. (2003) Ridge, N. A., Wilson, T. L., Megeath, S. T., Allen, L. E., Myers, P. C., 2003, AJ, 126, 286
- Rieke & Lebofsky (1985) Rieke G. H. & Lebofsky, M. J., 1985, ApJ, 288, 618
- Ryter (1996) Ryter, C. E. 1996, Ap&SS, 236, 285
- Sako et al. (2003) Sako, S. et al. 2003, PASP, 115, 1407
- Simon, Dutrey, & Guilloteau (2000) Simon, M., Dutrey, A., Guilloteau, S., 2000, ApJ, 545, 1034
- Skinner, Brown, Stewart (1993) Skinner, S. L., Brown, A., Steward, R. T., 1993, ApJS, 87, 217
- Tamanai et al. (2007) Tamanai, A. Mutschke, H., Blum, J., & Kurirov, A., et al. 2007, preprint of astrophysical institute and University Observatory, Friedrich-Schiller-University Jena
- van den Ancker et al. (1997) van den Ancker, M. E., The, P. S., Tjin A Djie, H. R. E., Catala, C., de Winter, D., Blondel, P. F. C., Waters, L. B. F. M. et al., 1997, A&A, 324, L33
- Vink et al. (2002) Vink, J. S., Drew, J. E., Harried, T. J., Oudmaijer, R. D., 2002, MNRAS, 337, 356
- Watanabe & Lin (2008) Watanabe, S. & Lin, D. N. C., 2008, ApJ, 672, 1183
- Wilner & Welch (1994) Wilner, D. J., & Welch, W. J. 1994, ApJ, 427, 898
- Wolfire & Cassinelli (1987) Wolfire, M. G. & Cassinelli, J. P., 1987, ApJ, 319, 850
- Yorke & Sonnhalter (2002) Yorke, H. W. & Sonnhalter, 2002, ApJ. 569, 846
- Zhang, Hunter, Sridharan (1998) Zhang, Q., Hunter, T. R., & Sridharan T. K., 1998, ApJ, 505, L151