14\Yearpublication2010\Yearsubmission2009\Month\Volume\Issue
later
V5116 Sgr: a disc-eclipsed SSS post-outburst nova?††thanks: Based on observations obtained with XMM-Newton, an ESA science mission with instruments and contributions directly funded by ESA Member States and NASA
Abstract
Nova V5116 Sgr 2005 No. 2, discovered on 2005 July 4, was observed with XMM-Newton in March 2007, 20 months after the optical outburst. The X-ray spectrum showed that the nova had evolved to a pure supersoft X-ray source, indicative of residual H-burning on top of the white dwarf. The X-ray light-curve shows abrupt decreases and increases of the flux by a factor 8 with a periodicity of 2.97 h, consistent with the possible orbital period of the system. The EPIC spectra are well fit with an ONe white dwarf atmosphere model, with the same temperature both in the low and the high flux periods. This rules out an intrinsic variation of the X-ray source as the origin of the flux changes, and points to a possible partial eclipse as the origin of the variable light curve. The RGS high resolution spectra support this scenario showing a number of emission features in the low flux state, which either disappear or change into absorption feature in the high flux state. A new XMM-Newton observation in March 2009 shows the SSS had turned off and V5116 Sgr had evolved into a weaker and harder X-ray source.
keywords:
novae, cataclysmic variables – X-rays: individuals (V5116 Sgr)1 Introduction
V5116 Sgr was discovered as Nova Sgr 2005b on 2005 July 4.049 UT, with magnitude 8.0, rising to mag 7.2 on July 5.085 [(Liller 2005)]. It was a fast nova ( days) belonging to the Fe II class in the Williams (1992) classification (Williams et al. 2008). The expansion velocity derived from a sharp P-Cyg profile detected in a spectrum taken on July 5.099 was 1300 km/s. IR spectroscopy on July 15 showed emission lines with FWHM 2200 km/s [(Russell et al. 2005)]. Photometric observations obtained during 13 nights in the period August-October 2006 show the optical light curve modulated with a period of h [(Dobrotka et al. 2008)], which the authors interpret as the orbital period. They propose that the light-curve indicates a high inclination system with an irradiation effect on the secondary star. The estimated distance to V5116 Sgr from the optical light curve is kpc [(Sala et al. 2008a)]. A first X-ray observation with Swift/XRT (0.3–10 keV) in August 2005 yielded a marginal detection with 1.2(1.0) cts/s [(Ness et al. 2007a)]. Two years later, on 2007 August 7, Swift/XRT showed the nova as a SSS, with 0.56 0.1 cts/s [(Ness et al. 2007b)]. A first fit with a blackbody indicated . A 35 ks Chandra spectrum obtained on 2007 August 28 was fit with a WD atmospheric model with N cm-2 and [(Nelson & Orio 2007)].
2 The 2007 XMM-Newton observation
V5116 Sgr (Nova Sgr 2005 No. 2) was one of the targets included in our X-ray monitoring programme of post-outburst Galactic novae with XMM-Newton (see contribution by M. Hernanz in these proceedings). It was observed with XMM-Newton [(Jansen et al. 2001)] on 2007 March 5, 610 days after outburst (obs. ID: 0405600201, Sala et al. 2007a). The exposure times were 12.7 ks for the European Photon Imaging Cameras (EPIC) MOS1 and MOS2 [(Turner et al. 2001)], 8.9 ks for the EPIC-pn [(Strüder et al. 2001)], 12.9 ks for the Reflection Grating Spectrometer, RGS [(den Herder et al. 2001)], and 9.2 ks for the Optical Monitor, OM [(Mason et al. 2001)], used with the U filter in place.
The observation was affected by solar flares, which produced moderate background in the EPIC cameras for most of the exposure time. Fortunately enough, our target was at least a factor 10 brighter than the background. In addition, the source spectrum is very soft and little affected by solar flares. We therefore do not exclude any time interval of our exposures, but we pay special attention to the background subtraction of both spectra and light-curves. Data were reduced using the XMM-Newton Science Analysis System (SAS 7.1.0). Standard procedures described in the SAS documentation (de la Calle & Loiseau 2008, Snowden et al. 2008) were followed.
2.1 A super-soft X-ray phase with an amazing light-curve
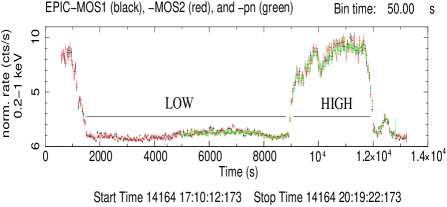
In Sala et al. (2008a) we reported on the X-ray light-curve and broad-band spectra of the March 2007 XMM-Newton observation. The X-ray spectrum showed that the nova had evolved to a pure supersoft X-ray source, with no significant emission at energies above 1 keV. The X-ray light-curve showed abrupt decreases and increases of the flux by a factor (Figure 1), consistent with a periodicity of 2.97 h, the orbital period suggested by Dobrotka et al. (2008).
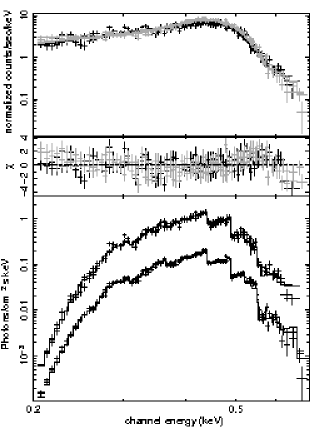
A simple blackbody model does not fit correctly the EPIC spectra, with . In contrast, an ONe rich white dwarf atmosphere model provides a good fit, with , , and (during the high-flux periods; Figure 2). This is consistent with residual hydrogen burning in the white dwarf envelope. The white dwarf atmosphere temperature is the same both in the low and the high flux periods, ruling out an intrinsic variation of the X-ray source as the origin of the flux changes. We speculate that the X-ray light-curve may result from a partial eclipse by an asymmetric accretion disc in a high inclination system.
The observed is consistent with the average interstellar absorption towards the source (Kalberla et al. 2005). Photometry at maximum of the nova outburst indicates (Gilmore & Kilmartin 2005), and for novae at maximum, intrinsic (van den Bergh & Younger 1987). This implies . The obtained from our X-ray spectral fits indicates (using , Zombeck 2007), consistent with the value obtained from the observed colours.
2.2 The RGS spectra
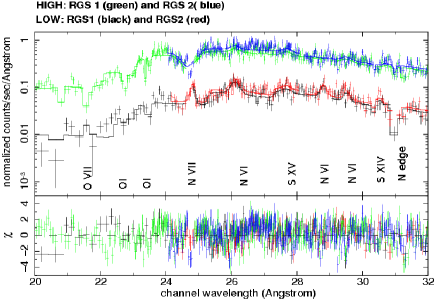
The light-curve of the XMM-Newton simultaneous RGS data follows the same pattern as the EPIC data. We have extracted the high and low state RGS spectra running the SAS rgsproc RGS processing chain from the same time periods as for the EPIC spectra in Sala et al. (2008a), as indicated in Figure 1. The extracted RGS spectra for the high and low states are shown in Figure 3. The low state spectra show a number of clear emission lines, while many of them appear in absorption in the high state spectra.
The atmosphere models used for the EPIC spectra in Sala et al. (2008a) do not provide a good fit for the high resolution RGS spectra. In order to study the emission and absorption features detected with the RGS without the interference of the absorption features of an atmosphere model, we fit the continuum between 20 and 32 with an absorbed blackbody and determine the parameters of the absorption and emission lines by fitting Gaussian profiles to each feature. The resulting best-fit model is overplotted in Figure 3, and the line parameters listed in Table 1.
In the 20–24 band, the prominent absorption features in the high state correspond to OI K and K, and to OVII K. They are clearly detected in absorption in the high state spectrum. The low statistics in this wavelength band in the low state leads to just upper limits for these lines in the low state. Nevertheless, these upper limits for the equivalent width are compatible with the equivalent width determined in the high state.
The OI K and K absorption lines are most probably due to the interstellar medium (ISM) in the V5116 Sgr line of sight. They are often present in the high resolution spectra of Galactic low mass X-ray binaries (Juett et al. 2004), and Yao & Wang (2006) even used the absorption spectra of 4U 1820-303 to determine ISM oxygen and neon abundances. The OI K line at 23.52 was also detected in the RGS spectra of the microquasar GRO J1655-40 (Sala et al. 2007b). In that work, the correlation between the equivalent width of the interstellar OI K line and the interstellar absorbing hydrogen column was plotted using data of GRO J1655-40 and other Galactic sources, and approximated by EW(eV) = 0.5 + 2.8 NH (cm-2). For V5116 Sgr, the absorbing column (= 1.3 ( cm-2) and the equivalent width of the OI K line ( eV) are consistent with that correlation within the uncertainties, indicating that the equivalent width of the OI K line is consistent with the expected value for interstellar absorption.
The O VII K line detected in the RGS spectra of V5116 Sgr has probably some ISM contribution as well. O VII indicates the presence of a hot absorbing gas, at TK, and can be produced either by the hot ISM component, or by some intrinsic warm absorber. O VII has also been detected in the high resolution spectra of some low mass X-ray binaries, together with OI K and K. Examples include the XMM-Newton RGS spectra of the black-hole candidate XTE J1817-330 (Sala et al. 2008b) and the Chandra/HETGS spectrum of GX 339-4 (Miller et al. 2004). In addition, it has even been used as a tracer of the hot component of the Galactic ISM (Yao& Wang 2005, 2006). Nevertheless, oxygen is an overproduced element in all types of classical novae explosions [(José & Hernanz 1998)] and there is most probably also an intrinsic contribution for this line originated in the nova ejecta.
In contrast to the Oxygen lines of the short wavelength band, all the lines present in the 24–32 correspond to higher ionised species of N and S (N VI, N VII, S XIV, and S XV) and follow a different behaviour: they show up in emission during the low state, and are not detected or appear in absorption (NVII) during the high state. This pattern supports the scenario of the partial eclipse of the white dwarf: during low flux periods, when almost 90% of the bright X-ray source is occulted to the observer, emission lines of photoionised circumstellar material (which may be the nova shell itself) become visible; in high flux periods, the bright SSS outshines the emission lines from the ejecta that were visible in the low flux period, while some of the same species located in the circumstellar material, now in the line of sight to the white dwarf, appear in absorption.
Highly ionised species of O, N and S have previously been detected in the ejecta of some novae (V4743 Sgr, RS Oph; Ness et al. 2003, 2009). Both N and O are elements overproduced in both CO and ONe nova explosions, while S is overproduced only in ONe novae [(José & Hernanz 1998)]. So both the S detection in the RGS spectrum and the best-fit atmosphere model to the EPIC data being an ONe model (Sala et al. 2008a) points to V5116 Sgr hosting an ONe white dwarf.
| (frozen) | FWHM | Eq. width | ||
|---|---|---|---|---|
| (eV) | (eV) | |||
| OVII | 21.602 | High | ||
| Low | 1 (frozen) | |||
| OI K | 22.887 | High | ||
| Low | 1 (frozen) | |||
| OI K | 23.507 | High | ||
| Low | 1 (frozen) | |||
| NVII | 24.78 | High | ||
| Low | ||||
| NVI | 26.12 | High | 2 (frozen) | |
| Low | ||||
| SXV | 27.56 | High | 2 (frozen) | |
| Low | 2 (frozen) | |||
| NVI | 28.79 | High | 5 (frozen) | |
| Low | ||||
| NVI | 29.534 | High | 2 (frozen) | |
| Low | ||||
| SXIV | 30.47 | High | 1 (frozen) | |
| Low | 1 (frozen) |
3 The turn-off of the SSS
A Swift observation in June 2008 detected V5116 Sgr with a flux about two orders of magnitude fainter than in the last Swift pointing in August 2007, indicating the turn-off of the Supersoft X-ray Source (Osborne 2009).
A second XMM-Newton observation was performed on 2009 March 13, 1348 days after outburst (Obs. ID: 0550190101, PI: Hernanz). The total EPIC exposure time was 26 ks, but after high-background time filtering only 14 ks of net exposure time are left. V5116 Sgr is detected as a weak X-ray source, with a 0.2–10 keV flux in the range erg/s/cm2. At 10 kpc, that is a luminosity of L=(3–7)kpc)2 erg/s. The source is too faint for a detailed spectral analysis, but the spectral distribution is certainly harder than in the 2007 observation (see Figure 4). The X-ray source is 2–3 times fainter than in the last Swift observation performed 9 months before.
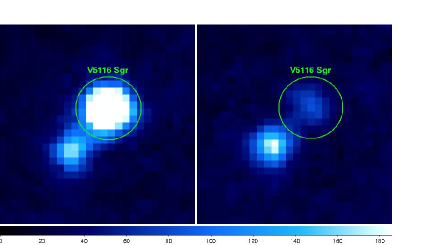
The Optical Monitor was used in fast mode with U and UVW1 filters. Two sources are present in the fast mode window, making the analysis of the data more complex (currently underway). The simultaneous image mode data show the optical counterpart to V5116 Sgr fainter in the U band than in the 2007 observation (see Figure 5), with its U magnitude increasing from in March 2007 to in March 2009. This is consistent with the scenario of the optical brightness in 2006 and 2007 being dominated by the irradiation of the secondary star by the strong SSS source as proposed by Dobrotka et al. (2008), and thus supports the orbital period determination by those authors.

Acknowledgements.
This work is based on observations obtained with XMM-Newton, an ESA science mission with instruments and contributions directly funded by ESA Member States and NASA, and supported by BMWI/DLR (FKZ 50 OX 0001) and the Max-Planck Society. This research has been funded by the MICINN grants AYA2008-04211-C02-01, AYA2007-66256, and AYA2008-01839, and by FEDER funds. GS is supported by a Juan de la Cierva contract of the MICINN.References
- [(Dobrotka et al. 2008)] Dobrotka, A.; Retter, A.& Liu, A.: 2008, A&A 478, 815
- [(den Herder et al. 2001)] den Herder, J.W. et al.: 2001 A&A, 365, L7
- [Gilmore & Kilmartin(2005)] Gilmore, A.C. & Kilmartin, P.M. 2005, IAUC 8559
- [(Liller 2005)] Liller, W.: 2005, IAUC # 8559
- [(de la Calle & Loiseau 2008)] de la Calle, I. & Loiseau, N. 2008, SAS User Guide 5.0 (ESA/XMM SOC, Madrid)
- [(Jansen et al. 2001)] Jansen, F. et al.: 2001, A&A 365, L1
- [(José & Hernanz 1998)] José, J. & Hernanz, M.: 1998, ApJ 494, 680
- [2004] Juett, A.M., Schulz, N.S. & Chakrabarty, D., 2004, ApJ 612, 308
- [Kalberla et al.(2005)] Kalberla,P., Burton, W. et al. 2005, A&A, 440, 775
- [(Mason et al. 2001)] Mason, K.O. et al.: 2001, A&A 365, L36
- [2004] Miller, J.M., Raymond, J., Fabian, A.C., et al., 2004, ApJ 601, 450
- [(Nelson & Orio 2007)] Nelson, T & Orio, M.: 2007, ATel# 1202
- [(Ness et al. 2003)] Ness, J.U.; Starrfield, S.; Burwitz, V. et al.: 2003, ApJ 594, L127
- [(Ness et al. 2007a)] Ness, J.U.; Schwarz, G.; Retter, A. et al.: 2007a, ApJ 663, 505
- [(Ness et al. 2007b)] Ness, J.U.; Starrfield, S.; Schwarz, G. et al.: 2007b, CBET# 1030
- [(Ness et al. 2009)] Ness, J.U.; Drake, J.J.; Starrfield, S. et al.: 2009, AJ 137, 3414
- [(Osborne 2009)] Osborne, J., presentation in “The 14th North American Workshop on CVs and Related Objects”, held in Tucson, AZ, March 2009, available at http://www.noao.edu/meetings/wildstars2/wildstars-presentations.php
- [(Russell et al. 2005)] Russell, R.; Lynch, D. & Rudy, R.: 2005, IAUC # 8579
- [(Sala et al. 2007)] Sala, G., Hernanz. M. & Ferri, C.: 2007a, ATel#1184
- [] Sala, G., Greiner, J., Vink, J., Haberl, F., Kendziorra. E., & Zhang, X.L.: 2007b, A&A 461, 1049
- [(Sala et al. 2008a)] Sala, G.; Hernanz, M.; Ferri, C.; Greiner, J.: 2008a, ApJ 675, L93
- [(Sala et al. 2008b)] Sala, G,; Greiner, J.; Ajello, M.; Bottacini, E.; Haberl, F.:2008b, A&A 473, 61
- [(Snowden et al. 2008)] Snowden, S. et al. 2008, The XMM-Newton ABC guide v4.1 (NASA/GSFC, MD)
- [(Strüder et al. 2001)] Strüder, L. et al.: 2001, A&A 365, L18
- [(Turner et al. 2001)] Turner, M.J.L. et al.: 2001, A&A 365, L27
- [van den Bergh & Younger(1987)] van den Bergh, F. & Younger, P.S. 1987, A&AS, 70, 125
- [] Williams, R. 1992, AJ, 104, 725
- [] Williams, R., Mason, E., Della Valle, M., Ederoclite, A. 2008 ApJ, 685, 451
- [] Yao, Y. & Wang, Y.D.: 2005, ApJ 624, 751
- [] Yao, Y. & Wang, Y.D.: 2006, ApJ 641, 930
- [] Zombeck, M.V. 2007, Handbook of Space Astronomy and Astrophysics, Cambridge Univ. Press, 2007, 3rd ed.