Fast-ion conduction and flexibility and rigidity of solid electrolyte glasses
Abstract
Electrical conductivity of dry, slow cooled (AgPO3)1-x(AgI)x glasses is examined as a function of temperature , frequency and glass composition. From these data compositional trends in activation energy for conductivity EA(x), Coulomb energy Ec(x) for Ag+ ion creation, Kohlrausch stretched exponent (x), low frequency ((x)) and high-frequency ((x)) permittivity are deduced. All parameters except Ec(x) display two compositional thresholds, one near the stress transition, x = xc(1)= 9%, and the other near the rigidity transition, x = xc(2)= 38% of the alloyed glass network. These elastic phase transitions were identified in modulated- DSC, IR reflectance and Raman scattering experiments earlier. A self-organized ion hopping model (SIHM) of a parent electrolyte system is developed that self-consistently incorporates mechanical constraints due to chemical bonding with carrier concentrations and mobility. The model predicts the observed compositional variation of (x), including the observation of a step-like jump when glasses enter the Intermediate Phase at xxc(1), and an exponential increase when glasses become flexible at xxc(2). Since Ec is found to be small compared to network strain energy (Es), we conclude that free carrier concentrations are close to nominal AgI concentrations, and that fast-ion conduction is driven largely by changes in carrier mobility induced by an elastic softening of network structure. Variation of the stretched exponent (x) is square- well like with walls localized near xc(1) and xc(2) that essentially coincide with those of the Intermediate Phase (IP) (xc(1)xxc(2)), and suggest filamentary (quasi 1D) conduction in the IP, and conduction with a dimensionality greater than 1 outside the IP.
pacs:
61.43.Fs-61.20.-xI Introduction
Fast-ion conduction in solid electrolyte glasses has been investigated 1 -6 for over two decades and our basic understanding continues to be challenged with new findings 7 -9 in the field. Resolution of these basic challenges 10 including the role of molecular structure and impurities 11 on fast-ion conduction is likely to have a direct impact on applications of these materials in solid state batteries, sensors, and non-volatile memories.
Electrical conductivity can be generally be written as
| (1) |
where the terms , , represent respectively the charge of the conducting ion, its mobility and concentration. Beyond this point of discussion, it is clear that alloying ionic species in a base glass will lead to an increase in carrier concentration in a host network, but it will also substantially modify the mechanical behaviour by either depolymerising or softening the base structure. Solid electrolyte additives such as AgI, Ag2S and Ag2Se in base chalcogenide glasses are known to possess a low connectivity and their glass forming tendency derives from that feature of structure 12 -13 . Recently Ingram et al. have proposed 10 that the activation energy for conduction (EA) could be displayed under the form of a master plot with respect to activated volume (VA) as
| (2) |
where represents a localized modulus of elasticity (strongly influenced by intermolecular forces) with values ranging between 1 and 8 GPa depending on the nature of chemical bonding involved. One may, therefore, expect that ionic conduction can be related to an elastic softening of a glass network with one functionality (elasticity) affecting the other (conductivity). Can this view be made more quantitative?
Conductivity thresholds in fast ionic conductors have been reported 14 although the relationship with rigidity transitions was not made. Micro-segregation effects have also been reported 15 in various modified oxide glasses including silicates and supported 16 by emerging length scales in MD simulated partial pair distribution functions. These findings are popularized by the channel picture for alkali ion-conduction in sodium silicates due to Greaves and Ngai 14 . In this glass system, the soda content where a micro-segregation onsets is nearly the same as the stress elastic phase transition (x = 18%) determined from calorimetric measurements 17 . A natural question that follows then is, are there links between the elastic behaviour of glasses and micro-segregation effects? Is this a generic behaviour or is it typical of alkali-modified silicates?
(AgPO3)1-x(AgI)x glasses have been widely studied in the past by several groups 18 -25 . A perusal of this large body of work reveals broad compositional trends in thermal, optical and electrical properties of these materials, but not without significant variations between various groups. In some case the conductivity increases monotonically with AgI content displaying either no threshold 26 or one threshold near x = 30% 27 -28 . In more recent reports 8 , 11 , 29 ,30 we have emphasized the need to keep samples dry during synthesis and handling, and to slow cool them from Tg to assure measuring what we believe are the intrinsic physical properties of these materials. The thermal, optical, molar volumes and some electrical properties were reported 30 , and these are found to be quite different from those reported earlier in the literature 20 , 26 , 28 in that many properties including conductivity display two striking compositional thresholds. The data from these more recent investigations 8 , 30 examined as a function of glass composition are found to display striking correlations between various observables. For example, these data have permitted connecting aspects of local structure deduced from Raman and IR vibrational spectroscopy to their thermal as well as electrical transport properties. The elastic nature of backbones derived from Lagrangian constraints, have permitted treating short-range intermolecular forces in an effective way using rigidity theory.
In the present contribution we present temperature dependent and frequency dependent conductivity data on these glasses as a function of AgI content x. Here we address an issue of major importance in the field of solid electrolytes, namely, the relationship of the three defined elastic phases: flexible, intermediate, stressed rigid to the dielectric permittivity derived from the frequency-dependent electrical modulus. We find that (a) the dielectric permittivity is a maximum in the intermediate phase (IP), (b) the Kohlrausch stretched exponent displays a minimum there and (c); we also infer there are dimensional changes in conduction pathways with changing glass composition, and (d) that Coulomb barrier , Ec, determined from the high-frequency permittivity makes only a small contribution to the Arrhenius activation energy for dc conduction, EA, compared to network strain energy, Es. These findings suggest that free carrier concentrations are nearly equal to one, and that they closely follow the AgI concentrations. The observed compositional trends in dc conductivity, (x) appear to derive from elastic network softening which controls carrier mobility. The observed precipitous increase of conductivity in the flexible phase may well be a generic feature of solid electrolyte glasses.
II Experimental
II.1 Synthesis of dry AgI-AgPO3 glasses
Bulk (AgPO3)1-x(AgI)x glasses were synthesized using 99.9% Ag3PO4 (Alpha Aesar Inc.), 99.5% P2O5 ( Fischer Scientific Inc.), and 99.99% AgI (Alpha Aesar Inc.), and separately AgNO3 and NH4H2(PO3)4 with AgI as the starting materials. Details of the synthesis are discussed elsewhere 11 . In our experiments, the starting materials were handled in a dry nitrogen gas purged glove box (Vacuum Atmospheres model HE-493/MO-5, relative humidity 0.20%). The starting materials were weighed in the desired proportion and thoroughly mixed in an alumina crucible with all handling performed in the glove box. Mixtures were then transferred to a box furnace held at 125oC in a chemical hood purged by laboratory air, and heated at 100oC/hr to 700oC. Melts were equilibrated overnight and then quenched over steel plates. Calorimetric experiments also revealed 11 that stress frozen upon melt quenching can be relieved by cycling samples through the glass transition temperature (Tg). Conductivity measurements were undertaken only on samples cycled through Tg and slow cooled at 3oC/min. to room temperature.
II.2 AC conductivity measurements as a function of temperature and frequency
Glass sample disks about 10mm in diameter and 2 mm thick were synthesized by pouring melts into special troughs. Pellets were then thermally relaxed by cycling through Tg. Platelets then were polished, and the Pt electrodes deposited. The complex impedance Z∗()=Z’()+iZ”() of the specimen was measured by a Solartron SI 1260 impedance analyzer over a frequency range of 1 Hz-1 MHz (19 points per measurements). The temperature was raised from 150 K to Tg at a rate of 1oC/min. All data were acquired automatically at 2 min intervals. The complex conductivity ()=’()+i”() is deduced from the complex impedance Z∗, the sample thickness t and the area S of the surface covered by platinum using the formula : ()=(t/S)(1/Z∗).
III Experimental results
III.1 Temperature dependence of conductivity
The temperature dependence of electrical conductivity for ionic conduction in glasses usually displays an Arrhenius dependence
| (3) |
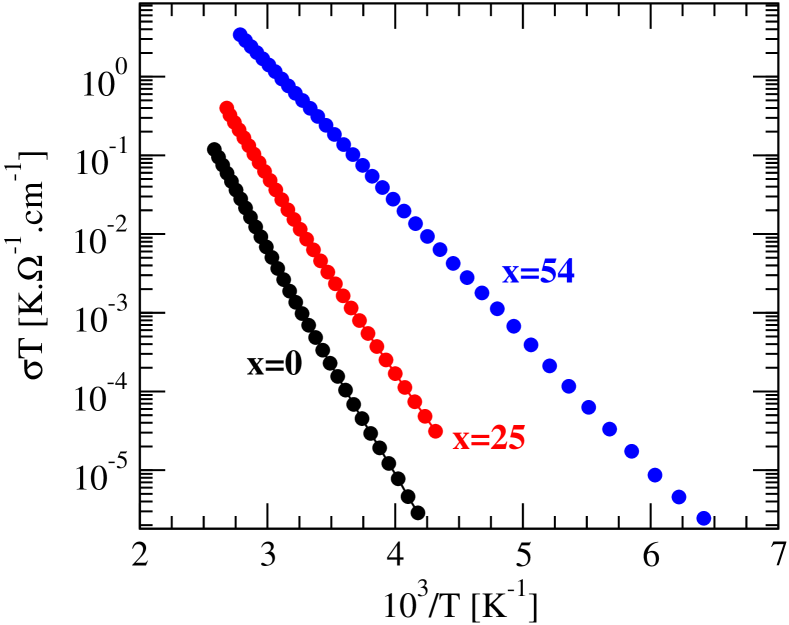
We have obtained the activation energy EA(x), by performing temperature dependent measurements in the 40oCTTg range. An illustrative example of some of these results, at three glass compositions, is reproduced in Fig 1. From the temperature dependence, we have obtained the preexponential factor and the activation energy EA as a function of AgI content, and these data are reproduced in Fig.2. One finds that EA(x) steadily decreases as x increases, particularly for x 40% while drops rapidly with x at low x (10%) and then levels off in the intermediate x region.
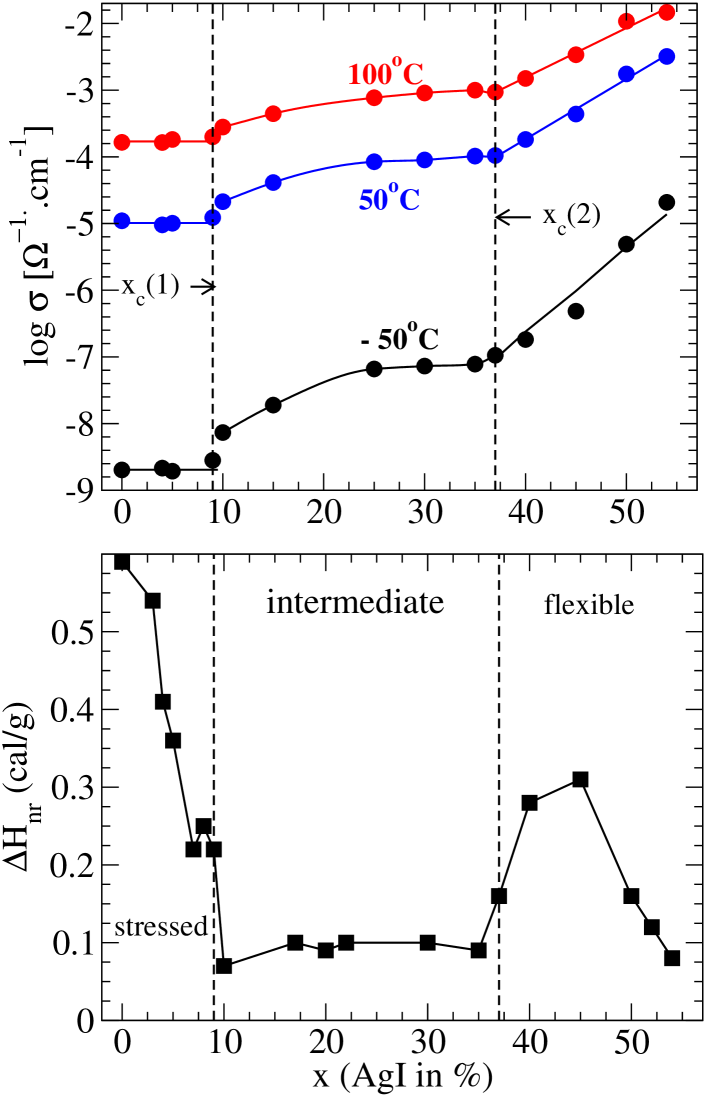
Interestingly, we find (x) displays three regimes of conduction whatever the temperature (Fig. 3a). At low x ( 9%) (x) is found to be nearly independent of x. The conductivity then builds up at higher x ( 10%) with a distinct step near 9%, and at x 37.8% a power-law variation of (x) sets in. The location of the two electrical conductivity thresholds at x = 9% and x = 38% coincide with steps in the non-reversing enthalpy at Tg that define the boundary of the Intermediate Phase (IP) (Figure 3b). These data will be discussed in section IV.
III.2 Frequency dependence of AC conductivity
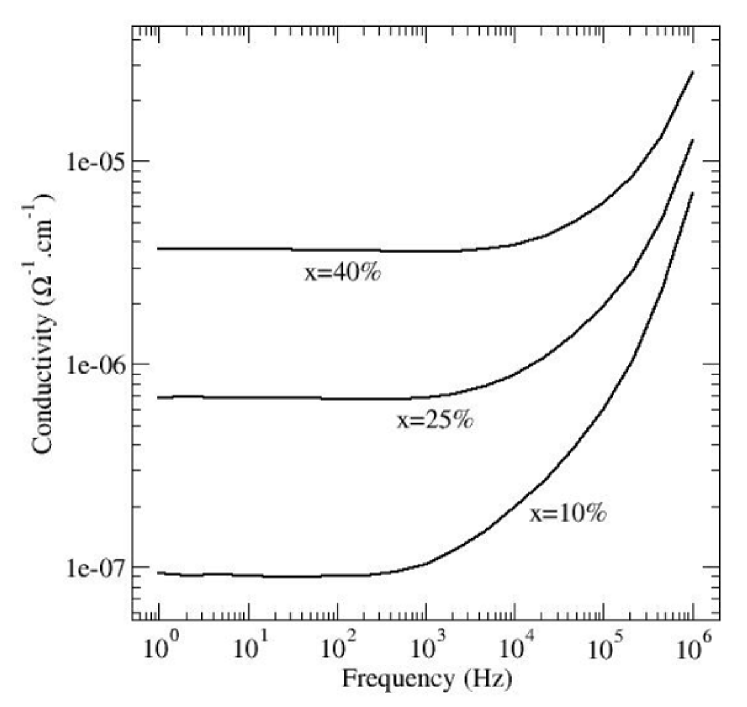
The frequency dependence of AC conductivity, () at three representative glass compositions is summarized in Figure 4. These data show a saturation of () at low frequencies (/2 100 Hz), and an increase of about 2 orders of magnitude in the 103 106 range. The low frequency saturation value of is found to increase steadily as the AgI content of glasses x increases from 10% to 40%, a behaviour that is consistent with data in Fig. 3. The present results on the frequency dependence () are similar to earlier reports of Sidebottom 20 and separately by Stanguenec and Elliott 21 . For a more quantitative analysis of these () data, we have deduced the frequency dependence of the dielectric permittivity, () from the measured AC conductivity.
III.3 Electrical modulus analysis
The behaviour of the complex conductivity ()=’()+i”() can be analyzed using the complex permittivity ()=’()+i”() or the complex electrical modulus M∗()=M’()+iM”() which are related to the complex conductivity via:
| (4) |
and
| (5) |
Here designates the permittivity of free space of Farad/meter. From the measured value of ”, using equation (4) we could deduce the real part of the permittivity ’. These data are presented on a log-log plot for a glass at a composition x = 25% in Figure 5.
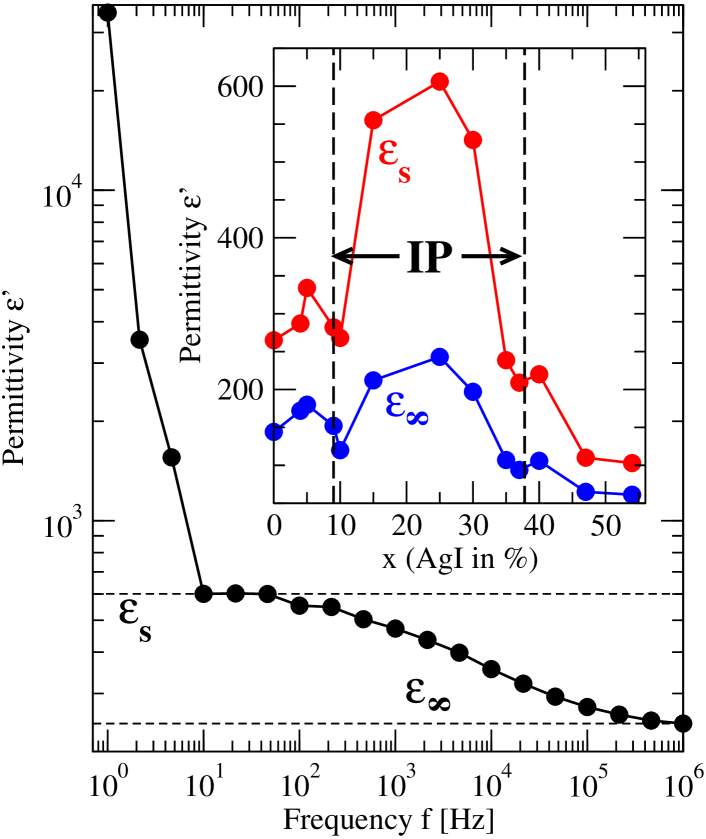
Permittivity results generally from mobile ions, but the sharp increase in ’ at low frequencies, particularly at f = /2 10 Hz, is due to electrode polarization effects as Ag+ ions are deposited at the anode at very low frequencies 31 . The behaviour is observed for all samples but the magnitude of could be unambiguously determined. The saturation value of the permittivity at low frequency () and at high frequency () were thus obtained at all other glass compositions, and these data appear in the insert of Fig 5. Noteworthy in these trends of (x) and (x) is the fact that both show a broad maximum that onsets near x = x1 10% and ends near x = x2 35%, the two threshold compositions observed in the non-reversing heat flow at Tg (Fig.3b) and electrical conductivity (Fig.3a) that essentially define the IP region 8 of these glasses. At the glass composition x = 20% , located near the middle of the IP, these parameters acquire rather large magnitudes: =620 and =250. The magnitude of these permittivity found in the IP of the present electrolyte are truly exceptional- they are high compared to those found in other systems such as the alkali silicates (=11, 14 ), and highlight another remarkable property of solid electrolytes bearing Ag salts.
We now follow the approach developed by Ngai and co-workers 31 and use the electrical modulus formalism to obtain stretched exponents (x) from our () data. Our starting point is to write the electric field E(t) under the constraint of a constant electric displacement as:
| (6) |
and define E(0) as the initial electric field and (t) the relaxation function of the system. In the frequency domain, the electrical relaxation is appropriately represented by the electric modulus:
| (7) |
and the high-frequency ()and low-frequency limits () of the real part of the permittivity () then can be written as :
| (8) |
where:
| (9) |
We use the standard relaxation function based on a stretched exponential:
| (10) |
with representing the Kohlrausch-Williams-Watts exponent. The exponent provides a good measure of the correlations of atomic motions in a relaxing network 31 . And the absence of cooperative behaviour will lead inevitably to a typical Debye relaxation with =1, a behaviour that is expected in dilute limit where concentrations of diffusing cations is low. One finally obtains from equations (8)-(10):
| (11) |
where represents the Gamma function.
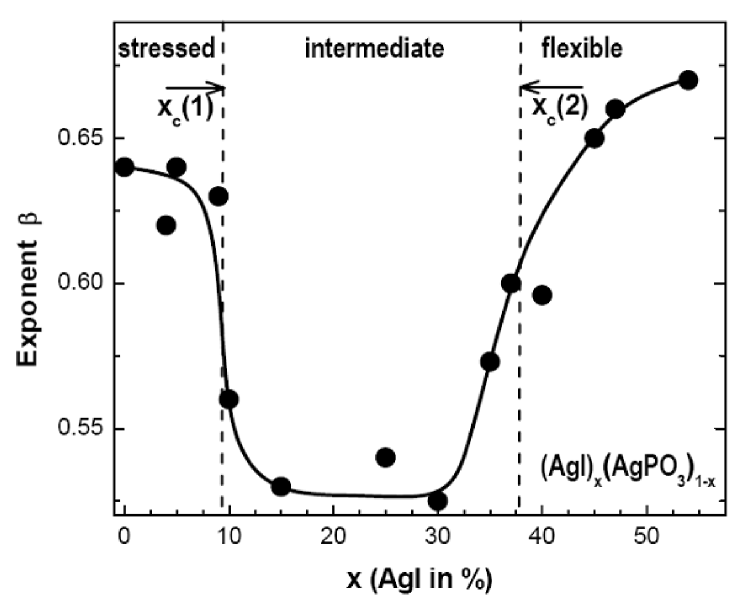
The data of Fig. 5 gives the glass composition variation of the permittivity, (x) and (x). Using these permittivity parameters and the relation between them (equation (11)), we have extracted compositional variation of the Kohlrausch stretched exponent (x) These data appear in Figure 6. We find 0.65 at low x (0%) and at high x (50%), but at compositions in between, particularly in the IP, is found to decrease ( 0.53) and to display a broad square-well like minimum, a trend reminiscent of the reversibility window (Fig.3(b)). At low carrier concentrations, x 5% for example, we are in the dilute limit and carriers can be expected to be randomly distributed displaying little or no correlations in their motion. Yet our data shows that does not acquire a value of 1, as found in the sodium silicates 14 . This is a curious result and it possibly reflects the fact that in the present system the diffusing cation of interest Ag+ also happen to be part of the base glass network.
IV Discussion
IV.1 Three regimes of fast-ion conduction and elastic phases of AgPO3-AgI glasses
Perhaps the central finding of this work is that fast-ion conduction in the present solid electrolyte glass displays three distinct regimes of behaviour, and that these regimes coincide with the three known elastic phases of the backbone. The result emerges from the compositional trends in the electrical and thermal data presented earlier in Figure 3. The observation of a reversibility window fixes the three elastic phases of the present glasses 8 with glass compositions at x x1 = 9% belonging to the stressed-rigid phase, those at x x2 = 38% to the flexible phase, while those in between (x1 x x2) belonging to the IP. The two thresholds, x1 and x2, we identify respectively with the stress and the rigidity transitions. As glasses become flexible at x 38%, (x) increases logarithmically, a result that underscores the crucial role of network flexibility in opening a doorway for Ag+ ions to migrate. In the flexible phase, network backbones can be more easily elastically deformed (less cost in strain energy), and ions can more easily diffuse and contribute to conduction.
A closer inspection of Fig. 3a also shows that (x) is nearly independent of x in the stressed-rigid glasses ( x x1), but it varies discontinuously displaying a jump near the stress transition, x1 9%. The jump in (x) decreases as temperature is increased from -50oC to 100oC. At low temperature (-50oC), we note that the observed jump is rather large; increases by a factor 2.5 between the composition x =10% and x = 10.5%. The discontinuity in (x) at the stress transition is reminiscent of a similar behaviour encountered in the variation of the Raman mode frequency () of corner-sharing tetrahedra in binary GexS1-x glasses at the stress transition 32 . The frequency jump () across the threshold also increases as T is lowered. Since the stress transition is found to be a first order transition, it suggests that the first derivative of the free energy must be temperature dependent.
IV.2 Self-organized ion hopping model (SIHM) of solid electrolytes
To gain insights into the origin of the observed electrical conductivity thresholds (Fig. 3), we use Size Increasing Cluster Approximation 33 -34 (SICA) to identify the two elastic thresholds in a parent solid electrolyte glass system. For this purpose we use the alkali oxide modified Group IV oxide, (1-x)SiO2-xM2O, with M=Li,Na,K, and start with N tetrahedra (e.g. SiO4/2 and MSiO5/2 (sharing one non-bridging or terminal oxygen) with respective probabilities (1-p) and p=2x/(1-x) at the first step, l = 1, in the agglomeration process. Our goal is to compute the probability of finding specific clusters in the three phases of interest (flexible, intermediate, stressed rigid). We note that a SiO4/2 structural unit is stressed rigid (nc=3.67 per atom) while a MSiO5/2 unit is flexible (nc=2.56 per atom). Here nc represents the count of bond-stretching and bond-bending constraints per atom. Henceforth, we denote these local structures as St (stressed-rigid) and Fl (flexible) units respectively. Starting from these local units as building blocks, we calculate all possible structural arrangements to obtain agglomerated clusters containing two (step l=2), and then three building blocks (l=3), etc. and their corresponding population probabilities pi. In calculating the probabilities of the agglomerated clusters we fold in their mechanical energies. Details of the method and application appear elsewhere 33 . At each agglomeration step l, we compute the floppy mode count f(l). At step l=2, the count of floppy modes f(2),
| (12) |
where nc(jk) and Njk are respectively the number of constraints and the number of atoms found in a cluster with probability pjk. An IP is obtained if self-organization is achieved 33 -34 , i.e. if upon decreasing the content of modifier atoms (x), stress-free cyclic (ring) structures form. In these calculations we define a parameter which measures the fraction of atoms in ring structures to those in dendritric ones. Thus, =0 corresponds to the case of networks composed of only dendritic structures (no rings), while =1, corresponds to networks with only ring structures. Our calculations reveal that IP-widths are directly related to the parameter i.e, larger the greater the IP-width. In practice, one starts with a flexible network containing a high concentration (x) of modifier ions. One then decreases the modifier concentration, and can expect more St species to form in a cluster that still possesses a finite concentration of floppy modes f0. At a certain composition x=xr, there will be enough St species formed to drive clusters to become rigid when f(2) vanishes, thus defining the rigidity transition. And if we continue to reduce the modifier concentration beyond the rigidity transition, one can expect clusters that are almost stress-free by balancing St and Fl units. Such a selection rule of self-organization will hold up to a certain point in composition x=xs , the stress transition, i.e., at x xs dendritic or St-rich structures will predominate and stress will percolate across clusters. In this SICA approach, the IP width is then defined by the composition interval, xr-xs , which may be compared to the experimentally established interval between the observed stress and rigidity transitions, i.e., xc(2) - xc(1) = 28% (Fig 3b). In what follows, we fix the value in order to work with a fixed IP-width.
Our SIHM theory of ion-conduction builds on an approach initially devised for the conductivity of alkali borate glasses 34 ; 36 and identifies hopping sites for conducting cations from a structural model, which in our case was used to describe application of SICA to (1-x)SiO2-xM2O glasses. Both (present work and ref 34 ) models incorporate the idea first invoked by Anderson and Stuart 37 that activation energy for ionic conduction (EA) is made of two terms- an electrostatic energy (Ec) to create an ion and which determines the free carrier concentration nL , and a network stress energy (Es) that facilitates migration of ions and determines carrier mobility . We, therefore, concentrate our efforts on estimating the energies, Ec and Es, as they can be directly related to the statistics of clusters and the enumeration of constraints via statistical mechanics averages.
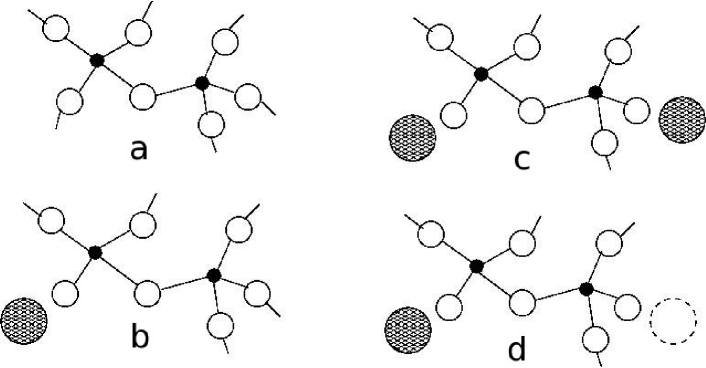
We begin by modelling the parent solid electrolyte,(1-x)SiO2-xM2O , where M represents an alkali ion, and evaluate the free carrier concentration nL. We will have no M+ ions ( n = 0) available if we consider a pair of Si tetrahedra, each having one non-bridging oxygen near neighbour attached to M+ ions, i.e., a pair of MSiO5/2 tetrahedra (Fl-Fl), since there are no vacancies. However, we will have n = 1 and 2 vacancies in the case of local structure pairings of the type, MSiO5/2-SiO , and SiO5/2-SiO , contributing respectively 1 and 2 M+ carriers for ion transport (Figure 7). And by knowing the probability for each of these parings pjk, one can calculate a mean Coulombic energy over all possible pairings between Fl and St local units to obtain the carrier concentration,
| (13) |
with the mean Coulomb energy, defined as follows,
| (14) |
where Ec is the Coulombic energy to extract a cation M+ from an anionic site, and acts as a free parameter in the theory. normalises the free carrier concentration by requiring n = 0 at T=0, and n=2x at infinite temperature, i.e. the nominal carrier concentration. As the probability pjk of pairings depends on the nature of the elastic phase, the free carrier concentration n can be expected to change as we go across the three elastic phases (flexible, intermediate, stressed).
Once a carrier is available, it will hop between vacant sites, and the general form for hopping rates is given by
| (15) |
where is the attempt frequency, and we assume it to be constant as only one type of local species (Fl, e.g. MSiO5/2) is involved in ionic conduction here. In fact, given the compositional region where the theory applies and where rigidity transitions are usually found 17 , one does not expect to observe other Fl local species containing more than one cation (e.g. M2SiO3 corresponding to the metasilicate composition). In general, the attempt frequency will depend on the local environment of the hopping cations 38 . The strain or migration energy Es for a hop is roughly the energy required to locally deform the network between a cation site and an available vacant site. It should therefore depend on the floppy mode energy. We assume it to not depend on the process (i,j), which is equivalent to saying that we neglect the Coulomb repulsion from vacant sites. Note that in the stressed- rigid phase, there are only few hopping events possible since the network is made up largely of stressed-rigid St-St and isostatically rigid St-Fl pairs.
In the flexible phase (at x xr ) floppy modes proliferate as the count f(2) (equation (12)) becomes non-zero. In this phase, one can expect local deformations of the network to be facile, thus increasing hopping rates, and reduce the energy required to create doorways between two vacant sites. We write the strain energy as: E=E-f(2) where f(2) term is a typical floppy mode energy given by experiments 39 . In the flexible phase, Es is reduced in relation to the stressed-rigid phase by the quantity f(2). One is then able to write a conductivity of the form:
| (16) |
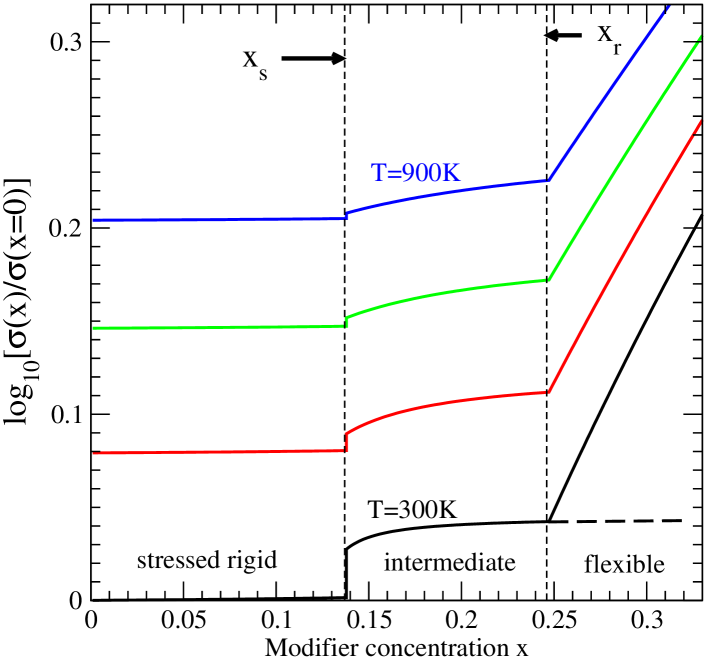
Results of the self-organized ion-hopping model (SIHM) for the parent electrolyte system described above are summarized in Figure 8. In this figure we plot the variation of conductivity, (x) given by equ. (16), as a function of glass composition (x) at several temperatures T but at a fixed Coulomb energy Ec. This model calculation shows that the elastic nature (stressed rigid, intermediate, flexible) of networks alters ion-transport in profound ways. Three prominent features become apparent; (i) a minuscule conductivity change is predicted in the stressed-rigid phase, (ii) a step-like increase in (x) is anticipated at the stress phase boundary x = xs , and finally (iii) a logarithmic variation of (x) is predicted in the flexible phase( x xr). These features of our SIHM model are in rather striking accord with the observed variation of conductivity in the present AgPO3-AgI glasses (Figure 3).
The SIHM model predictions provide crucial insights into origin of ion-transport in the three elastic regimes. In the stressed-rigid phase, strain energy is high and leads to a low number of hopping possibilities, since hops are allowed only between select number of Fl-St pairs. These restrictions on hopping combined with a low free carrier concentration results in a weak dependence of (x) on modifier concentration x. The order of magnitude of normalized to (x=0), is largely determined by the magnitude of Ec, i.e. the interaction energy between the cation M and its corresponding anionic site.
In the IP, new cation pairs (Fl-Fl, and thus hopping possibilities) are populated, and lead to a mild increase of . The step-like increase in conductivity at the stress-phase boundary , x = xs (Fig 7) is a feature that is nicely observed in our experiments (Fig 3a), and provides an internal consistency to the description advanced here. Theory tells us that the jump in at stress transition depends on T or inverse Ec at fixed T, (see equ. (14)). The location of the stress transition is a network property and it depends on the IP, i.e., aspects of medium range structure. As in other quantities observed 8 , the first order jump in (x) near x = xs is a manifestation of deep structural changes in a glass network which contributes to a cusp in the configurational entropy 33 . And as a final comment on the subject, we recognize that at a fixed temperature, large values for the Coulomb energy Ec will lead, in general, to large jumps in conductivity at the stress transition. Here theory predicts that jumps in conductivity near the first order stress transition (x = xs) will be more conspicuous with heavier cations (such as Ag or K) than with the lighter ones (Li).
Glasses become flexible at x xr as floppy modes start to proliferate and decrease the strain energy barrier. Electrical conductivity displays a second threshold at the rigidity transition x=xr , as the slope d/dx changes abruptly at the transition, and the variation of (x) becomes exponential above the threshold xr . Network flexibility clearly promotes ionic conductivity. In the flexible phase an increase in the available degrees of freedom appears to facilitate local network deformations, thus creating pathways for conduction. Furthermore, the present results also suggest that the increase in the number of possible hopping processes in the IP (region between xs and xr in Fig.7) is small and tends to produce saturation upon increasing modifier content (broken line in Fig. 7). This is to be compared to the dramatic increase of that mostly arises in the flexible phase as floppy modes proliferate, f 0 , and Es decreases sharply (Fig 9).
IV.3 Coulomb energy (Ec) and network stress energy (Es) in AgPO3-AgI
IV.3.1 Coulomb energy Ec and Ag+ ion mobilities
The Coulomb energy Ec represents the energy to create a Ag+ ion that would contribute to ionic conduction in the AgPO3-AgI electrolytes glass of interest. In its simplest form 14 , 40 it can be written as
| (17) |
where RAg-X and represent respectively an average Ag-X ( X = I, O) nearest-neighbour bond length and the high frequency permittivity. From the derived frequency dependence of the permittivity using the electric Modulus formalism, earlier in section IV A, we deduced the variation of (x) in the inset of Fig. 5. The quantity relates to the dielectric response in the immediate vicinity of a silver cation, and permits one to estimate the Coulombic barrier needed to create a mobile Ag+ cation. In the estimate of Ec we use an average of Ag-I, and Ag-O bond length of 2.43 and 2.85 for RAg-X in equation (16), and note that the RAg-I bond length remains largely constant with glass composition 41 . Furthermore, corrections due to many- body- effects arising from Ag+-Ag+ interactions can also be taken into account in equation (16) as suggested elsewhere 14 . The variations of Ec(x) thus largely results from that of (x) (Figure 5 inset), and these are reflected in the plot of Figure 9. We find that Ec varies between 0.05 eV to 0.10 eV across the broad range of compositions in the present glasses.
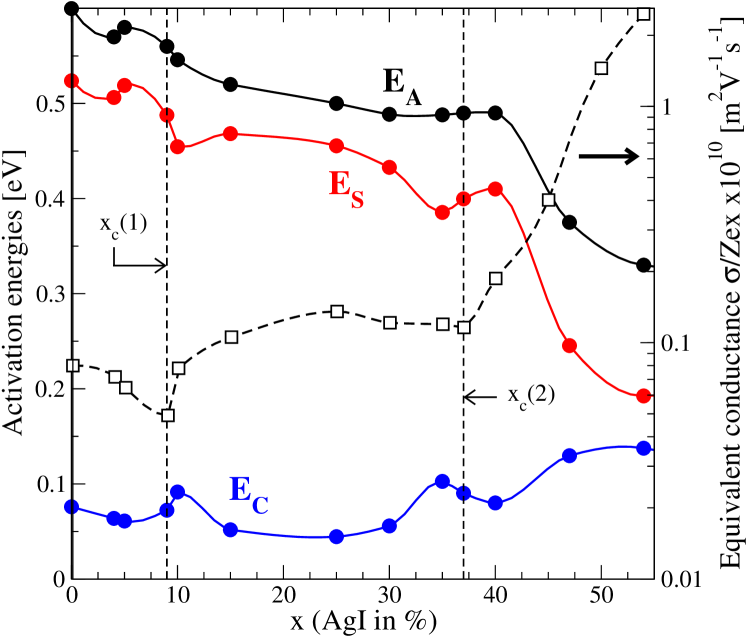
How do the present estimates of Ec compare to earlier ones in other systems ? Other groups report similar findings; in (Na2O)x(SiO2)1-x glasses, Greaves and Ngai 14 estimate Ec near 0.1eV to 0.2 eV, and the activation energies EA ( 0.6 eV). In (K2O)x(GeO2)1-x glasses, Jain et al. 40 estimate Ec to be 0.5 eV, typically 30% of EA ( 1.5 eV) at x 0.10. Reverse Monte Carlo Models of (AgPO3)x(AgI)1-x glasses by Wicks et al. have also emphasized Ec to be small 42 , and Es to be the major contributor to EA. A similar conclusion is reached by Adams and Swenson 43 , who explicitly reveal that strain energy dominates ionic conductivity. The present findings on Ec highlight once again that the low value of Ec appears to be generic feature of solid electrolytes.
109Ag NMR studies 27 of the base AgPO3 glass show the NMR resonance to be rather broad, fully consistent with its low conductivity ( 10.cm-1, see Fig 3), in which the Ag+ cations serve as compensating centers. Furthermore, the low value for Ec nearly 10% of the total activation energy EA found in the present AgPO3-AgI glassy alloys (Fig.9) suggests that the number of free Ag+ carriers varies linearly with the macroscopic AgI content ’x’ of the alloys. For this reason, the equivalent conductance /Zex, i.e. the change in conductivity per mole % of AgI, serves a good measure of ionic mobility (equation 1). Results on variation of the equivalent conductance are plotted in Fig. 10, right axis. Here one can see that while the nature of the elastic phases weakly affects Ec, and thus the free carrier density, they induce profound variations in the equivalent conductance, and thus carrier mobility. In particular, the two thresholds in equivalent conductance coincide with those noted earlier in the variations of (x) and (x) (Fig.3), which serve as benchmarks of the three elastic phases of the present glasses. In the flexible phase ( x 38%) , we observe a striking increase by a factor of nearly 20! in the 40% x 53% range.
109Ag NMR studies 27 have shown that the number of mobile carriers is nearly equal to the number of silver ions introduced by AgI. Using the simple relationship between and mobility (Equation (1)) Mustarelli et al. 27 estimated the variation in mobility (x) of carriers. Their data are also reproduced in Fig. 10 as the red filled circles. The corresponding equivalent conductance data on our samples are plotted in Fig. 10 as the open square data points. It is clear that the mobility in the present samples are at least an order of magnitude lower than in the samples of Mustarelli et al. 27 .
We believe these differences in (x) between the two sets of samples derive from sample makeup. The glass transition temperatures Tg(x) are a sensitive measure of bonded water in the base glass, AgPO3, as described earlier 11 . Presence of bonded water in the base glass depolymerizes the P-O-P chain network and softens the network. The samples of Mustarelli et al.27 show their base glass (AgPO3) Tg = 189oC , about 60oC lower than the Tg of our driest base glass of 254oC. Alloying AgI in the base glass will soften it further. Furthermore, in our samples we do not observe evidence of -AgI segregation in the 50% x 80% composition range as noted by Mustarelli et al. 27 in their samples. The order of magnitude larger mobilities observed by Mustarelli et al., most likely, derive from the flexible nature of glass compositions promoted by the presence of additional bonded water.
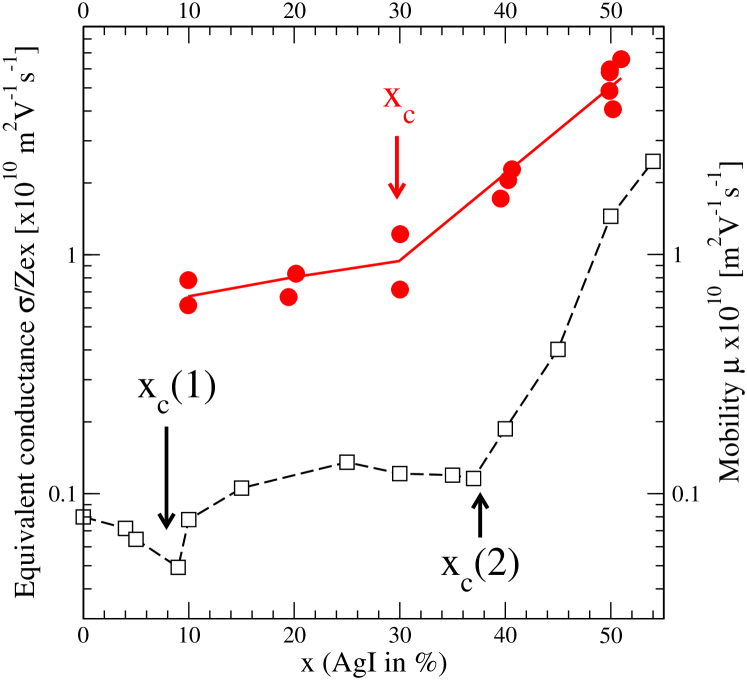
In our samples, we found 8 the IP composition range to be rather sensitive to water content of samples. For example, the IP-width nearly halved (28% to 15%) and the IP centroid moved up in AgI concentration from 24% to 28% in going from samples of set A (driest) to those of set B (drier). In samples of set B, the Tg of the base glass was 220oC, about 34oC lower than in samples of set A (Tg = 254oC). And possibly, the solitary conductivity (or mobility) threshold observed near x = 30% by Mustarelli et al.27 (Fig. 10) and separately by Mangion and Johari 28 in their samples may well represent the extremal case of a completely collapsed IP at its centroid near 30% in their samples giving rise to only one elastic threshold with the stress- and rigidity- transitions merging. These data highlight the importance of sample synthesis to establish the intrinsic electrical and elastic behavior of these glasses. The role of water traces in collapsing the IP in the present solid electrolyte glass is reminiscent of a collapse 47 of the IP observed in Raman scattering of a traditional covalent GexSe1-x glass, measured as a function of laser power-density used to excite the scattering. In both instances, the self-organized state with a characteristic intermediate range order formed, is irrevocably changed to a random network structure, in one case by OH dangling ends replacing bridging O sites and splicing the network, and in the other case by rapid switching of lone pair bearing Se centered covalent bonds by the action of near band gap light serving as an optical pump.
IV.3.2 Network Stress energy Es
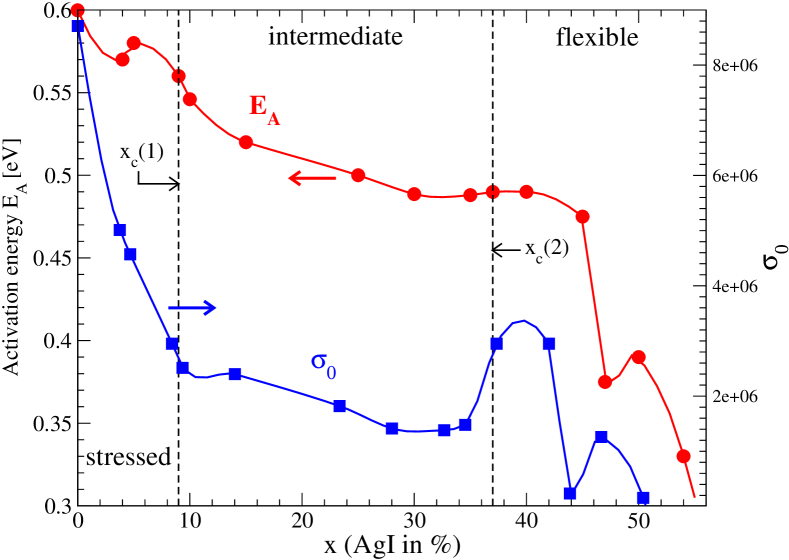
Estimates in Ec(x) permit obtaining variations in the network stress energy Es (=EA-Ec) from the measured activation energies EA(x) (Figs. 1 and 2). Variations in the activation energies EA(x), and Es(x) are plotted in Figure 8 for the reader’s convenience. A perusal of these data clearly reveals that the drastic increase of electrical conductivity in the 40% x 60% range is tied to a two-fold reduction in Es(x) (Fig. 9). Thus, even though the concentration of the electrolyte salt additive (AgI) increases linearly with x, changes in conductivity are not only non-linear in x, but display discontinuities at the stress (xc(1) = 9%) and the rigidity (xc(2)= 38%) elastic phase boundaries as discussed earlier.
The central finding to emerge from an analysis of our electrical conductivity results is that fast-ion conduction in dry AgPO3-AgI glasses is largely controlled by the elastic nature of their backbones. Recent work on alkali-earth silicates also shows evidence of conductivities increasing precipitously once glasses become elastically flexible at a threshold additive concentration 29 ; 45 .
IV.4 Kohlrausch stretched exponent and network dimensionality in AgPO3-AgI glasses
The Kohlrausch exponent usually reflects the degree of cooperativity of mobile ions in the glass, the smaller the the larger the collective behaviour of cation motion. From what is seen in Fig. 6, one can state that collective behaviour is enhanced in the intermediate phase.
We note that variation of the Kohlrausch exponent (x) displays a trend that is similar to that of the non-reversing heat flow (Fig.3b) , with values of of about 0.66 in the stressed-rigid and flexible phases, and a value of about 0.52 in the IP. These (x) data contrast with previous findings of the exponent in the GexAsxSe1-2x ternary glasses measured in flexure measurements where one found 46 that steadily increases in going from the flexible to the stressed-rigid phases. In the latter it converged to a value of 0.60 for a network mean coordination number larger than 2.4 corresponding to intermediate and stressed-rigid phase glasses.
The stretched exponent approaches 1 at high temperatures (T Tg) , and reduces as T decreases to Tg, i.e., (T Tg) 1. The reduction of usually reflects contraction of configuration space in the supercooled liquid and its eventual stabilization 48 due to structural arrest near T=Tg. On this basis at a fixed network dimensionality, one should expect that an increase in the number of Lagrangian constraints (or decrease of AgI content) will contract the configuration space, leading to lower values for . Fig. 6 obviously does not follow this anticipated behaviour as the dimensionality is changing with modifier content. Models of traps 48 -51 for tracer diffusion in a d-dimensional lattice show that is related to the dimensionality d via:
| (18) |
which is satisfied for various molecular supercooled liquids and glasses 51 having either a 3D ( = 3/5) or a 2D relaxation ( = 1/2). However, in the case where an internal structural dynamics takes place, the dimensionality d of networks must be replaced by an effective one, deff, involved in relaxation. This happens when Coulomb forces are present as the motion of the carriers is hindered by the tendency towards local charge neutrality, determining an effective dimensionality deff of the configuration space in which relaxation takes place 51 . In this case, the effective dimensionality becomes,
| (19) |
where Nd is the number of degrees of freedom in laboratory space and Nc is the number of mechanical constraints, estimated from short-range interactions. In the IP where , = 1/2 (Fig.6), equation (17) implies d = 2, resulting into a deff = 1 from equation (18). Outside the IP, = 3/5 (Fig.6), equation (17) implies d = 3, resulting into a deff = 1.5 from equation (18). Thus, presence of Coulomb interactions in AgPO3-AgI glasses, suggests filamentary (deff = 1) diffusion of Ag+ carriers in the IP, giving rise to percolative pathways in the self-organized structure. This conclusion is supported by numerical simulations 42 , which show that isolated sub-diffusive regions exist at low AgI concentration and these percolate as filaments at increased AgI concentrations in the 20% x 30% range.
V Concluding remarks
Dry and slow cooled (1-x)AgPO3-xAgI glasses synthesized over a broad range of compositions, 0 x 53% , are investigated in ac conductivity measurements as a function of composition, temperature and frequency. From these data compositional trends in activation energy for conductivity EA(x), Coulomb energy Ec(x) for Ag+ ion creation, Kohlrausch stretched exponent (x), low frequency permittivity (x) and high-frequency permitivity (x) are deduced. By combining rigidity theory with SICA and statistical mechanics, we have derived the analytic properties of the conductivity response function in a Ag based solid electrolyte. The topological model reproduces observed trends in the compositional variation of (x), including the observation of a step-like jump as glasses enter the Intermediate phase near xc(1)=9%, and an exponential increase when glasses become flexible at x xc(2)=38%. Since Ec is found to be small compared to network strain energy (Es), we conclude that free carrier concentrations increase linearly with nominal AgI concentrations, while the super-linear variation of fast-ion conduction can be traced to changes in carrier mobility induced by an elastic softening of network structure. By better understanding the role played by the ”alloyed network” on fast-ion conduction in a specific Ag based solid electrolyte glass, we have also taken a step towards better understanding ion-transport in several other types of solid electrolyte systems, including modified oxides and modified chalcogenides, systems that are also expected to display a parallel conductivity response as a function of network connectivity. Variations in (x) reveal a square- well like variation with walls localized near xc(1) and xc(2), and suggest filamentary ( quasi 1D) conduction in the Intermediate Phase ( xc(1) x xc(2)) but a dimensionality larger than 1 outside the IP. The present findings, characteristic of dry samples and showing two elastic thresholds, may possibly go over to only one elastic threshold in wet samples in which the IP completely collapses as suggested by earlier work in the field.
Acknowledgements
It is a pleasure to acknowledge discussions with Patrick Simon and Ping Chen during the course of this work. This work is supported in part by NSF Grant DMR 04-56472 and DMR 08-53957.
References
- (1) C. A. Angell, K. L. Ngai, G. B. McKenna, P. F. McMillan, and S. W. Martin, J. Appl. Phys. 88, 3113 (2000).
- (2) K.L. Ngai, S.W. Martin, Phys. Rev. B 40, 10550 (1989)
- (3) D.L. Sidebottom, Phys. Rev. Lett. 82, 3653 (1999).
- (4) A. Pradel, N. Kuwata, M. Ribes, J. Phys. Cond. Matt. 15, S1561 (2003)
- (5) S. Murugavel, B. Roling, Phys. Rev. Lett. 89, 195902 (2002).
- (6) St Adams, J. Swenson, Solid State Ionics 175, 665 (2004)
- (7) M. Malki, M. Micoulaut, F. Chaimbault, Y. Vaills, Physical Review Letters 96, 145504 (2006).
- (8) D.I. Novita, P. Boolchand, M. Malki, M. Micoulaut, J. Phys. Cond. Matter 21, 205106 (2009).
- (9) C. Bourgel, M. Micoulaut, M. Malki, P. Simon, Physical Review B 79, 024201 (2009).
- (10) M. D. Ingram, C. T. Imrie, J. Ledru, J.M. Hutchinson, J. Phys. Chem. B 112, 859 (2008).
- (11) D.I. Novita, P.Boolchand, Phys. Rev. B 76, 184205 (2007)
- (12) P.Boolchand, W.J.Bresser. Nature, 410, 1070 (2001)
- (13) M. Mitkova, Yu Wang, and P. Boolchand, Phys.Rev.Lett. 83, 19, 3848 (1999)
- (14) G.N. Greaves, K.L. Ngai, Phys. Rev. B 52, 6358 (1995).
- (15) G.N. Greaves, J. Non-Cryst. Solids 71, 203 (1985)
- (16) E. Sunyer, P. Jund, R. Jullien, Phys. Rev. B 65, 214203 (2002).
- (17) Y. Vaills, T. Qu, M. Micoulaut, F. Chaimbault, P. Boolchand, J. Physics: Cond. Matter 17, 4889 (2005).
- (18) J. Swenson, R.L. Mc Greevy, L. Börjesson, J.D. Wicks, Solid State Ionics 105, 55 (1998).
- (19) M. Gunawan, E. Kartini, E.G.R. Putra, J. Solid State Electrochem. 12, 903 (2008).
- (20) D.L. Sidebottom, Phys. Rev. B 61, 14507 (2000).
- (21) M. Le Stanguennec, S.R. Elliott, Solid State Ionics 73, 199 (1994).
- (22) F. Rossi, C. Armellina, S. Caoni, A. Fontana, F. Scarpa, Philos. Mag. 88, 4079 (2008).
- (23) M.D. Ingram, B. Macmillan, A.J. Pappin, B. Roling, J.M. Hut fchinson, Solid State Ionics 105, 103 (1998).
- (24) R. Bogue, R.J. Sladek, Phys. Rev. B 42, 5280 (1990).
- (25) J.H. Lee, S.R. Elliott, Phys. Rev. B 54, 12109 (1996).
- (26) S. Bhattacharya and A. Ghosh, Phys. Rev. B 70, 172203 (2004
- (27) P. Mustarelli, C. Tomasi, A. Magistris, L. Linati, Phys. Rev. B 63, 144203 (2001).
- (28) M. Mangion and G. P. Johari, Phys. Rev. B 36, 8845 (1987).
- (29) M. Malki, M. Micoulaut, D.I. Novita, B. Goodman, P. Boolchand, in Rigidity and Boolchand intermediate phases in nanomaterials, Eds. M. Micoulaut, M. Popescu, (INOE Publishing House, Bucarest) (2009) 37-64.
- (30) D. Novita, P. Boolchand, M. Malki, M. Micoulaut, Phys. Rev. Lett. 98, 195501 (2007).
- (31) C. Leon, P. Lunkenheimer, K.L. Ngai, Phys. Rev. B 64, 184304 (2001).
- (32) X. Feng, W.J. Bresser, P. Boolchand, Phys. Rev. Lett. 78, 4422 (1997).
- (33) M. Micoulaut, J.C. Phillips, Phys. Rev. B 67, 104204 (2003).
- (34) M. Micoulaut, Phys. Rev. B 74, 184208 (2006).
- (35) R.J. Elliot, L. Perondi, R.A. Barrio, J. Non-Cryst. Solids 168, 167 (1994)
- (36) L.F. Perondi, R.J. Elliott, R.A. Barrio, K. Kaski, Phys. Rev. B 50, 9868 (1994).
- (37) O. L. Anderson and D. A. Stuart, J. Am. Ceram. Soc. 37, 573 (1954)
- (38) S.R. Elliott, Solid State Ionics 27, 131 (1988).
- (39) W.A. Kamitakahara, R.L. Cappelletti and P. Boolchand, B. Halfpap, F. Gompf, D.A. Neumann and H. Mutka, Phys. Rev. B44, 94 (1991)
- (40) H. Jain, W. C. Huang, E. I. Kamitsos and Y. D. Yannopoulos, Journal of Non-Crystalline Solids 222, 361-368 (1997)
- (41) H. Takakashi, E. Matsubara, Y. Waseda, J. Mater. Sci. 29, 2536 (1994).
- (42) J.D.Wicks, L. Börjesson, G. Bushnell-Wye, W.S. Howells, R.L. McGreevy, Phys. Rev. Lett. 74, 726 (1995)
- (43) St. Adams, J. Swenson, Phys. Rev. Lett. 84, 4144 (2000).
- (44) J.F. Cordaro, M. Tomozawa, Phys. Chem. Glasses 25, 27 (1984).
- (45) M. Malki, M. Micoulaut, F. Chaimbault, Y. Vaills, P. Simon, Europhysics Letters 64, 661 (2003).
- (46) R. Böhmer, C.A. Angell, Phys. Rev. B. 45, 10091 (1992).
- (47) P. Boolchand, X. Feng, W.J. Bresser. J.Non-Cryst. Solids, 293, 348 (2001)
- (48) J.C. Phillips, J. Non-Cryst. Solids 182, 155 (1995).
- (49) R. Friedberg, J.M. Luttinger , Phys. Rev. B 12, 4460 (1975).
- (50) P. Grassberger, I. Procaccia , J. Chem. Phys. 77, 6281 (1982).
- (51) J.C. Phillips, Rep. Prog. Phys. 59, 1133 (1996)