Infrared anomalous Hall effect in SrRuO3: Evidence for crossover to intrinsic behavior
Abstract
The origin of the Hall effect in many itinerant ferromagnets is still not resolved, with an anomalous contribution from the sample magnetization that can exhibit extrinsic smit ; smit2 ; kats ; khalifah3 or intrinsic karplus ; berger ; ong ; jungwirth ; fang behavior. AHE_review We report the first mid-infared (MIR) measurements of the complex Hall (), Faraday (), and Kerr () angles, as well as the Hall conductivity () in a SrRuO3 film in the 115-1400 meV energy range. The magnetic field, temperature, and frequency dependence of the Hall effect is explored. The MIR magneto-optical response shows very strong frequency dependence, including sign changes. Below 200 meV, the MIR changes sign between 120 and 150 K, as is observed in dc Hall measurements. Above 200 meV, the temperature dependence of is similar to that of the dc magnetization and the measurements are in good agreement with predictions from a band calculation for the intrinsic anomalous Hall effect (AHE). fang The temperature and frequency dependence of the measured Hall effect suggests that whereas the behavior above 200 meV is consistent with an intrinsic AHE, the extrinsic AHE plays an important role in the lower energy response.
pacs:
I Introduction
CaxSr1-xRuO3 compounds exhibit unusual properties, such as metamagnetism, quantum criticality, non-Fermi liquid behavior and an anomalous Hall effect (AHE) that continue to challenge the condensed matter community. The Hall effect in SrRuO3 consists of two parts, the ordinary Hall effect (OHE) due to a magnetic field producing a Lorentz force on moving carriers and the AHE due to the sample’s magnetization . The Hall resistivity is given by:
| (1) |
The ordinary Hall coefficient is related to the carrier density. The anomalous Hall resistivity can be divided into two categories: 1) the extrinsic AHE arising from impurity scattering and 2) the intrinsic AHE due to the band structure. AHE_review The anomalous Hall resistivity is expressed as
| (2) |
where is the extrinsic AHE coefficient as a function of the longitudinal resistivity and is the intrinsic AHE transverse conductivity. The coefficient contains two terms, one proportional to and one that varies as :
| (3) |
where and are coefficients for two types of scattering processes. The first term is due to asymmetric (skew) scattering from impurities in the presence of magnetic order smit ; smit2 and is considered to be a classical extrinsic effect. The second term is called “side-jump scattering” from impurities, which has a quantum mechanical origin. karplus ; berger ; ong Note that although the side-jump scattering scales as just as the intrinsic AHE, and some consider them to be equivalent, the latter is simply proportional to while the former depends on through the function . While the dc AHE is observed in many itinerant ferromagnetic materials ranging from ruthenates to colossal magnetoresistance oxides to diluted magnetic semiconductors, the degree to which its origin is intrinsic fang ; lee2 ; jungwirth ; ong or extrinsic smit ; kats is still not resolved in many cases. AHE_review The dc AHE measurements by Ref. kats, have found that the sign change of occurs in SrRuO3 when cm. They considered only the extrinsic AHE and found this critical resistivity when , where the sign changes.
There have been extensive dc measurements kats ; khalifah3 to probe the temperature and magnetic field dependence of the Hall effect in SrRuO3. There has also been a low temperature study based on Kerr measurements to probe the frequency dependence of the Hall conductivity above 200 meV. fang To the best of our knowledge this work represents the first systematic study of the temperature, magnetic field, and frequency dependence of the Hall response in SrRuO3 in the 0.1 - 1.4 eV energy range. This range is particularly interesting since the only calculation to model the frequency dependence of the Hall conductivity of SrRuO3 predicts strong spectral features for in this range. fang This work provides the first experimental test of this model below 200 meV.
Conventional dc Hall effect measurements in novel electronic materials such as high temperature superconducting cuprates (HTSC), dchall diluted nagnetic semiconductors, and ruthenate perovskite materials have been essential in revealing the unusual character of these systems. Three major issues motivate the study of the MIR AHE in these materials. The first and most general argument is that since the understanding of dc AHE may be unresolved, studying the frequency dependence of the dynamic AHE can provide new information on the microscopic causes that are responsible for the AHE. Secondly, MIR measurements achall would probe more effectively the energy scales of the system (e.g., the plasma frequency, the cyclotron frequency and the carrier relaxation rates) and provide greater insight into the intrinsic electronic structure of a wide range of materials. au ; cerne_ybco The MIR range is highly appropriate since the typical band energy scale for the AHE in diluted magnetic semiconductors, jungwirth ; sinova ; Acbas_Kim_PRL09 SrRuO3, fang and other materials broderick ; sukhorukov is in the MIR. It is not surprising that the most striking spectral features in calculations of the AHE are in the MIR range. Unlike conventional MIR spectroscopy that measures the longitudinal conductivity , which is related to the sum of the sample’s response to left and right circularly polarized, MIR Hall measurements probe the Hall conductivity , which is related to the difference in the sample’s response to left and right circularly polarized light, and therefore is more sensitive to asymmetries such as spin-splitting etc. Finally, the dc Hall effect can be dominated by impurity scattering or grain boundary effects. This is especially important in new materials which often contain many impurities and defects. By probing the Hall effect at higher frequencies, the contribution from extrinsic scattering can be minimized.
Magneto-polarimetry measurements can be used to extend Hall effect measurements into the infrared frequency range ( Hz). These measurements are sensitive to the complex Faraday and Kerr angles, which are closely related to the complex Hall angle . au Since (and ) obeys a sum rule drew it is very useful to be able to integrate to higher frequencies to verify whether (and where) the Hall angle sum rule saturates or whether there is more relevant physics at even higher frequencies. Finally, since the high frequency behavior of is constrained by the general requirements of response functions, a simple, model-independent asymptotic form for becomes more accurate at higher frequencies.
In this paper, we report measurements of the MIR complex Faraday, Kerr, and Hall angles in SrRuO3 films in the 0.1 - 1.4 eV energy range. The transmitted and reflected magneto-optical responses in the MIR are qualitatively similar to results from dc Hall and dc magnetization measurements. The measurements are in good agreement with predictions from a band calculation fang above 200 meV. The deviations at lower energy are probably due to a stronger contribution from the extrinsic AHE.
II Experimental System
The Faraday and Kerr angles are measured using a sensitive polarization modulation technique instru_kim ; verdet_kim in the mid and near-infrared (MNIR) spectral range (115 - 1400 meV) for a SrRuO3 sample grown by pulsed laser deposition at Oak Ridge National Laboratory as described in Ref. khalifah2, . Several light sources such as various gas lasers, semiconductor lasers, and a custom-modified double pass prism monochromator with a Xe light source allow us to perform the measurement in a wide probe energy range. For details of the experimental technique see Refs. instru_kim, and verdet_kim, . The complex and angles are measured in the MNIR spectral range as a function of magnetic field up to 2 T and temperature from 10 K to 300 K. The small background Faraday signal from the cryostat windows and the film substrate has been subtracted from the data. The complex conductivities and and the complex Hall angle are determined directly from the measured complex and using the analysis techniques in Ref. instru_kim, .
The dc longitudinal and Hall resistivities of SrRuO3 were measured simultaneously using a four-probe van der Pauw geometry at UB’s Magneto-Transport Facility as well as at Oak Ridge National Laboratory using a Physical Property Measurement System (PPMS, Quantum Design) in a six-terminal configuration and 1 mA currents. khalifah2 Moreover, the film magnetization was measured by a SQUID magnetometer (Magnetic Property Measurement System; MPMS, Quantum Design) using a custom-modified sample holder, which enables measurements of the magnetization perpendicular to the film surface, which is the same configuration as our Faraday and Kerr measurements.
III Results
The Faraday and Kerr angles on the SrRuO3 were measured at various temperatures and a wide energy range to probe the anomalous Hall effect. The continuous broadband measurements allow us to extend and measurements to up to 1.4 eV. verdet_kim Although the intensity of broadband light is significantly weaker than that of lasers, and therefore the sensitivity is reduced, and are large and can be readily measured in this range. The analysis techniques to obtain the complex longitudinal () and transverse () conductivities and the MIR Hall angles () are based on the techniques in Ref. instru_kim, .
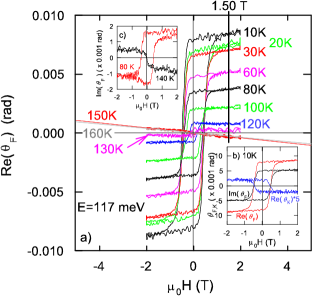
Figure 1 shows temperature dependence of and in SrRuO3 as a function of applied magnetic field at a photon energy of 117 meV. Both and exhibit ferromagnetic hysteresis until the magnetization disappears at the Curie temperature K. Figure 1a) presents as a function of at various temperatures. Note that the sign of the slope above 130 K is opposite of that observed at lower temperatures. Linear fits to the data at 150 and 160 K indicate non-monotonic behavior of the slope. The strongest change in occurs below 1.5 T, where the ferromagnetic hysteresis loops close.
The Figure 1b) shows and as a function of at 117 meV and 10 K. The magnitude of , which is not shown in Fig. 1b), is an order of magnitude smaller than that of . Typically, for metallic films like SrRuO3 in the MIR, the magneto-optic response in transmission () is larger than that obtained in reflection (), although the transmitted intensity of light can be as small as 0.01 %, because while where in metallic films. instru_kim For thicker and more metallic films, is much more sensitive to than in the MIR. Therefore, measuring magneto-optic signals in both transmission and reflection with a higher sensitivity provides the measurements reported here with a distinct advantage over the technique used in Refs. fang, and fang_som, , where only the reflected signal was measured. Moreover, the stronger signals are critical to explore the MIR Hall effect at higher temperatures, where the magneto-optical response is weaker.
It is not clear whether the sign change in is due to a sign change in the AHE component or the OHE component with opposite sign (from opposite charge carriers) which starts dominating at higher temperatures in Fig. 1a). However, the AHE nature of the sign change is clearly seen in the Fig. 1c), which shows at 80 K and 140 K at a probe energy of 117 meV. Here the sharp step near changes sign. The response of is quite linear in at the sign change, which occurs in temperatures between 130 K and 160 K where the magnetization is smaller due to the proximity to . On the other hand, unlike , the sign change in appears between 80 K and 140 K far . The opposite signs for the hysteresis loop steps in indicate the sign change is related to the magnetization, and hence due to the sign change in the AHE coefficient . The sign change in the ferromagnetic step near is not clearly seen in dc Hall measurements, which demonstrates another advantage of magneto-optical measurements in probing AHE materials.
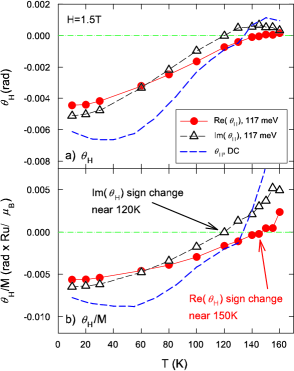
Figure 2 shows the Hall angle as a function of temperature at an applied magnetic field of 1.5 T and at a probe energy of 117 meV and 0 meV (dc). Since the hysteresis loops close below =1.5 T, this value of magnetic field is chosen to characterize the strength of the magneto-optical response. It is difficult to separate the OHE from the AHE above 1.5 T, because both Hall signals are linear in . Reference kitama, has reported that the magnetization in SrRuO3 does not saturate even at magnetic fields of 40 T and found that the anomalous Hall signal can be linear in up to 40 T. Although the separation of AHE from OHE has been done in dc measurements, kats it is more challenging to make this separation for MIR data. However, there are two regions where the OHE signal can be readily separated from the AHE signal. First of all, at lower temperatures and low magnetic fields, where magneto-optical response is ferromagnetic, is dominated by the AHE. For higher temperatures, it is still hard to separate AHE from OHE because the ferromagnetic response is weaker as the temperature increases towards . Second of all, the OHE is suppressed at higher frequency. The Drude model predicts that at as the probe frequency increases past the characteristic scattering frequency , and . au If one assumes that the linear part of the Hall angle () only comes from the OHE due to free carriers in Fig. 1, one can use the extended Drude model to calculate the Hall frequency , which is related to the carriers’ effective mass, and the Hall scattering rate . au ; cerne_ybco Furthermore, one can estimate the maximum contribution of the OHE to the overall Hall response. and produce , and . Slope of the linear behavior of the (and therefore ) in Fig. 1 at fields above 1.5 T is nearly constant from 10 K to 80 K. The slope translates into cm-1/T ( meV/T) and cm-1 (137 meV). Assuming that the carrier scattering is isotropic, one can use to obtain a carrier effective mass of , where is the bare electron mass. Since the Hall scattering rate is close to 117 meV, one can expects that when . The value of OHE given by the linear part of the hysteresis is less than 3% of the total Hall response. Likewise, the OHE is much smaller at the higher frequencies over 117 meV due to .
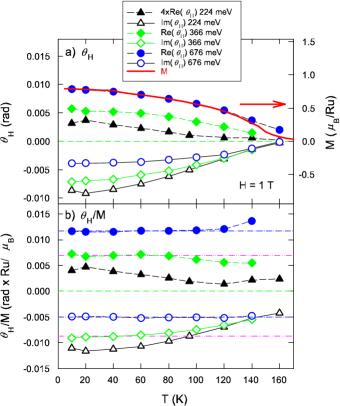
Figure 2a) shows the sign change of and at 117 meV near 130 K, where the Hall sign change is observed in dc measurements (dashed line). The magnitude and temperature behavior of at 117 meV and dc are very similar. The sign change of appears at a slightly lower temperature, deeper in the ferromagnetic phase, than . It may explain why the sign change of is more clearly seen in Fig. 1. The magnitudes of both and are slightly smaller than that of dc. The dc Hall angle exhibits a minimum value near 40 K, but at 117 meV both and increase monotonically with temperature. at 117 meV rises more steeply than , changes sign earlier, and reaches a maximum value near 140 K. Since the MIR Hall angles mostly come from the AHE, the is associated with the magnetization . Figure 2b) shows the Hall angles divided by the measured , which is shown in Fig. 3a) (solid line). The sign change in and is clearly seen. The sign change in occurs near 120 K and in near 150 K. These are symmetrically separated from the dc Hall sign change temperature.
Figure 3 shows the temperature dependence of the dc magnetization and at higher energies of 224, 366, and 676 meV, which is obtained from the formula of . In this case, no longer changes sign as it does at 117 meV and dc measurements, instead approaches zero gradually as shown in Fig. 3a). As the probe energy increases, behaves more like the magnetization . The solid line in Fig. 3a) represents the measured magnetization, which is saturated at lower temperature to 0.8 . At an energy of 676 meV, and exhibit the same dependence over nearly the entire range as shown in Fig 3a). Typically, visible and near-infrared Faraday and Kerr measurements are used to determine the magnetization of materials. Figure 3b) plots at higher energies of 224, 366, and 676 meV at 1 T. The horizontal guide lines show behavior where is proportional to . At a probe energy 676 meV the value of is a constant at all temperatures, but at 366 meV this is the case only at lower temperatures.
Figure 4 shows the anomalous Hall part of and at 10 K and 0 T with the sample fully magnetized out of plane as a function of probe energy. As seen before, the OHE contribution is small, especially at higher energies at T. In addition, since the measurement is performed at = 0 T and OHE is proportional to , even small OHE cannot contribute to this Hall signal. Both and display a strong energy dependence and change sign mostly at lower energies, but monotonically increase or remain fairly constant at higher energies as shown in Fig. 4. The energy dependence of and is similar. The sign changes are observed at low energies near 250 meV for and 130 meV for . Both signs change from negative to positive as energy increases. Note that the signs are defined and determined in Ref. instru_kim, . Likewise, and exhibit similar features. However, both sign changes appear near 800 meV. The sign of also changes from negative to positive, but the sign of behaves oppositely. The dc values of and in Fig. 4 are determined in Ref. instru_kim, connect smoothly with the MIR data as .
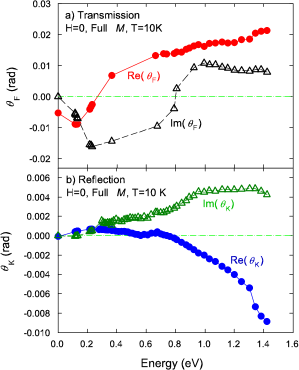
Figure 5 shows the measured and calculated complex a) longitudinal conductivity and b) transverse (AHE) conductivity as a function of probe energy. The symbols are obtained from and in Fig. 4 using the analysis techniques in Ref. instru_kim, . One advantage of determining both and from the same set of and measurements is that the behavior of , which is fairly well known in this energy range, kostic can be provide a consistency test for , which is not well known. As experimentally seen in Ref. instru_kim, , the complex from and is in good agreement over the entire energy range with obtained from reflectance measurements on a different SrRuO3 film, kostic which has a factor of 3 smaller dc resistivity. On the other hand, theoretical predictions for the AHE have been limited at finite energies, although several different models are used to explain the dc AHE in SrRuO3. smit ; berger ; fang ; kats Here we compare the measured MIR conductivities with predictions from a Berry-phase calculation for SrRuO3. fang The solid lines (the real part of and ) and dashed lines (the imaginary part of and ) are from a Berry phase calculation of the intrinsic AHE by Z. Fang and coworkers. fang The calculated complex in Fig. 5a) clearly deviates from the measured . This is not surprising since the model neglects intraband transitions, which play a dominant role at lower energies in a metal. For energies over 200 meV, the calculation agrees qualitatively and in some energy regions quantitatively with the measured value. So unlike the calculation, there is no sign change of the measured in our energy range.
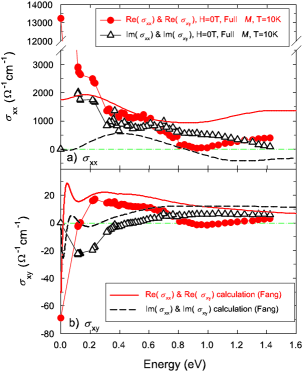
Since the goal of this calculation was to provide insights into the behavior of , it is encouraging that the agreement between the calculated and measured values of is significantly better, as can be seen in Fig. 5b), which shows the anomalous Hall response. The Fang model predicts a sign change from electron-like at low energy to hole-like at higher energies in both and . The measured changes from electron-like for energies below 150 meV to hole-like at higher energies. The measured appears to make the same change above 400 meV. Both and extrapolate smoothly to their dc values. Unlike conventional metals like gold, which can be modeled using a single band in the infrared and where Drude behavior (intraband transition) are responsible for the infrared Hall effect, in SrRuO3 both intraband and interband transitions contribute, so the “electron-like” description is only meant to indicate signs, not the microscopic origin of the Hall effect. Of course, in the dc limit the OHE is solely due to intraband (Drude) behavior. Above 300 meV, the calculated and values run roughly parallel to the measured ones. The crossing of and is observed in both the calculated and measured values near 1 eV and 0.8 eV, respectively. Below 300 meV, exhibits a peak near 200 meV in both the calculation and measurements. Another sharp peak-like structure is predicted in near 50 meV. However, the measured has already dipped below zero at 120 meV, in strong contrast to the theoretical upturn at 100 meV, and is heading towards the dc value smoothly. For , the calculation and the measurements shows the zero-crossing near 300 meV and 500 meV, respectively. As with the calculated , the calculated also exhibits sharp peaks near 130 and 15 meV, but the slope and the large negative offset of the measured suggests that it will continue monotonically towards its dc value of zero. It is interesting to note that the over the entire measured energy range, the calculated generally agrees better with the data than the calculated . These measurements strongly support the validity of the Berry phase model for describing the anomalous Hall response of SrRuO3 above 200 meV, but below 200 meV the measurements do not follow theoretical predictions.
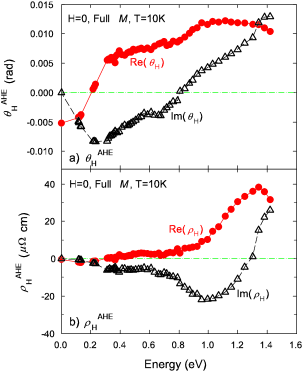
Figure 6 shows the measured complex a) Hall angle and b) Hall resistivity at 10 K and 0 T (sample fully magnetized out of plane). For low energies, is nearly constant in the 0 - 120 meV range, whereas increases linearly in the same range. The low energy MIR results extrapolate smoothly to the dc values, suggesting that there are no additional features in the 0 - 120 meV range. Above 100 meV, increases more rapidly with increasing energy, changes sign near 200 meV, and increases monotonically over most of measurement range. reaches a minimum value near 200 meV, changes sign near 800 meV, and becomes more positive as energy increases. The energy dependence of in Fig. 6b) is nearly constant below 0.8 eV, but above this energy the value of increases an order of magnitude. Above 0.8 eV has peak near 1.3 eV, where changes sign. Additionally, has a minimum value near 1 eV.
IV Discussion
Exploring the Hall effect in SrRuO3 as a function of magnetic field , temperature , and frequency (or MNIR energy) can provide new insights into the material as well as the AHE in general. We have seen the MNIR (or ) is consistent with the predictions from an intrinsic AHE calculation for energy greater than 200 meV. On the other hand, the frequency, temperature and magnetic field dependence below 200 meV may be more consistent with expectations from the extrinsic AHE. In this discussion, we explore the evidence for a crossover between intrinsic and extrinsic behaviors in the MIR energy range. Since the extended Drude model (EDM) was successfully applied to the IR in SrRuO3 kostic , we will compare EDM predictions for and with our measurements in order to disentangle OHE and AHE contributions. Secondly, we apply the extrinsic AHE model to the temperature dependent at 117 meV to test this model at and near dc.
The EDM is more important at lower energy, because it models the intraband transitions which are dominant at and near dc. Note that the EDM considers the frequency dependent relaxation time and plasma frequency , which are renormalized by the mass enhancement factor . The longitudinal conductivity is defined in EDM as
| (4) |
where renormalized scattering rate is , and frequency-dependent plasma frequency . The bare plasma frequency of the free electron gas can be calculated by the carrier density. This model was used in SrRuO3 to probe possible non-Fermi-liquid behavior exhibited in reflectance measurements. kostic It was reported that falls like and increases linearly with in the energy range between 0 to 1000 cm-1 (124 meV) at low temperature. The renormalized scattering rate is given by the formula , which is derived from Eq. (4), and using data in Fig. 6a). The scattering rate obtained from our increases fairly linearly with in the energy range of 116 - 600 meV (900 - 4800 cm-1) and 10 K. Furthermore, in the same energy range the conductivity drops like . Our results for based on and measurements are consistent with that in Ref. kostic, .
The EDM allows one to extract the carrier density of the electron gas. One way to obtain is from the OHE. The Hall scattering parameters are extracted from the linear in behavior of at low temperatures, assuming that this slope is solely due to the OHE. At 117 meV we obtain , , and a carrier effective mass of 2.99 . Likewise, the MIR Hall coefficient can be determined from the linear behavior of . The coefficient is given by:
| (5) |
In a simple Drude model where is constant, is purely real and constant. Considering only at 117 meV, one can estimate electrons/cm3 from using the formula , where is the electron charge. This value is nearly within a factor of two of that obtained in dc measurements by Khalifah and coworkers, khalifah2 where electrons/cm3 (or electrons/cm3 from Ref. izumi, ). This discrepancy is probably due to the fact that the linear behavior is not completely due to the OHE, but also the AHE. If 50% of the net linear Hall angle signal at 117 meV between 1.5 and 2 T resulted from the AHE, leading to a factor of two decrease in the contribution from the OHE, the carrier density obtained from the slope of at 117 meV, at 10 K, and above 1.5 T would be electrons/cm3. The carrier density electrons/cm3 corresponds to the plasma frequency cm-1, while electrons/cm3 corresponds to cm-1. According to Ref. kostic, , the mass enhancement factor approaches 1 as the energy exceeds 1000 cm-1. It means that is satisfied from 1000 cm-1 up to 4800 cm-1, where . For the EDM , the appropriate partial sum is
| (6) |
where is a cutoff frequency. To stay consistent with the analysis in Ref. kostic, , we fit the measured to the formula , where is a fitting parameter. If the partial sum is performed to cm-1, then cm-1, which corresponds to a carrier density electrons/cm3. For cm-1, cm-1, which corresponds to electrons/cm3. These values of carrier density are qualitatively in agreement with the values obtained from the OHE and dc measurements. The scattering parameters determined from the EDM reveal that intraband transitions play an important role in below 100 meV.
As with the MIR , the behavior of can be divided into two distinct regions at 200 meV. Below 200 meV, the MIR is similar to the dc as in Figs. 2 and 3, but above 200 meV it looks like the dc magnetization . The agreement in between the measurement and the strictly interband, intrinsic, Berry phase model at energies below 200 meV is not as good as at higher energies as shown in Fig. 5b). Moreover, the EDM analysis suggests that intraband transitions are important to and even more important to at energies below 100 meV. One possible reason for discrepancy between measurement and theory at low energies is that the lifetime broadening used in the calculation is too small for the SrRuO3 film measured here, which exhibits much broader features. Another possibility is that the intrinsic model does not include intraband transitions, which play an important role near dc.
Since much of the dc AHE is commonly framed using Eqs. (1) and (3), it is interesting to study the temperature and frequency dependence of in terms of these equations. The simplest generalization to finite frequency of the extrinsic AHE is to simply use the frequency dependent resistivity in Eqs. (1) and (3) at = = 0 T:
| (7) |
Although this generalization is not rigorously correct, it can provide insight into the lower energy AHE. If one considers only the extrinsic AHE at or near dc, the sign change appears to be due to a change in sign of the AHE coefficient . In Ref. kats, , the dc AHE always vanishes at the same value of cm, where , which suggests that the extrinsic AHE is dominant at dc. In our dc measurements, the sign change occurs at approximately cm. If one applies Eq. (7) using to the sign change at 117 meV, the sign change of appears at cm and that of occurs at cm. Typically, the longitudinal resistivity at 117 meV is two or three times larger than the value at dc because at lower energies. According to Eq. (7), the sign change occurs when . The parameters (skew scattering) and (side-jump scattering) are derived from microscopic origins. smit ; smit2 ; berger The analysis at 117 meV reveals that and are energy-dependent. Therefore, from and since grows with , it could be interpreted that the skew scattering term grows with respect to the side-jump scattering term as energy increases for 0 to 117 meV. Another point of view is that the skew scattering is more sensitive to the probe energy than the side-jump scattering below 117 meV. Since the OHE is zero at T or negligibly small even at at the probe energy used here, the measured value is mostly contributed by the AHE.
To sum up the results, the intrinsic AHE model qualitatively agrees with the measurements above 200 meV and the disagreement between the intrinsic AHE model and the measurements at low energies is most likely due to the extrinsic AHE. This is a reasonable conclusion, since the extrinsic AHE originates from carrier scattering from impurities/defects. At low frequency, the carriers scatter many times in each driving cycle, resulting in a response that is similar to the dc Hall effect. At high driving frequencies, the carriers oscillate many times before experiencing a scattering event, and hence the Hall response is dominated by the dynamics of the oscillations (band structure) and not by the magnetic scattering. One could expect that the characteristic frequency at which the extrinsic Hall effect begins to disappear is the impurity scattering frequency. Since the total scattering rate includes the impurity scattering rate, the extrinsic AHE should start decreasing at a frequency at or below the total scattering rate. It is interesting that the upper limit for the impurity scattering rate is similar in magnitude as the frequency above which: 1) the intrinsic AHE model begins to approach the measurements of ; 2) the temperature dependence of the MIR Hall effect loses its dc character; and 3) the Drude-like behavior in significantly decreases. Therefore, the upper limit for the impurity scattering rate appears to be near 1600 cm-1 (200 meV). This confirms the importance of the extrinsic AHE in dc and low frequcny measurements, kats ; khalifah3 but also shows the transition to more intrinsic behavior at higher frequencies. Our measurements suggest that by increasing the probe energy beyond 200 meV, the AHE makes a transition from an extrinsic to an intrinsic character. We find that the Berry phase model accurately describes the MIR AHE of SrRuO3 above 200 meV.
Acknowledgements.
We thank K. Takahashi, A.J. Millis, N.P. Ong, and J. Sinova for helpful discussions. We also wish to thank B.D. McCombe for the use of UB’s Magneto-Transport Facility. This work was supported by Research Corporation Cottrell Scholar Award, NSF-CAREER-DMR0449899, and an instrumentation award from the University at Buffalo, College of Arts and Sciences.References
- (1) J. Smit, Physica 21, 877 (1955).
- (2) J. Smit, Phys. Rev. B 8, 2349 (1973).
- (3) Y. Kats, I. Genish, L. Klein, J.W. Reiner, and M. R. Beasley, Phys. Rev. B 70, 180407(R)1-4 (2004).
- (4) P. Khalifah, I. Ohkubo, B.C. Sales, H. Christen, D. Mandrus, and J. Cerne, Phys. Rev. B 76 054404 (2007).
- (5) R. Karplus and J. M. Luttinger, Phys. Rev. 95, 1154 1160 (1954).
- (6) L. Berger, Phys. Rev. B 2, 4559 (1970).
- (7) W.-L. Lee, S. Watauchi, V. L. Miller, R. J. Cava, and N. P. Ong, Science 303, 1647 (2004).
- (8) T. Jungwirth, Q. Niu, and A. H. MacDonald, Phys. Rev. Lett. 88, 207208/207201-207204 (2002).
- (9) Z. Fang, N. Nagaosa, K. S. Takahashi, A. Asamitsu, R. Mathieu, T. Ogasawara, H. Yamada, M. Kawasaki, Y. Tokura, and K. Terakura, Science 302, 92-95 (2003).
- (10) N. Nagaosa, Jairo Sinova, S. Onoda, A. H. MacDonald, and P. Ong, accepted for publication to Review of Modern Physics (2009); arXiv:0904.4154.
- (11) W. L. Lee, S. Watauchi, V.L.Miller, R.J.Cava, and N.P.Ong, Science 303, 1647-1649 (2003).
- (12) J.M. Harris, Y.F. Yan, and N.P. Ong, Phys. Rev. B 46, 14293 (1992).
- (13) H.D. Drew, S. Wu, and H.-T.S. Lihn, J. Phys.: Condens. Matter 8, 10037 (1996).
- (14) L.D Landau, Sov. Phys. JETP 3, 920 (1957); 5, 101 (1957); and 8, 70 (1959).
- (15) For example, see S.G. Kaplan, S. Wu, H.-T.S. Lihn, H.D. Drew, Q. Li, D.B. Fenner, J.M. Phillips, and S.Y. Hou, Phys. Rev. Lett. 76, 696 (1996).
- (16) Y. Tokura et al., J. Phys. Soc. Jpn 63, 3931 (1994), K. Chabara et al., Appl. Phys. Lett. 63, 1990 (1993), R. v. Helmholt et al., Phys. Rev. Lett. 71, 2331 (1993), and S. Jin et al., Science 264, 413 (1994), S.G. Kaplan, M. Quijada, H.D. Drew, D.B. Tanner, G.C. Xiong, R. Ramesh, C. Kwan, and T. Venkatesan, Phys. Rev. Letters 77, 2081 (1996).
- (17) J. Sinova, T. Jungwirth, J. Kucera, and A. H. MacDonald, Phys. Rev. B 67, 235203/235201-235212 (2003).
- (18) G. Acbas, M.-H. Kim, M. Cukr, V. Novák, M.A. Scarpulla, O.D. Dubon, T.Jungwirth, Jairo Sinova, and J. Cerne, Phys. Rev. Lett. 103 137201 (2009)
- (19) S. Broderick, L. Degiorgi, H. R. Ott, J. L. Sarrao, and Z. Fisk, Eur. Phys. J. B 27, 3-6 (2002).
- (20) Yu.P. Sukhorukov, E. A. Ganshina, B. I. Belevtsev, N. N. Loshkareva, A. N. Vinogradov, K. D. D. Rathnayaka, A. Parasiris, and D. G. Naugle, J. Appl. Phys. 91, 4403 (2002).
- (21) J. Černe, D.C. Schmadel, M. Grayson, G.S. Jenkins, J. R. Simpson, and H. D. Drew, Phys. Rev. B 61, 8133 (2000).
- (22) H.D. Drew and P Coleman, Phys. Rev. Lett. 78, 1572 (1997).
- (23) J. Cerne, D. C. Schmadel, L. Rigal, and H. D. Drew, Rev. Sci. Instr. 74, 4755-4767 (2003).
- (24) Science Supporting Online Materials for Ref. fang, available at www.sciencemag.org.
- (25) M.-H. Kim, G. Acbas, M.-H. Yang, I. Ohkubo, H. Christen, D. Mandrus, M. A. Scarpulla, O. D. Dubon, Z. Schlesinger, P. Khalifah, and J. Cerne, Phys. Rev. B 75, 214416 (2007).
- (26) M.-H. Kim, V. Kurz, G. Acbas, C. T. Ellis, J. Cerne, arXiv:0907.3128.
- (27) J. Černe, M. Grayson, D.C. Schmadel, G.S. Jenkins, H. D. Drew, R. Hughes, J.S. Preston, and P.J. Kung, Phys. Rev. Lett. 84, 3418 (2000).
- (28) P. Kostic, Y. Okada, Z. Schlesinger, J. W. Reiner, L. Klein, A. Kapitulnik, T. H. Geballe, and M. R. Beasley, Phys. Rev. Lett. 81, 2498 (1998).
- (29) P. Khalifah, I. Ohkubo, H. M. Christen, and D. G. Mandrus, Phys. Rev. B 70, 134426 (2004).
- (30) I. Ohkubo, H. M. Christen, S. Sathyamurthy, H. Y. Zhai, C. M. Rouleau, D. G. Mandrus, and D. H. Lowndes, Appl. Surf. Sci. 223, 35 (2004).
- (31) M. Izumi, K. Nakazawa, Y. Bando, Y. Yoneda, and H. Terauchi, J. Phys. Soc. Jpn. 12, 3893 (1997)
- (32) T. Kitama, K. Yoshimura, K. Kosuge, H. Mitamura, and T. Goto, J. Phys. Soc. Jpn. 68, 3372 (1999).
- (33) L. Klein, J. S. Dodge, C. H. Ahn, G. J. Snyder, T. H. Geballe, M. R. Beasley, and A. Kapitulnik, Phys. Rev. Lett. 77, 2774 (1996).