The hunt for at the Daya Bay nuclear power plant
Abstract
The Daya Bay reactor neutrino experiment is located at the Daya Bay nuclear power plant in Shenzhen, China. The experiment deploys eight “identical” antineutrino detectors to measure antineutrino fluxes from six 2.9 GWth reactor cores in three underground experimental halls at different distances. The target zone of the Daya Bay detector is filled with 20 t 0.1% Gd doped LAB liquid scintillator. The baseline uncorrelated detector uncertainty is 0.38% using current experimental techniques. Daya Bay can reach a sensitivity of to with baseline uncertainties after 3 years of data taking.
Keywords:
Daya Bay, reactor neutrino, neutrino mixing:
14.60.Pq1 Introduction
Neutrino oscillation due to neutrino mass eigenstate mixing has become a well established theory accounting for the solar, atmospheric, long-baseline and reactor neutrino experimental observations in recent years Amsler et al. (2008). In the neutrino mixing matrix, we currently have relatively good knowledge of the values of and from solar, long-baseline reactor neutrino experiments, atmospheric and long-baseline accelerator neutrino beam experiments. However, we still have limited knowledge about the third neutrino mixing angle, . The current best direct experimental limit, from the Chooz experiment, indicates that at 90% confidence level (C.L.) assuming Apollonio et al. (2003). The Palo Verde experiment established an upper bound of assuming the same value Piepke et al. (2002). We currently have no measurements of the Dirac phase in the mixing matrix since value is not known. The value of is also essential for the planning of next generation long baseline neutrino experiments Barger et al. (2007).
One way to measure the value of is to measure survival probabilities of electron type antineutrinos from nuclear reactors at the scale of the atmospheric mass-squared splitting:
where is assumed. This was the technique used by both Chooz and Palo Verde experiments. However, both experiments only deployed one detector. To improve the sensitivity, one solution is to use multiple detectors at different distances to cancel correlated systematic uncertainties. With many other improvements, the Daya Bay reactor neutrino experiment is designed based on this near-far strategy to measure the value down to level Cao (2006); Wang (2006); Guo et al. (2007); Chu (2008).
2 The Daya bay experiment
The Daya Bay reactor neutrino experiment is located at the Daya Bay nuclear power plant in Shenzhen, China. The experiment deploys eight “identical” 20 t antineutrino detectors (AD) in three underground experimental halls: the Daya Bay near hall (DYB), the Ling Ao near hall (LA) and the far hall. Figure 1 shows the layout and the arrangement of six 2.9 GWth reactor cores and 8 ADs.
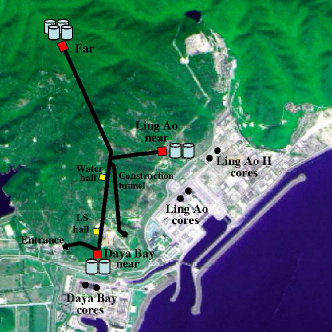
Table 1 shows the baselines between different reactor sites and experimental sites. Table 2 shows expected numbers of inverse beta decay (IBD) events, the depth, the muon rates and estimated backgrounds of each experimental site.
| DYB | LA | far | |
|---|---|---|---|
| Daya Bay | 363 | 1347 | 1985 |
| Ling Ao I | 857 | 481 | 1618 |
| Ling Ao II | 1307 | 526 | 1613 |
| DYB | LA | far | |
| IBD Event/AD/day | 840 | 760 | 90 |
| Hall depth (m) | 98 | 112 | 350 |
| Muon Rate/AD (Hz) | 36 | 22 | 1.2 |
| Accidental B/S (%) | |||
| Fast neutron B/S (%) | 0.1 | 0.1 | 0.1 |
| B/S (%) | 0.3 | 0.2 | 0.2 |
3 Design and performance of the detector system
As shown in Fig. 2, the Daya Bay AD adopts a 3-zone design. The inner-most region is the target zone defined by a 3 m diameter and 3 m tall acrylic vessel (AV), filled with 20 t 0.1% Gd doped liquid scintillator LAB (linear alkaline benzene). Surrounding the target zone, 20 t undoped liquid scintillator LAB, held by a 4 m diameter 4 m tall acrylic cylinder, functions as the gamma catcher, i.e. to catch the gammas from the reactions inside the target zone. Outside the gamma catcher, a 5 m diameter 5 m tall stainless steel tank holds mineral oil, 192 PMTs, top and bottom reflectors, radial shields and other supporting structures. The 192 PMTs plus the top and bottom reflectors provide 12% effective photocathode coverage. On the top of each AD, there are 3 overflow tanks to accommodate any expansions or contractions of corresponding liquids due to temperature changes and potential deformations during transportation. Three automatic calibration units (ACU) are also placed on the top of the AD.
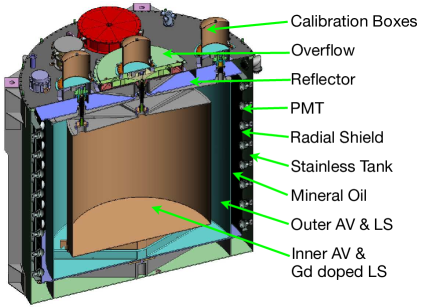
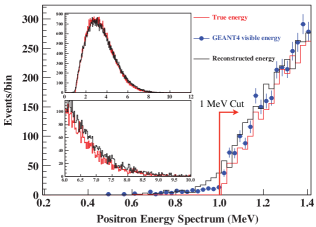
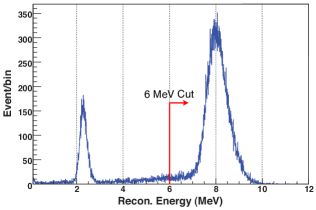
The ADs detect antineutrinos via IBD reactions, . A 1 MeV cut is chosen to select the prompt positron signal. The final state neutron in the target zone has an 85% chance of being captured by a Gd atom in 28 . The excited Gd atom goes back to ground state by emitting gammas with a total energy of 8 MeV. A 6 MeV cut is chosen to select the time correlated neutron. The two cut values are established by the calibration system. ACUs are instrumented with 3 calibration sources: to provide positrons, and to provide 2.5 MeV gammas and 4 MeV neutrons, and a LED diffuser ball to provide signals to calibrate PMT gains and timing.
The relative energy scale uncertainty of ADs is expected to be 1% and 2% at 6 MeV and 1 MeV respectively. Figures 3 and 4 show the prompt positron and the delayed neutron capture energy spectra and cut positions. The 1 MeV positron cut efficiency is greater than 99.5% and its uncertainty is negligible. The 6 MeV Gd-captured neutron cut efficiency is 91.5% and its uncertainty is 0.22%. Adding all factors, we expect the baseline value of the uncorrelated detector systematic uncertainty 0.38%; the goal value of 0.18% is achievable with ongoing R&D; swapping the ADs between near and far sites is a possible option and it can further reduce the uncertainty to 0.12% Guo et al. (2007).
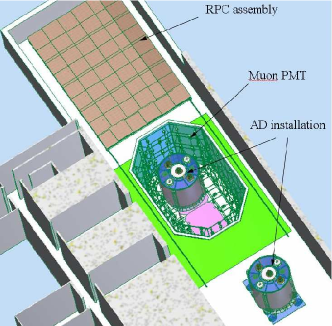
ADs at each experimental site are submerged in a muon veto system which is a water Cherenkov detector covered by four layers of RPCs. Dimension of the water pool provides at least 2.5 m water shield to ADs in every direction. Based on our simulation, the muon veto efficiency is expected to be and the muon event rate at each site is shown in Table 2.
To make ADs as “identical” as possible, we build acrylic vessels and fill ADs in pairs. The assembly of ADs is performed in the surface assembly building (SAB) near the Daya Bay tunnel entrance and the filling of ADs is carried out in the LS Hall inside the tunnel, see Fig. 1. A custom designed automatic guided vehicle is used to move empty and filled ADs to different halls and sites. For a more detailed description of the Daya Bay detector system and its assembly, transportation and installation, see Ref. Guo et al. (2007).
4 Sensitivity
The Daya Bay sensitivity is calculated using the pull method Fogli et al. (2002). Considering all systematic uncertainties, the chi-square is defined as
where, and are the measured and expected IBD events in the -th energy bin of the -th detector; , and are the accidental, fast neutron and backgrounds; , , and are nuisance parameters; is the reactor core index. Systematic corrections to the expected number of IBD events in each bin is considered in the following way,
here are expected IBD events without considering systematic effects and are reactor flux weight factors due to their different baselines.
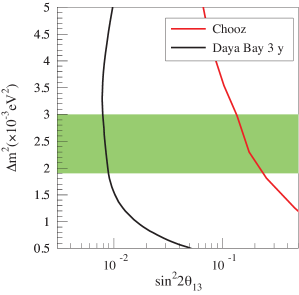
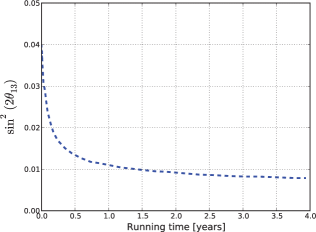
Systematic uncertainty values used in the calculation are shown in Table 3. The value of the bin-to-bin systematic uncertainty 0.3% is based on background estimations in each bin Guo et al. (2007). We have assumed conservative uncertainties on reactor antineutrino flux prediction Vogel and Engel (1989); Nakajima et al. (2006); Vogel (2007); Djurcic et al. (2009) and correlated detector effects, which are mainly due to IBD cross section uncertainty Kurylov et al. (2003). Minimizing the chi-square with respect to all nuisance parameters, we are able to predict the Daya Bay sensitivity as shown in Fig. 5 and Fig. 6.
| Description | Value | |
|---|---|---|
| Uncorrelated core uncertainty | 2.0% | |
| Correlated core uncertainty | 2.0% | |
| Spectrum shape uncertainty | 2.0% | |
| Correlated detector uncertainty | 2.0% | |
| Uncorrelated detector uncertainty | 0.38% | |
| Bin-to-bin uncertainty | 0.3% | |
| Accidental uncertainty | 0.3% | |
| Fast neutron uncertainty | 0.3% | |
| uncertainty | 0.3% |
5 Summary and conclusions
The unknown third mixing angle in the neutrino mixing matrix is the gateway to physics in lepton sector and the planning of next generation long baseline neutrino experiments greatly depends on its value. Using the six 2.9 GWth reactor cores at the Daya Bay nuclear power plant in Shenzhen, China, the Daya Bay reactor neutrino experiment deploys eight “identical” detectors at three experimental sites. The near-far arrangement of these eight “identical” detectors cancels the correlated uncertainties in reactor antineutrino fluxes and antineutrino detectors. The Daya Bay design makes swapping ADs a possible option. With baseline systematic uncertainties, the Daya Bay experiment can reach a sensitivity of to with 3 years of data taking. Ongoing R&D and the optional swapping can further improve the sensitivity.
References
- Amsler et al. (2008) C. Amsler, et al., Phys. Lett. B667, 1 (2008).
- Apollonio et al. (2003) M. Apollonio, et al., Eur. Phys. J. C27, 331–374 (2003), hep-ex/0301017.
- Piepke et al. (2002) A. Piepke, et al., Progress in Partical and Nuclear Physics 48, 113–121 (2002).
- Barger et al. (2007) V. Barger, et al. (2007), 0705.4396.
- Cao (2006) J. Cao, Nucl. Phys. Proc. Suppl. 155, 229–230 (2006), %****␣WW-NuFact09-Proceeding.bbl␣Line␣25␣****hep-ex/0509041.
- Wang (2006) Y.-F. Wang (2006), hep-ex/0610024.
- Guo et al. (2007) X. Guo, et al. (2007), hep-ex/0701029.
- Chu (2008) M. C. Chu (2008), 0810.0807.
- Fogli et al. (2002) G. L. Fogli, et al., Phys. Rev. D66, 053010 (2002), hep-ph/0206162.
- Vogel and Engel (1989) P. Vogel, and J. Engel, Phys. Rev. D39, 3378 (1989).
- Nakajima et al. (2006) K. Nakajima, et al., Nucl. Instrum. Meth. A569, 837 (2006).
- Vogel (2007) P. Vogel, Phys. Rev. C76, 025504 (2007), 0708.0556.
- Djurcic et al. (2009) Z. Djurcic, et al., J. Phys. G: Nucl. Part. Phys. 36, 045002 (2009).
- Kurylov et al. (2003) A. Kurylov, M. J. Ramsey-Musolf, and P. Vogel, Phys. Rev. C67, 035502 (2003), hep-ph/0211306.