75282
M. Centurión
11email: centurion@oats.inaf.it 22institutetext: Ioffe Institute Politekhnicheskaya Str. 26, 194021St. Petersburg, Russia
Calibration issues in estimating variability of the fine structure constant (alpha) with cosmic time
Abstract
Laser Comb Wavelength calibration shows that the ThAr one is locally unreliable with possible deviations of up to 100 within one order range, while delivering an overall 1 accuracy (Wilken et al 2009). Such deviation corresponds to for a Fe ii-Mg ii pair. Comparison of line shifts among the 5 Fe ii lines, with almost identical sensitivity to fine structure constant changes, offers a clean way to directly test the presence of possible local wavelength calibration errors of whatever origin. We analyzed 5 absorption systems, with ranging from 1.15 to 2.19 towards 3 bright QSOs. The results show that while some lines are aligned within 20 , others reveal large deviations reaching 200 or higher and corresponding to a level. The origin of these deviations is not clearly identified but could be related to the adaptation of wavelength calibration to CCD manufacturing irregularities. These results suggest that to draw conclusions from analysis based on one or only few lines must be done with extreme care.
keywords:
Atomic data – line:profiles – methods: data analysis – techniques: spectroscopic – quasars: absorption lines1 Introduction
Investigations into possible systematic effects entering in the measurement of have been discussed among others in Murphy et al (2003), Chand et al (2006), Molaro et al (2008). Here we focus onto the wavelength calibration error.
The wavelength calibration of the QSO CCD images is made by comparison with ThAr lamp taken before and after the QSO frames. The laboratory wavelengths used in the line identification have uncertainties between 10-150 (Palmer & Engleman 1983, Lovis & Pepe 2007 ). Errors in the wavelength calibration could be estimated from the mean wavelength-pixel residuals from the polynomial best solution. Residuals vary from 3-4 mÅ(Chand et al 2006) to 1 mÅ, or even better, (Levshakov et al 2006, Thompson et al 2009). Murphy et al (2003) treating the ThAr as if they were QSO lines obtained that the error in the individual absorption systems is typically few times but there are significant cases up to or higher. When averaged over a large sample of simulated systems they obtained = and concluded that these errors are not expected to drive line shifts in the QSO absorption-line results. A similar conclusion was achieved by Chand et al (2006) where 3 and 2 ThAr lines were taken in proximity of FeII and MgII lines, respectively.
However, the residuals in the wavelength calibration may not reflect the real wavelength error entirely. Recently an experiment conducted at HARPS with the first Laser Comb wavelength calibration in the optical revealed significant deviations of the ThAr wavelength calibration with peak-to-peak deviations of up to 100 within one echelle order. Similarly in HIRES-Keck observations a comparison of the ThAr calibration with a I2 self-calibration spectrum revealed significant and not reproducible deviations (Griest et al 2009)
2 The method and data analysis
The spectroscopic measurability of is based on the fact that the energy of each line transition depends on . The value of follows from the measured relative radial velocity shifts, v, between lines with different sensitivity coefficients.
| (1) |
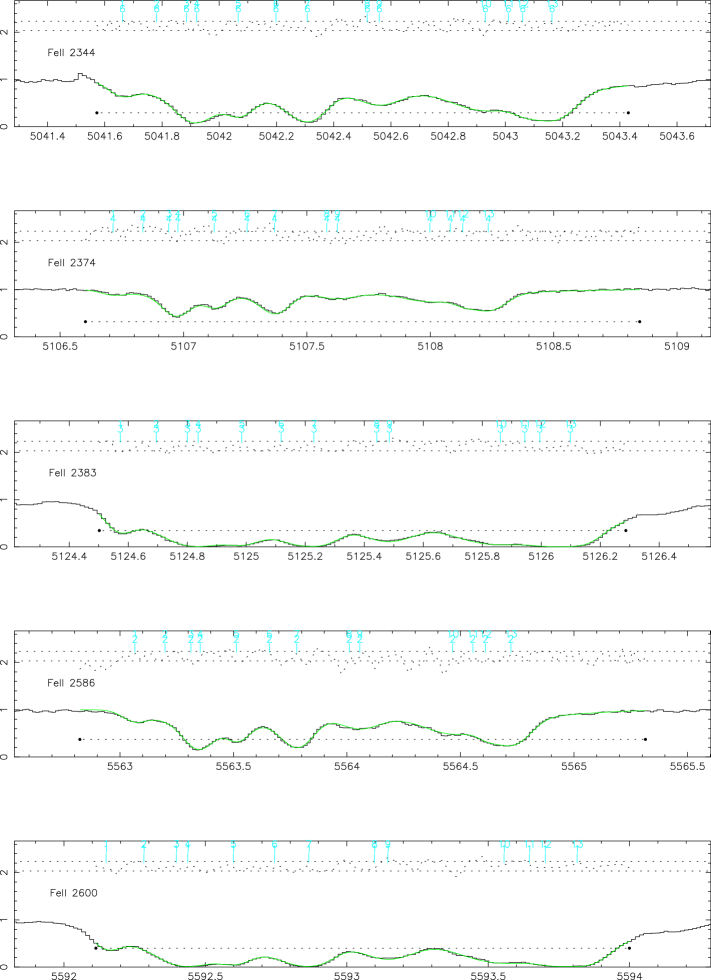
Where Dzuba et al. (2002) and Porsev et al. (2007). The Fe ii 2600.1722, 2586.6494, 2382.7641, 2374. 4601 and 2344.2128 lines have similar sensitivity to , so they should be always found aligned. The measurement of their relative shifts are a clear tool to monitor the quality of the wavelength calibration.
For the present analysis we used 5 systems towards QSOs HE 0515–4414, QSO 1101–264 and HE 0001–2340. The wavelength calibration was done with the most recent recipes except for HE 0001–2340, for which we used the same data of Chand et al (2004) and Murphy et al (2008) to allow a direct comparison.
To measure relative velocity shifts we used VPFIT and assigned to Fe ii 2383 the factor of Mg ii acting as the reference line. The comparison between this line and any of the Fe ii transitions has an effective .
3 Results
3.1 Q 1101-264
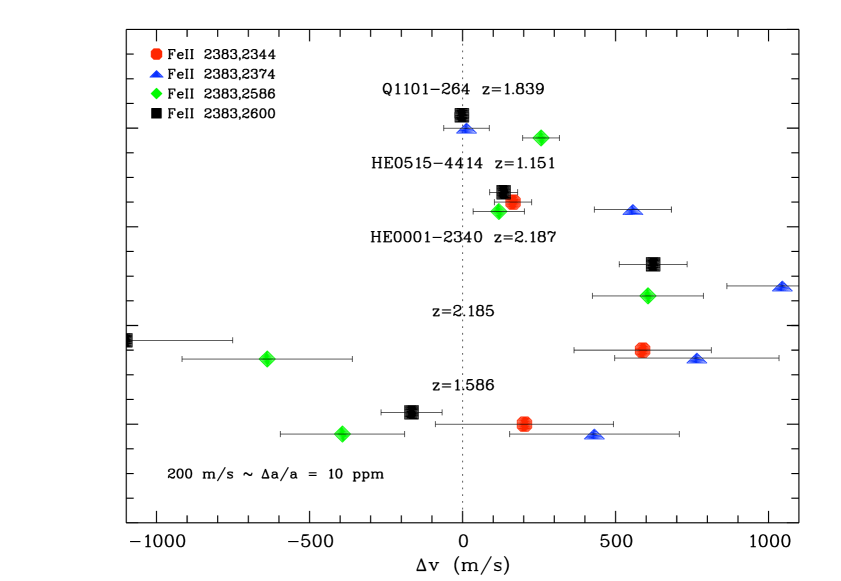
We found that two Fe ii are perfectly aligned to our reference line Fe ii 2383 with velocity shifts of and , respectively. Here the error stems from the photon noise and the uncertainties in modeling the absorption, while values reflect the lack of a real shift between the lines. On the other hand Fe ii 2586 strongly deviates from the other two, , revealing an intrinsic wavelength shift between the lines. Such a deviation cannot be justified on the basis of the wavelength calibration residuals which are 60 . This line falls at the edge of the order and it may be possible that we are witnessing an effect similar to that found by Wilken et al (2009) with HARPS.
3.2 HE 0515-4414
We found 3 lines that deviate by with respect to Fe ii 2383, and the Fe ii 2374 at showing a strong an unjustified deviation from all the others lines. The latter would correspond to a spurious signal of = ppm.
3.3 HE 0001-2340
Towards this QSO we analyzed 3 absorption systems. They all are relatively simple but surprisingly we obtained a poor reduced in the modeling. Correspondingly the error in the line positions are quite large. The system at = 2.187 gives the most precise results showing 3 lines clearly shifted with respect to our reference, and the Fe ii 2374 further shifted away from the reference by ) . It may be possible that a rather old data reduction is also affecting these data.
4 Conclusions
By using line shifts measurements of the five Fe ii lines with identical sensitivity to changes we have studied possible systematics in the wavelength calibration. We found that:
-
•
In most of the systems one or more lines are deviating by several hundreds of . This exceeds the likely errors estimated from the residuals and reveals the presence of hidden systematics in the spectral data.
-
•
These errors could severely affect the measure, in particular in the methods where is derived from few lines or where some lines are crucial for the result. To have a reliable measure it is important to have consistent obtained from several lines for a given absorption system.
-
•
HE 0001-2340, which is one of the QSO used in the present UVES controversy, reveals very poor quality and the whole sample should be reanalyzed ab initio
References
- (1) Chand, H., Srianand, R., Petitjean, P., Aracil, B., Quast, R., Reimers, D. 2006, A&A 451,45
- (2) Dzuba, V. A., Flambaum, V. V.,Ginges, J. S 2008, Phys. Rev. A 66, 022501
- (3) Griest, K., Whitmore, J.B., Wolf, A. M., Prochaska, J. X., Howk, J. et al. 2009, ArXiv: 0904.4725
- (4) Levshakov, S. A., Centurión, M.; Molaro et al. 2006, A&A 449, 879
- (5) Molaro, P., Reimers, D., Agafonova, I. I., Levshakov, S. A. 2008, The European Physical Journal Special Topics, 163, 173
- (6) Murphy, M. T.; Webb, J. K.; Flambaum, V. V. 2003, MNRAS 345,609
- (7) Porsev, S. G., Koshelev, K. V., Typitsyn, I. I., et al 2007, Phys. Rev A76, 2507P
- (8) Wilken, T., Lovis, C., Manescau, A., Steinmetz, T., Holzwarth, R., Paquini, L., Lo Curto, G., Hansch, T.W., Udem, Th. 2009, Submitted