The progenitor mass of the magnetar SGR1900+14
Abstract
Magnetars are young neutron stars with extreme magnetic fields (B1014-1015 G). How these fields relate to the properties of their progenitor stars is not yet clearly established. However, from the few objects associated with young clusters it has been possible to estimate the initial masses of the progenitors, with results indicating that a very massive progenitor star (40⊙) is required to produce a magnetar. Here we present adaptive-optics assisted Keck/NIRC2 imaging and Keck/NIRSPEC spectroscopy of the cluster associated with the magnetar SGR 1900+14, and report that the initial progenitor star mass of the magnetar was a factor of two lower than this limit, =172⊙. Our result presents a strong challenge to the concept that magnetars can only result from very massive progenitors. Instead, we favour a mechanism which is dependent on more than just initial stellar mass for the production of these extreme magnetic fields, such as the “fossil-field” model or a process involving close binary evolution.
Subject headings:
open clusters & associations: individual (Cl 1900+14), stars: evolution, stars: neutron, stars: individual (SGR1900+14)1. Introduction
Magnetars are currently recognized as a distinct group of neutron stars comprising of several classes of object, such as Soft Gamma Repeaters (SGRs), Anomalous X-ray Pulsars (AXPs), and some Compact Central Objects. These objects are characterized by relatively long spin periods and large spin-down torques, which imply magnetic fields on the order of B G, making them the most highly magnetized objects known in the Universe (Duncan & Thompson, 1992; Thompson & Duncan, 1995; Kouveliotou et al., 1998; Mereghetti, 2008). They are also known to enter active periods during which they emit very intense ( erg/s), short (0.1 s) hard X-/gamma ray bursts, as well as extremely energetic Giant Flares of ergs lasting several minutes.
It is still unclear how magnetars are formed. The current theoretical framework for magnetar production requires that the core of a massive star has a very fast rotation speed in the first few seconds after it goes supernova (SN). If the rotation period is shorter than the convective timescale within the neutron star – about 1ms – a highly-efficient dynamo operates which boosts the magnetic field to 1000 times that of a ‘regular’ neutron star, and very rapidly slows the rotation period down to of order 1 second in a matter of years (the so-called ‘dynamo’ mechanism, Duncan & Thompson, 1992; Thompson et al., 2004). However, recent stellar evolution calculations show that the cores of massive stars are substantially spun down as they enter the Red Supergiant (RSG) phase through magnetic braking between the stellar core and convective envelope (Heger et al., 2005). Thus, the problem exists of how the core of a massive star can retain sufficient angular momentum through to the SN stage such that the post-SN core is able to jump-start the dynamo mechanism. It has been suggested that those stars with 40⊙ are able to lose a substantial fraction of their hydrogen-rich envelope while still on the main-sequence, allowing them to skip the RSG phase, and therefore avoid the severe spin-down of the core as the outer envelope expands and becomes convective (Gaensler et al., 2005b).
Where magnetars have been associated with star-clusters it has been possible to estimate the initial mass of the progenitor empirically. Evidence suggests that the magnetar phase is short and that the SN that produced it must have occured recently (yrs ago, Kouveliotou et al., 1994), such that the age of the cluster is much greater than the lifetime the magnetar. Consequently, by measuring the age of the star-cluster we can determine the age of the progenitor star when it went SN. Then, as a star’s lifetime is a strong function of its initial mass, we can estimate the initial mass of the magnetar’s progenitor. In the cases of the magnetars SGR 1806-20 and CXOU J164710.2-455216, associated with the clusters Cl and Westerlund 1 (Wd 1) respectively, it appears that the magnetar progenitors had initial masses 40⊙ (Figer et al., 2005; Bibby et al., 2008; Muno et al., 2006). These results are therefore consistent with the hypothesis that magnetars decend from the most massive stars. Further supporting evidence for this hypothesis comes from a study of the expanding Hi shell around the magnetar 1E 1048.1-5937. When the shell was interpreted as a stellar wind bubble blown by the progenitor, a progenitor mass of 30-40⊙ was inferred (Gaensler et al., 2005a).
There is a fourth magnetar, SGR , which can be used to test this hypothesis. It too is thought to belong to a cluster, which was first recognized for its two bright Red Supergiant (RSG) members (Vrba et al., 1996, 2000). However, up until now this cluster has been poorly studied. The only current distance estimate is a spectrophotometric distance which assumes an intrinsic brightness for the RSGs, and so cannot be used to derive accurate luminosities for the RSGs themselves. Consequently, any estimate for the magnetar’s progenitor mass based on the RSG luminosities is unreliable. The best evidence for the association of the magnetar and star-cluster comes from the detection of an infrared ring around the source, analysis of which placed the magnetar at the same distance from Earth as the cluster’s spectrophotometric distance (Wachter et al., 2008).
In this paper we present a spectroscopic and photometric analysis of the stellar content of the cluster Cl 1900+14. We determine a kinematic distance to the cluster and derive the cluster’s age. Ultimately, we are able to establish an estimate for the initial mass of the progenitor of SGR 1900+14. We begin in Sect. 2 with a description of the observations and data reduction procedure. In Sect. 3 we present the results of our analysis, and in Sect. 4 we discuss the implication for the evolution of massive stars.
2. Observations & data reduction
2.1. Spectroscopy
Spectroscopic observations were made using NIRSPEC, the infra-red spectrograph mounted on Keck-II, during the night of 23 Jun 2008. High-resolution observations were made of the stars A and B (as identified by Vrba et al., 2000) with the spectrograph in cross-dispersed mode, the cross-disperser angle set to 35.53° and the echelle angle to 62.53°. We used the NIRSPEC-7 filter and the 0.576′′24′′ slit, which gave a spectral resolution of R20,000 in select regions of the K-band.
Low-resolution observations were also made of several other stars within the field of the cluster. Here, the echelle was replaced with a mirror, which when combined with the cross-disperser and the 42′′0.57′′ slit gave a spectral resolution of =1000 in the wavelength range 1.9-2.4m.
Repeated observations were made of each target, with the star nodded along the slit by 10′′. In addition to the target stars, we also observed the telluric standard stars HD179282 and HD173003 to characterize the atmospheric absorption features in the -band. Continuum-lamp exposures were made for flat-field purposes, arc lamps were observed for wavelength calibration, while in high-resolution mode we also observed the continuum lamp through the etalon filter to sample the gaps in between the arc lines.
Our data-reduction procedure included the subtraction of nod-pairs to remove diffuse sky emission, and division by a normalized flat-field frame to correct for variations in pixel sensitivity on the detector. Before extraction, the spectral traces were resampled onto a grid linear in both the spatial and dispersion directions using the arc and etalon frames. This rectification process provides absolute wavelength calibration accurate to 4 km s-1 for the high-resolution spectra – a detailed description of this part of the data reduction is given in Figer et al. (2003). Atmospheric absorption features were removed by dividing through by a telluric standard star, which first had its intrinsic spectral features removed using a synthesised spectrum appropriate for its spectral type.
2.2. Imaging
The field centered on the cluster was imaged using the Near Infra-Red Camera 2 (NIRC2) on Keck-II, in combination with Laser Guide Star Adaptive Optics (LGSAO), on 23 Aug 2008. Five overlapping 20 second exposures were taken in the and bands, using the narrow camera, in a X-shaped dither pattern. Raw images were cleaned by subtraction of darks and flat fielding, then median combined.
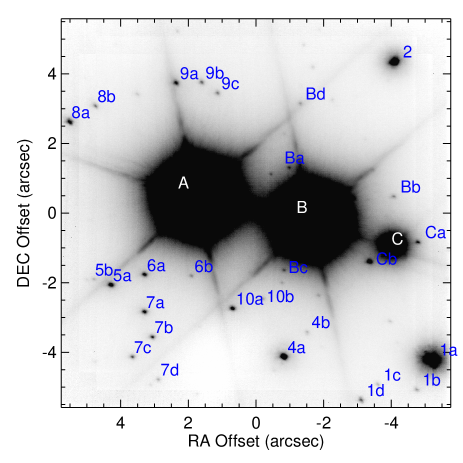
Aperture photometry of point sources was done using IDL scripts, including those in the IDL-adapted version of DAOPHOT. Point-sources which were too close to the two saturated bright stars in the centre were rejected. Magnitudes were calibrated from a control frame taken the same night, and by using 2MASS photometry of bright, isolated, non-saturated stars. For astrometric calibration we used archival HST observations of a field containing the cluster, and used stars 9a, 7a, and 4 (see Fig. 1) to compute the geometric transformation.
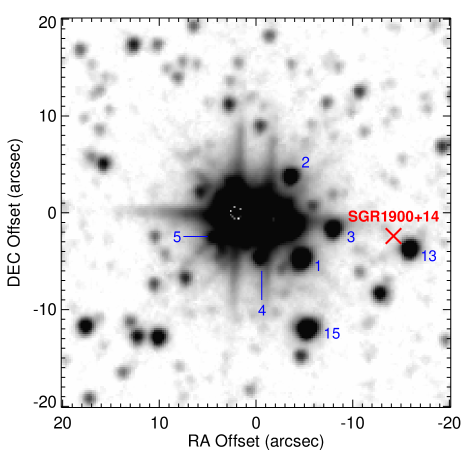
In addition to the Keck/NIRC2 photometry, we also obtained photometry of stars over a wider field from the UKIDSS survey of the Galactic Plane (Lucas et al., 2008; Lawrence et al., 2007; Casali et al., 2007; Hewett et al., 2006; Hambly et al., 2008). In Fig. 2 we show this wide-field image, and indicate the stars for which we obtained spectroscopy.
3. Results & analysis
The high-resolution -band spectra of the two stars and in the region of the CO bandhead are presented in Fig. 3, with both objects displaying the deep absorption signature of luminous late-type stars. The star ‘C’ was shown by V96 to be a foreground object. To derive physical parameters for the two stars, we follow the method of Davies et al. (2007). To determine a spectral type for each star we measured the equivalent width of the CO bandhead and compared to similar measurements of template stars. We found absorption strengths that were in excess of that seen in giant stars, and were more typical of M1-2 supergiants. Below we describe our analysis procedure in more detail, the results of which are presented in Table 1.
3.1. Extinction
We measured line-of-sight extinctions from the and colour-excesses of the two stars, using the photometry of Vrba et al. (1996), intrinsic colours from Levesque et al. (2005) appropriate for the stars’ spectral types, and the extinction law of Rieke & Lebofsky (1985). We found comparable extinctions for both stars from each IR colour. The extinction for the two RSGs, , implies a visual extinction of if we assume (Rieke & Lebofsky, 1985). This is in excellent agreement with the extinction derived by Kaplan et al. (2002), , determined from converting X-ray absorption to an equivalent hydrogen column density. However, it is very different from the extinction derived by Vrba et al. (1996), who found . The reason that such a large extinction was inferred by these authors is not clear (see also Wachter et al., 2008), however it may be that the extinction law they used was optimized for optical wavelengths while they used near-IR colour indices to determine the reddening.

| Star | vLSR | Spec type | log (/⊙) | |||
|---|---|---|---|---|---|---|
| ( km s-1) | (K) | (2 subtypes) | ||||
| A | -144 | 3660130 | M2 | 1.430.06 | -10.64 | 5.05 |
| B | -17 | 3750120 | M1 | 1.450.03 | -10.23 | 4.91 |
3.2. Kinematic distance
We measured radial velocities for the two stars by cross-correlating the spectra with that of Arcturus presented in Wallace & Hinkle (1996), which had been degraded to the same spectral resolution as our observations and shifted to the rest-frame. As with extinction, the line-of-sight velocities we measure for the two RSGs are comparable to within the errors. This is strong evidence that the objects are part of a physical association. The mean velocity we measure111The uncertainty on the velocity is dominated by the absolute precision of our measurements., -15.54 km s-1, indicates a kinematic distance of 12.50.3kpc using the Galactic rotation curve of Brand & Blitz (1993). As we measure a negative velocity, there is no nearside solution to the rotation curve along this line-of-sight. Though random velocities which are peculiar to the Galactic rotation curve by up to 20 km s-1 may not be uncommon, this would require the cluster to be within 1kpc, which given the extinction to the object is highly unlikely. If we take such a random motion as the dominant source of uncertainty in the kinematic distance, we find 12.51.7kpc. This distance is in good agreement with the spectrophotometric estimate by Vrba et al. (1996).
3.3. Cluster age
The distance, average extinction and the bolometric corrections of Levesque et al. (2005) were used to calculate intrinsic luminosities of the RSGs in the cluster. As a cluster ages, the stars currently experiencing the RSG phase will have decended from stars with lower initial masses, and so will have lower luminosities. Therefore, from the luminosity range of the RSGs in a cluster it is possible to estimate the cluster’s age.
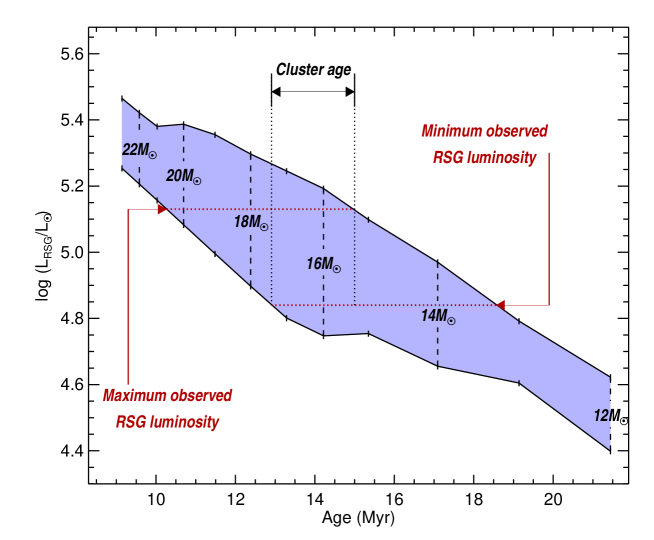
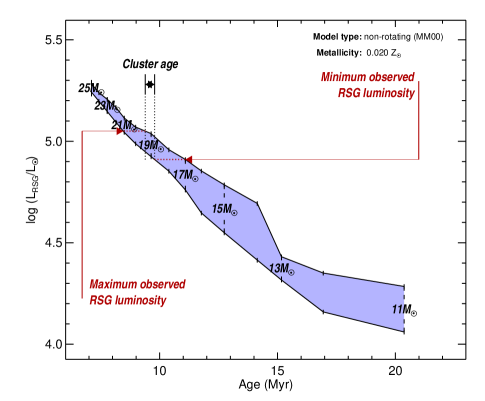
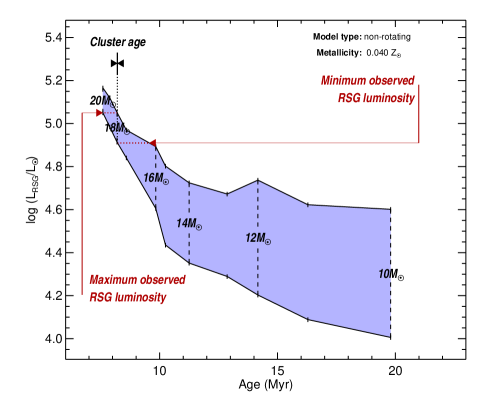
Figure 4 shows the minimum and maximum luminosities of Red Supergiants (RSGs) in a coeval cluster, as a function of cluster age, calculated using the Geneva rotating models at Solar metallicity (Meynet & Maeder, 2000). The initial masses of the stars in the RSG phase are labelled. The red arrows indicate the range of RSG luminosities we observe in Cl 1900+14, . We can say that the cluster cannot be younger than 13Myr, as the least luminous RSG in such a cluster would be brighter than the faintest RSG in Cl 1900+14. Similarly, we can place an upper limit to Cl 1900+14’s age of 15Myr, as the RSGs in a cluster older than this would be fainter than the brightest RSG in Cl 1900+14. Therefore, from the RSG luminosity range we observe in the cluster, we can constrain the age to 141 Myr. If a greater number of RSGs were to be present in this cluster, we would expect them to occupy the luminosity range indicated by the shaded region between 13-15Myr (⊙). The effect of using different evolutionary models is discussed in Sect. 4.
3.4. Cluster coevality
We can assess the coevality of the cluster by studying its stellar population. From our low-resolution spectroscopy of stars in the cluster field, we separate the massive stars belonging to the cluster from foreground objects using the spectral signatures of massive stars. That is, massive stars are hot, their spectra displaying features attributable to transitions of hydrogen and helium; while foreground low-mass stars are cool and have features attributable to molecular CO.
In Table 2 we list the stars in close proximity to the RSGs and that were observed at low spectral resolution. We also tabulate the photometry of these stars – where none was available in the literature or from our NIRC2 data, we obtained photometry from the UKIDSS Galactic Plane Survey Lucas et al. (2008). We assigned coarse spectral types to the objects based on the presence of CO bandhead absorption – those with CO were classified as late-type (K/M); those without as early-type (O/B).
In Fig. 5 we plot the spectra of the ‘early-type’ stars. All stars exhibit clear spectral features of Br-+HeI (2.161,2.164), He i-2.112m and He i-2.058m. There is a suggestion of He ii-2.189m absorption in the spectrum of #13, though the strength of this feature is comparable to the noise. To spectral-type the stars, we compare to the spectral atlases of Hanson et al. (1996) and Hanson et al. (2005). The absence of any strong He ii-2.189m, as well as a lack of C iv and N iii, suggests that the stars cannot be any earlier than O7. Also, the comparable strengths of the Br-+He i(2.161,2.164)m suggests that the stars are no later than B3. At this spectral resolution, it is not possible to distinguish between dwarfs and supergiants using the width of Br- as it blends with the adjacent He i feature.

| Star | J | H | K | Spec type |
|---|---|---|---|---|
| V-C | 12.47 | 11.30 | 10.45 | K/M |
| V-1a | 13.07 | 11.91 | 11.17 | K/M |
| V-2 | 14.22 | 13.02 | 12.26 | K/M |
| V-3 | 14.51 | 12.86 | 12.05 | O/B |
| V-4a | 14.63 | 13.25 | 12.38 | K/M |
| V-5a | – | 15.19 | 14.41 | O/B |
| V-13 | 14.25 | 12.68 | 11.98 | O/B |
| V-15 | 13.67 | 12.12 | 11.36 | O/B |
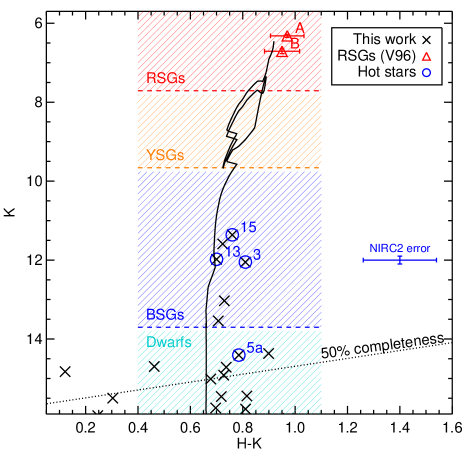
In Fig. 6 we show the colour-magnitude diagram (CMD) for the NIRC2 field. We also show the photometry of the three bright stars from V96. A 15Myr isochrone from the non-rotating Geneva tracks (Schaller et al., 1992)222We use the rotating models of Meynet & Maeder (2000) for most of our analysis, which at the moment are not available with instrumental colours. is overplotted, using the extinction and distance derived in Sect. 3.1.
In the panel we have indicated the apparent K-band magnitude ranges for RSGs, Blue Supergiants (BSGs), Yellow Supergiants (YSGs) and dwarf stars for a cluster with this age, distance and extinction, using the Schaller et al. (1992) models. They are defined as follows:
-
•
RSGs: ⊙
-
•
YSGs: ⊙
-
•
BSGs: ⊙
-
•
Dwarfs333We use as a classification criterion in order to distinguish between main-sequence and post main-sequence objects. : ⊙
The plot shows that, though there are two RSGs in the cluster, there are no stars with brightesses consistent with being YSGs. There are some objects with luminosities one would expect to see of BSGs – however, several of these stars have been spectroscopically identified as cool stars, and are therefore likely foreground objects. Stars which show signatures of early spectral types are indicated in Fig. 6 as circles. Overall we find three stars with -band magnitudes consistent with BSGs and one star consistent with a main-sequence object.
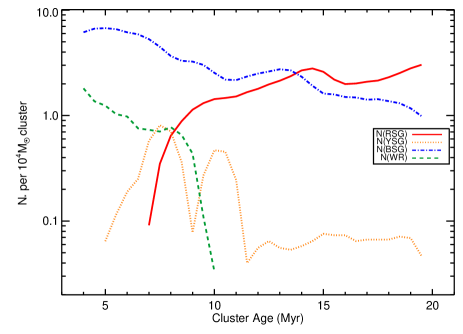
In comparing the relative fractions of the different evolutionary stages with those predicted by the evolutionary track, we find good agreement. Using models with ages 13-17Myr from Schaller et al. (1992) and an Initial Mass Function (IMF) defined by Kroupa (2001), RSGs are predicted to outnumber YSGs by a factor of 10. The ratio of the number of RSGs to BSGs is subject to large variations depending on the age of the cluster, and can be between 0.1–10 in the age range we determine for the cluster. This is also illustrated in Fig. 7, where we use the updated evolutionary models of Meynet & Maeder (2000) which include stellar rotation to determine the relative fractions of evolved massive stars in a coeval cluster as a function of age.
| Object [+ cluster] | /⊙ | Remnant | B (1014G) | Ref. |
|---|---|---|---|---|
| SGR 1806-20 | 48 | Magnetar | 2-8 | 1,2 |
| CXO J164710.2-455216 [Wd 1] | 405 | Magnetar | 1.5 | 3 |
| IGR J18135-1751 [Cl 1813-18] | 20-30 | Pulsar Wind Nebula | 1444This value is highly uncertain due to the lack of a measured period and spin-down rate, and may be an order of magnitude lower. | 4,5,6 |
| AX J1838-0655 [RSGC1] | 182 | Pulsar Wind Nebula | 0.02 | 7,8 |
| SGR 1900+14 | 171 | Magnetar | 2-8 | This work, 9 |
Thus, we can say that we are unlikely to find any YSGs in a cluster that contained only two RSGs, while the number of BSGs should be within an order of magnitude of the number of RSGs. In addition, we find that there should be approximately 10 times as many main-sequence stars brighter than our 50% completeness limit at . While we have only identified one such star here, there are many more B-dwarf candidates in the NIRC2 field-of-view which occupy the relevant region of the CMD and which await spectroscopic classification.
From this analysis, we conclude from the luminosities of the RSGs, the absence of WRs, and the relative numbers of (RSG)/(BSG), that Cl 1900+14 is fully consistent with being a 141 Myr, coeval cluster. By extrapolating over the rest of a Kroupa IMF down to 0.01⊙, we estimate that the total cluster mass of this cluster is ⊙to within an order of magnitude.
4. The initial mass of the magnetar’s progenitor
To summarize the results of the previous section, in terms of the cluster’s age we find that the RSG luminosities are uniquely fit by the rotating stellar evolutionary models at Solar metallicity Meynet & Maeder (2000) for an age of 141Myr. Analysis of the fainter stars indicate that the cluster is consistent with being a coeval starburst to within the errors. No Wolf-Rayet stars are found, which would imply star formation within the last 8Myr, while we find relative numbers of hot/cool stars that are consistent with the model predictions for a coeval 14Myr cluster. As the age of the cluster is much greater than the lifetime of the magnetar (yrs), we can now estimate the mass of the magnetar’s progenitor by determining the mass of the most massive star that could still exist in a cluster of this age. Using the same stellar evolution models as above we find that the initial mass of the magnetar’s progenitor was 1⊙ (see Fig. 4).
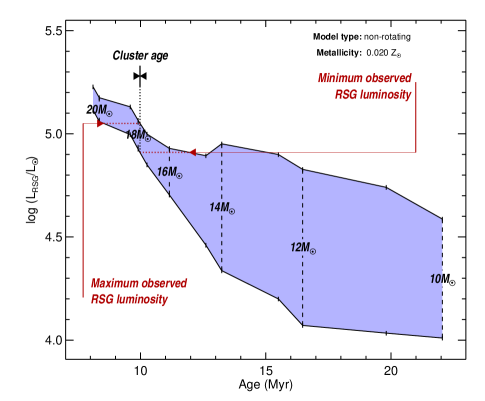
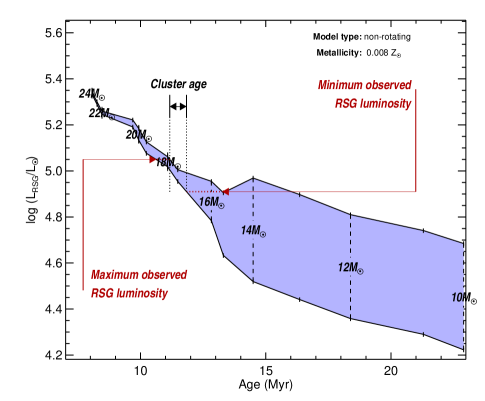
In Fig. 8 we examine the robustness of this result by exploring the effects of using different evolutionary models to determine the cluster age. In the top-left panel of Fig. 8 we show the result of using the updated Geneva models which do not include rotation (Meynet & Maeder, 2000). As discussed by Meynet & Maeder, one effect of including rotation in their evolutionary code is that the post main-sequence massive stars become more luminous. Hence, for a given stellar luminosity, the inferred age from rotating models is larger than for non-rotating models. We see from the top-left panel of Fig. 8 that when the non-rotating models are used the cluster age is reduced to 9-10 Myr. However, the implied initial masses of the RSGs is altered only slightly – 19⊙, as opposed to 16-17⊙ from the rotating models.
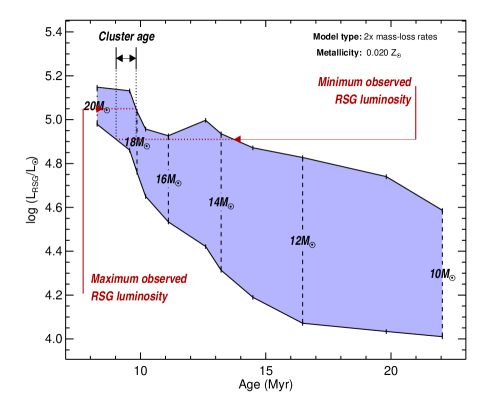
In the remaining panels of Fig. 8 we explore the use of earlier models of the Geneva group, which do not include rotation but which do include convective overshooting. We see that, while inferred cluster ages are systematically lower than those determined using rotating models, the RSG masses are consistently in the region of 17-19⊙. This is the case whether the metallicity is Solar, twice-Solar or Solar/2.5. Similarly, doubling the stellar mass-loss rates has little impact.
From this analysis we conclude that the version of evolutionary model used to calculate the initial mass of the magnetar’s progenitor has very little impact on the value derived. From the contemporary models which include rotation we find ⊙; while from earlier variations of the Geneva evolutionary code we consistently find masses in the range of 17-19⊙. Therefore, we find that any systematic uncertainty in must be small, of order 1-2⊙. To account for systematic uncertainties we adopt an error of 2⊙ on the derived progenitor mass.
4.1. The possible role of binarity
We now consider the role that binarity may play in magnetar production. To recap, one supporting piece of evidence cited by Gaensler et al. (2005a) for high progenitor masses of magnetars was from the numerical simulations of Heger et al. (2005). These authors found that the presence of internal magnetic fields may work to transport angular momentum away from the core, particularly during the transition to core He burning, as the star adjusts to the large differential rotation between the core and the inflated envelope of the RSG phase. A progenitor with initial mass similar to that we derive for SGR 1900+14 would almost certainly pass through the RSG phase as a single star. However, if a star were to evolve in a close binary system, it has been shown that the effects of mass-transfer onto a companion star significantly reduce the RSG lifetime (Eldridge et al., 2008). This enables the core to retain angular momentum through to SN, enough perhaps to greatly amplify the resulting neutron star’s magnetic field through the dynamo mechanism in the first few seconds of its life. In addition, the presence of a secondary star may serve to add angular momentum to the primary. We note however that in this scenario the secondary star would remain after the primary had gone SN. As yet, there is no compelling evidence for an optical/near-IR counterpart to SGR1900+14 (a faint candidate with was suggested by Testa et al., 2008).
4.1.1 Was the progenitor the product of a merger?
If the magnetar’s progenitor star was part of a binary system that merged before the primary went SN, this could explain the lack of any obvious optical/IR counterpart. Indeed, such a process may seem appealing from the point-of-view of magnetar production; it would increase the terminal mass of the star, while it would also likely spin-up the core. If such a merger did occur it must have been at a time shortly before the SN explosion that created the magnetar. Otherwise, the lifetime of the resulting more-massive star would be significantly shortened and would have gone SN many millions of years ago. Hence, the time since SN would be much greater than current estimates of magnetar lifetimes (yrs).
Such an explanation may seem contrived, however a similar scenario has been proposed for the progenitor of SN1987A, where two stars of masses 15⊙ and 5⊙ merged around 20,000yrs prior to SN (see e.g. Podsiadlowski et al., 1992). It is commonly thought that mergers of stars in binary systems are far more likely to occur in systems with large mass ratios. In order to merge, the primary must evolve off the main-sequence such that the secondary is enveloped in the primary’s inflated atmosphere, whereupon the two stars spiral downwards toward the centre of mass. Hence, if a merger did occur in the progenitor of SGR1900+14, it is unlikely that the pre-merger system consisted of two 17⊙ stars and was more likely a 17⊙ primary and a secondary of mass 10⊙.
We cannot discount the possibility that the progenitor of SGR1900+14 experienced a merger, nor can we rule out that such mergers are a necessary ingredient in the magnetar production mechanism. However, the evidence for such a merger is limited at best. While the magnetar is at the centre of a large-scale ring nebula (Wachter et al., 2008), and a similar ring around SN1987A is proposed to be the product of a merger prior to SN (Morris & Podsiadlowski, 2006), mergers are not the only mechanism to produce such rings. This alone is not compelling evidence for a merger event for the progenitor of SGR1900+14.
4.2. Comparison with other neutron stars with known progenitor masses
How does our mass measurement of 17⊙ compare to other post-SN objects with progenitor mass estimates? In Table LABEL:tab:cl we list all known young clusters associated with neutron stars. As well as the three clusters containing magnetars, we also list the two recent discoveries of clusters associated with Pulsar Wind Nebulae (PWNe) – Cl (Helfand et al., 2007; Messineo et al., 2008; Gotthelf & Halpern, 2009), and RSGC1 (Davies et al., 2008; Gotthelf & Halpern, 2008). Prior to our current result, it could be argued from these data that there is a connection between magnetic field strength and progenitor mass. However, the inclusion of SGR 1900+14 – the object with the lowest progenitor mass of the sample, but whose magnetic field is as large as any other on the list – appears to end any notion of a relation between and . As such, our result provides a strong challenge to the hypothesis that magnetars decend from very massive stars – specifically, those stars massive enough to avoid the RSG phase and the associated core spin-down (Heger et al., 2005)555However, see also Ott et al. (2006) for calculations on neutron star birth periods.. From our current understanding of stellar physics, it is not possible for a 17⊙ single star to shed enough of its hydrogen-rich envelope on the main-sequence to avoid the RSG phase (Meynet & Maeder, 2000) (The influence of binarity on the evolution of a star of similar mass was explored in the previous section).
If magnetars can be produced from stars which will inevitably suffer core spin-down during their evolution, then perhaps stellar rotation, and in turn initial stellar mass, are not the primary factors in the production of extreme magnetic fields in neutron stars. An alternative theory to the dynamo mechanism is the ‘fossil-field’ scenario, whereby a seed -field is inherited by a newly-born star from its natal molecular cloud (e.g. Ferrario & Wickramasinghe, 2005). This explanation is preferred from studies of the energetics of SN remnants associated with magnetars, in which no evidence has been found for the extra energy boost provided by the neutron star’s rapid spin-down (such as predicted by the dynamo scenario) (Vink & Kuiper, 2006). However, while a handful of massive stars have recently been observed to have magnetic field strengths of G (Donati et al., 2006; Bouret et al., 2008), it has been noted that flux conservation alone is not sufficient to amplify the B-field to that of magnetar levels (Spruit, 2008), and no current theory exists for how such fields evolve with the star up to the point of supernova.
5. Summary & conclusions
We present an imaging and spectroscopic study of the host cluster of the magnetar SGR1900+14, with the purpose of deriving the initial mass of the magnetar’s progenitor. From analysis of the two bright Red Supergiants in the cluster we determine a kinematic distance of 12.51.7kpc and extinction of , which is in good agreement with that previously derived for the magnetar. From the luminosities of the RSGs we determine an age for the cluster of 141 Myr, and a study of the fainter stellar population of the cluster reveals that it is consistent with being coeval to within the errors. Assuming that the SN that created the magnetar occured very recently in comparison to the age of the cluster, we derive an initial mass of the magnetar’s progenitor of ⊙. We find this estimate is insensitive to parameters such as metallicity and the type of evolutionary models used. This result is significantly lower than for other magnetars with progenitor mass estimates, and challenges the hypothesis that very high initial masses (⊙) are required to produce magnetars. Instead, we suggest that some other initial parameter, such as magnetic field strength at birth or the presence of a close binary companion, may be the dominant factor in producing a super-strong magnetic field.
References
- Bibby et al. (2008) Bibby, J. L., Crowther, P. A., Furness, J. P., & Clark, J. S. 2008, MNRAS, 386, L23
- Bouret et al. (2008) Bouret, J.-C., Donati, J.-F., Martins, F., Escolano, C., Marcolino, W., Lanz, T., & Howarth, I. D. 2008, MNRAS, 389, 75
- Brand & Blitz (1993) Brand, J. & Blitz, L. 1993, A&A, 275, 67
- Casali et al. (2007) Casali, M., Adamson, A., Alves de Oliveira, C., Almaini, O., Burch, K., Chuter, T., Elliot, J., Folger, M., Foucaud, S., Hambly, N., Hastie, M., Henry, D., Hirst, P., Irwin, M., Ives, D., Lawrence, A., Laidlaw, K., Lee, D., Lewis, J., Lunney, D., McLay, S., Montgomery, D., Pickup, A., Read, M., Rees, N., Robson, I., Sekiguchi, K., Vick, A., Warren, S., & Woodward, B. 2007, A&A, 467, 777
- Davies et al. (2007) Davies, B., Figer, D. F., Kudritzki, R.-P., MacKenty, J., Najarro, F., & Herrero, A. 2007, ApJ, 671, 781
- Davies et al. (2008) Davies, B., Figer, D. F., Law, C. J., Kudritzki, R.-P., Najarro, F., Herrero, A., & MacKenty, J. W. 2008, ApJ, 676, 1016
- Donati et al. (2006) Donati, J.-F., Howarth, I. D., Bouret, J.-C., Petit, P., Catala, C., & Landstreet, J. 2006, MNRAS, 365, L6
- Duncan & Thompson (1992) Duncan, R. C. & Thompson, C. 1992, ApJ, 392, L9
- Eldridge et al. (2008) Eldridge, J. J., Izzard, R. G., & Tout, C. A. 2008, MNRAS, 384, 1109
- Ferrario & Wickramasinghe (2005) Ferrario, L. & Wickramasinghe, D. T. 2005, MNRAS, 356, 615
- Figer et al. (2003) Figer, D. F., Gilmore, D., Kim, S. S., Morris, M., Becklin, E. E., McLean, I. S., Gilbert, A. M., Graham, J. R., Larkin, J. E., Levenson, N. A., & Teplitz, H. I. 2003, ApJ, 599, 1139
- Figer et al. (2005) Figer, D. F., Najarro, F., Geballe, T. R., Blum, R. D., & Kudritzki, R. P. 2005, ApJ, 622, L49
- Gaensler et al. (2005a) Gaensler, B. M., Kouveliotou, C., Gelfand, J. D., Taylor, G. B., Eichler, D., Wijers, R. A. M. J., Granot, J., Ramirez-Ruiz, E., Lyubarsky, Y. E., Hunstead, R. W., Campbell-Wilson, D., van der Horst, A. J., McLaughlin, M. A., Fender, R. P., Garrett, M. A., Newton-McGee, K. J., Palmer, D. M., Gehrels, N., & Woods, P. M. 2005a, Nature, 434, 1104
- Gaensler et al. (2005b) Gaensler, B. M., McClure-Griffiths, N. M., Oey, M. S., Haverkorn, M., Dickey, J. M., & Green, A. J. 2005b, ApJ, 620, L95
- Gotthelf & Halpern (2008) Gotthelf, E. V. & Halpern, J. P. 2008, ApJ, 681, 515
- Gotthelf & Halpern (2009) —. 2009, ApJ, 700, L158
- Hambly et al. (2008) Hambly, N. C., Collins, R. S., Cross, N. J. G., Mann, R. G., Read, M. A., Sutorius, E. T. W., Bond, I., Bryant, J., Emerson, J. P., Lawrence, A., Rimoldini, L., Stewart, J. M., Williams, P. M., Adamson, A., Hirst, P., Dye, S., & Warren, S. J. 2008, MNRAS, 384, 637
- Hanson et al. (1996) Hanson, M. M., Conti, P. S., & Rieke, M. J. 1996, ApJS, 107, 281
- Hanson et al. (2005) Hanson, M. M., Kudritzki, R.-P., Kenworthy, M. A., Puls, J., & Tokunaga, A. T. 2005, ApJS, 161, 154
- Heger et al. (2005) Heger, A., Woosley, S. E., & Spruit, H. C. 2005, ApJ, 626, 350
- Helfand et al. (2007) Helfand, D. J., Gotthelf, E. V., Halpern, J. P., Camilo, F., Semler, D. R., Becker, R. H., & White, R. L. 2007, ApJ, 665, 1297
- Hewett et al. (2006) Hewett, P. C., Warren, S. J., Leggett, S. K., & Hodgkin, S. T. 2006, MNRAS, 367, 454
- Kaplan et al. (2002) Kaplan, D. L., Kulkarni, S. R., Frail, D. A., & van Kerkwijk, M. H. 2002, ApJ, 566, 378
- Kouveliotou et al. (1998) Kouveliotou, C., Dieters, S., Strohmayer, T., van Paradijs, J., Fishman, G. J., Meegan, C. A., Hurley, K., Kommers, J., Smith, I., Frail, D., & Murakami, T. 1998, Nature, 393, 235
- Kouveliotou et al. (1994) Kouveliotou, C., Fishman, G. J., Meegan, C. A., Paciesas, W. S., van Paradijs, J., Norris, J. P., Preece, R. D., Briggs, M. S., Horack, J. M., Pendleton, G. H., & Green, D. A. 1994, Nature, 368, 125
- Kouveliotou et al. (1999) Kouveliotou, C., Strohmayer, T., Hurley, K., van Paradijs, J., Finger, M. H., Dieters, S., Woods, P., Thompson, C., & Duncan, R. C. 1999, ApJ, 510, L115
- Kroupa (2001) Kroupa, P. 2001, MNRAS, 322, 231
- Lawrence et al. (2007) Lawrence, A., Warren, S. J., Almaini, O., Edge, A. C., Hambly, N. C., Jameson, R. F., Lucas, P., Casali, M., Adamson, A., Dye, S., Emerson, J. P., Foucaud, S., Hewett, P., Hirst, P., Hodgkin, S. T., Irwin, M. J., Lodieu, N., McMahon, R. G., Simpson, C., Smail, I., Mortlock, D., & Folger, M. 2007, MNRAS, 379, 1599
- Levesque et al. (2005) Levesque, E. M., Massey, P., Olsen, K. A. G., Plez, B., Josselin, E., Maeder, A., & Meynet, G. 2005, ApJ, 628, 973
- Lucas et al. (2008) Lucas, P. W., Hoare, M. G., Longmore, A., Schröder, A. C., Davis, C. J., Adamson, A., Bandyopadhyay, R. M., de Grijs, R., Smith, M., Gosling, A., Mitchison, S., Gáspár, A., Coe, M., Tamura, M., Parker, Q., Irwin, M., Hambly, N., Bryant, J., Collins, R. S., Cross, N., Evans, D. W., Gonzalez-Solares, E., Hodgkin, S., Lewis, J., Read, M., Riello, M., Sutorius, E. T. W., Lawrence, A., Drew, J. E., Dye, S., & Thompson, M. A. 2008, MNRAS, 391, 136
- Mereghetti (2008) Mereghetti, S. 2008, A&A Rev., 15, 225
- Messineo et al. (2008) Messineo, M., Figer, D. F., Davies, B., Rich, R. M., Valenti, E., & Kudritzki, R. P. 2008, ApJ, 683, L155
- Meynet & Maeder (2000) Meynet, G. & Maeder, A. 2000, A&A, 361, 101
- Meynet et al. (1994) Meynet, G., Maeder, A., Schaller, G., Schaerer, D., & Charbonnel, C. 1994, A&AS, 103, 97
- Morris & Podsiadlowski (2006) Morris, T. & Podsiadlowski, P. 2006, MNRAS, 365, 2
- Muno et al. (2006) Muno, M. P., Clark, J. S., Crowther, P. A., Dougherty, S. M., de Grijs, R., Law, C., McMillan, S. L. W., Morris, M. R., Negueruela, I., Pooley, D., Portegies Zwart, S., & Yusef-Zadeh, F. 2006, ApJ, 636, L41
- Ott et al. (2006) Ott, C. D., Burrows, A., Thompson, T. A., Livne, E., & Walder, R. 2006, ApJS, 164, 130
- Podsiadlowski et al. (1992) Podsiadlowski, P., Joss, P. C., & Hsu, J. J. L. 1992, ApJ, 391, 246
- Rieke & Lebofsky (1985) Rieke, G. H. & Lebofsky, M. J. 1985, ApJ, 288, 618
- Schaerer et al. (1993) Schaerer, D., Charbonnel, C., Meynet, G., Maeder, A., & Schaller, G. 1993, A&AS, 102, 339
- Schaller et al. (1992) Schaller, G., Schaerer, D., Meynet, G., & Maeder, A. 1992, A&AS, 96, 269
- Spruit (2008) Spruit, H. C. 2008, in American Institute of Physics Conference Series, Vol. 983, 40 Years of Pulsars: Millisecond Pulsars, Magnetars and More, ed. C. Bassa, Z. Wang, A. Cumming, & V. M. Kaspi, 391–398
- Testa et al. (2008) Testa, V., Rea, N., Mignani, R. P., Israel, G. L., Perna, R., Chaty, S., Stella, L., Covino, S., Turolla, R., Zane, S., Lo Curto, G., Campana, S., Marconi, G., & Mereghetti, S. 2008, A&A, 482, 607
- Thompson & Duncan (1995) Thompson, C. & Duncan, R. C. 1995, MNRAS, 275, 255
- Thompson et al. (2004) Thompson, T. A., Chang, P., & Quataert, E. 2004, ApJ, 611, 380
- Vink & Kuiper (2006) Vink, J. & Kuiper, L. 2006, MNRAS, 370, L14
- Vrba et al. (2000) Vrba, F. J., Henden, A. A., Luginbuhl, C. B., Guetter, H. H., Hartmann, D. H., & Klose, S. 2000, ApJ, 533, L17
- Vrba et al. (1996) Vrba, F. J., Luginbuhl, C. B., Hurley, K. C., Li, P., Kulkarni, S. R., van Kerkwijk, M. H., Hartmann, D. H., Campusano, L. E., Graham, M. J., Clowes, R. G., Kouveliotou, C., Probst, R., Gatley, I., Merrill, M., Joyce, R., Mendez, R., Smith, I., & Schultz, A. 1996, ApJ, 468, 225
- Wachter et al. (2008) Wachter, S., Ramirez-Ruiz, E., Dwarkadas, V. V., Kouveliotou, C., Granot, J., Patel, S. K., & Figer, D. 2008, Nature, 453, 626
- Wallace & Hinkle (1996) Wallace, L. & Hinkle, K. 1996, ApJS, 103, 235