The environmental dependence of the stellar mass-size relation in STAGES galaxies
Abstract
We present the stellar mass-size relations for elliptical, lenticular, and spiral galaxies in the field and cluster environments using HST/ACS imaging and data from the Space Telescope A901/2 Galaxy Evolution Survey (STAGES). We use a large sample of field and cluster galaxies, and a sub-sample of cluster core galaxies, and quantify the significance of any putative environmental dependence on the stellar mass-size relation. For elliptical, lenticular, and high-mass () spiral galaxies we find no evidence to suggest any such environmental dependence, implying that internal drivers are governing their size evolution. For intermediate/low-mass spirals () we find evidence, significant at the level, for a possible environmental dependence on galaxy sizes: the mean effective radius for lower-mass spirals is - per cent larger in the field than in the cluster. This is due to a population of low-mass large- field spirals that are largely absent from the cluster environments. These large- field spirals contain extended stellar discs not present in their cluster counterparts. This suggests the fragile extended stellar discs of these spiral galaxies may not survive the environmental conditions in the cluster. Our results suggest that internal physical processes are the main drivers governing the size evolution of galaxies, with the environment possibly playing a role affecting only the discs of intermediate/low-mass spirals.
keywords:
galaxies: clusters: general — galaxies: elliptical and lenticular, cD — galaxies: evolution — galaxies: fundamental parameters — galaxies: spiral — galaxies: structure1 Introduction
It is now well established that there exist correlations between the properties of galaxies and the environment in which they are found. These correlations suggest that local and large scale environment can affect e.g. morphology, colour, and star formation rate (e.g., Dressler, 1980; Weinmann et al., 2006). Theory attempts to account for these environmental effects by, for example, ram pressure stripping of the interstellar medium, mergers, and harassment (e.g., Gunn & Gott, 1972; Okamoto & Nagashima, 2004; Moore et al., 1996). These processes may cause some galaxies to e.g. lose their extended gas haloes (e.g., Larson et al., 1980), or cause disk truncations (van der Kruit, 1979), and hence affect the physical size of the galaxy.
Recent observations have found that massive galaxies at high redshift () are much more compact than galaxies of the same stellar mass in the local universe (Daddi et al., 2005; Trujillo et al., 2006; Longhetti et al., 2007; Cimatti et al., 2008; van Dokkum et al., 2008). The extreme rarity of these compact high-mass objects in the local universe (Shen et al., 2003; Cimatti et al., 2008; Trujillo et al., 2009) implies a strong size evolution in massive galaxies. Various studies have characterized this strong size evolution for massive galaxies between and (Trujillo et al., 2007; Rettura et al., 2008; van der Wel et al., 2008) and out to higher redshifts (Trujillo et al., 2006; Toft et al., 2007; Zirm et al., 2007; Buitrago et al., 2008; Franx et al., 2008; van Dokkum et al., 2008); the size evolution is especially strong for high-mass galaxies () with low star formation rates (Franx et al., 2008). The strength of size evolution also depends on morphology. Trujillo et al. (2007) find that, for massive galaxies at a given stellar mass, disc-like objects were a factor of 2 smaller at than their counterparts at . The size evolution is even stronger for spheroid-like galaxies which are a factor of 4 smaller at compared to analogous spheroids in the local universe. The observed size evolution is stronger than, but, in qualitative agreement with hierarchical semi-analytical model predictions (e.g., Khochfar & Silk, 2006).
Systematic uncertainties (e.g. errors in photometric redshifts and mass measurements) could potentially have hampered previous studies of size evolution. However, van der Wel et al. (2008) find, using dynamical masses and spectroscopic redshifts, that these systematic effects are too small to account for the observed size evolution.
Several processes have been suggested to account for the observed size evolution of galaxies. One such process is dissipationless or ‘dry’ merging (without star formation; Bell et al., 2005; van Dokkum, 2005). Due to the reduced amounts of available gas, ‘dry’ mergers are efficient in increasing the physical size of the stellar distribution but inefficient at causing new star formation. Another possible process is satellite or smooth envelope accretion (Naab et al., 2007), where accreted stars from minor/major mergers form an envelope around the compact remnant the size of which increases smoothly with decreasing redshift. If this is the case we might expect to find the compact core hidden within early-type galaxies in the local universe. As we expect the merger rate to depend on environment, both these processes are environment dependent and may cause a growth in size over time. However, mergers also cause an increase in the stellar mass and to first order move galaxies roughly parallel to the mass-size relation (van Dokkum et al., 2008). An alternative environmental independent process has been proposed by Fan et al. (2008) who argue that for massive spheroidal galaxies () the observed size evolution is directly related to the rapid mass loss driven by quasar feedback, where the amount of cold gas removed from the central regions of the galaxy can be enough to drive a large increase in the galaxy size by a factor . Lower mass galaxies would also experience a weaker but non-negligible size evolution mainly due to the mass loss powered by stellar winds and supernovae explosions, which is in qualitative agreement with observations (Franx et al., 2008).
Hierarchical models of galaxy evolution predict that early-type galaxies of similar stellar mass in the cluster environment are older than those in the field due to e.g. accelerated galaxy evolution in dense environments (De Lucia et al., 2004). If clusters are regions of accelerated evolution one should expect an earlier growth in size for early-type cluster galaxies and a difference in galaxy sizes between the field and cluster environments. For late-type galaxies we also expect disk truncations (van der Kruit, 1979) which may also depend on environment on top of this accelerated evolution.
Both early- and late-type galaxies follow stellar mass-size relations (Shen et al., 2003; Barden et al., 2005; McIntosh et al., 2005) with the physical size increasing as a function of stellar mass. Presently, the little work that has been done on the environmental dependence of the stellar mass-size relation has been largely limited to small samples of massive (), early-type galaxies (Cimatti et al., 2008; Rettura et al., 2008). Recently, Cimatti et al. (2008) found a possible trend using a small sample of field and cluster, massive early-type galaxies from the RDCS1252.9-2927 cluster and the Great Observatories Origins Deep Survey (GOODS; Giavalisco et al., 2004) South Field. They find a hint that for a fixed redshift massive cluster early-type galaxies are more preferentially located within the mass-size relation than their counterparts in lower density environments. However, Rettura et al. (2008) come to a different conclusion and find no environmental dependence of the stellar mass-size relation using a small sample of field and cluster, massive early-type galaxies drawn from the same fields and redshift range as Cimatti et al. (2008); they conclude that early-type galaxies must undergo a similar size evolution in both environments in order to account for the typical sizes of early-type galaxies at lower redshifts.
For late-type galaxies, recent work (Guo et al., 2009; Weinmann et al., 2009) has compared the sizes of satellite and central, early- and late-type group galaxies from the Sloan Digital Sky Survey (SDSS; York et al., 2000). At fixed stellar mass, satellite galaxies lie in larger groups/clusters (i.e. denser environments) than central galaxies of similar stellar mass. Both Guo et al. (2009) and Weinmann et al. (2009) find no difference between the radii of satellite and central early-type galaxies, however, at low-masses () , late-type satelites have moderately smaller radii than similar mass late-type central galaxies. Similar results have also been reported by Kauffmann et al. (2004) and van den Bosch et al. (2008).
The aim of this paper is to investigate whether the stellar mass-size relation for different Hubble type morphologies is affected by the galaxy environment using larger, more statistically viable field and cluster samples. We construct stellar mass-size relations for elliptical, lenticular, and spiral galaxies in the environments of the field, cluster, and cluster core.
The structure of this paper is as follows: in §2 we give a brief description of the STAGES dataset relevant to this work. We describe the determination of the stellar masses in §2.1, detail the method used for the estimation of galaxy size in §2.2, and outline our sample selection in §2.3. In §3 we present our observed stellar mass-size relations for elliptical, lenticular, and spiral galaxies in the field, cluster, and cluster core environments. We provide a discussion of our results in §4 and finally, draw our conclusions in §5. Throughout this paper, we adopt a cosmology of , , and , and use total Vega magnitudes.
2 Description of the data
This work is entirely based on the STAGES data published by Gray et al. (2009). STAGES (Space Telescope A901/2 Galaxy Evolution Survey) is a multi-wavelength survey that covers a wide range of galaxy environments. A complex multi-cluster system at has been the subject of -band (F606W) HST/ACS imaging covering the full () span of the multi-cluster system. The ACS imaging is complemented by photometric redshifts and observed-/rest-frame SEDs from the 17-band COMBO-17 photometric redshift survey (Wolf et al., 2003). Extensive multi-wavelength observations using Spitzer, GALEX, 2dF, XMM-Newton, and GMRT have also been carried out. Gray et al. (2009) have performed Sérsic profile fitting on all HST/ACS images and conducted simulations to quantify the completeness of the survey, all of which are publicly available111http://www.nottingham.ac.uk/astronomy/stages.
The COMBO-17 observations used in the STAGES master catalogue were obtained with the Wide Field Imager (WFI) at the MPG/ESO 2.2-m-telescope on La Silla, Chile (see Wolf et al. 2003 for further details). COMBO-17 used five broad-band filters UBVRI and 12 medium-band filters covering wavelengths from – to define detailed optical SEDs for objects with , with being the total -band magnitude. Generally, photometric redshifts from COMBO-17 are accurate to per cent in at which has been spectroscopically confirmed. Photo- quality degrades for progressively fainter galaxies reaching accuracies of per cent for galaxies with and per cent for galaxies with (Wolf et al., 2004, 2008). The galaxy evolution studies to date on the COMBO-17 data that use photo- defined galaxy samples all restrict themselves to galaxies that are brighter than to ensure only reliable redshifts are used.
The STAGES morphological catalogue (Gray et al. in prep.) contains 5090 galaxies in STAGES with reliable Hubble type morphologies. All galaxies with and were visually classified by seven members of the STAGES team into the Hubble types (E, S0, Sa, Sb, Sc, Sd, Irr) and their intermediate classes. S0s were defined to be disc galaxies with a visible bulge but no spiral arms. Weighted average estimates of the Hubble types, ignoring bars and degrees of asymmetry were generated. In this paper, we only consider the elliptical, lenticular, and spiral classes. The spiral subclasses are merged and we only consider the spiral class as a whole.
2.1 Determination of Stellar Masses
The stellar masses listed in the STAGES catalogue and used in this work were originally estimated by Borch et al. (2006) for galaxies in COMBO-17. These estimates were derived from SED-fitting of the 17-band photometry using a template library derived from PEGASE (Fioc & Rocca-Volmerange, 1997) population synthesis models and a Kroupa et al. (1993) stellar IMF. Random errors in stellar mass are estimated to be dex on a galaxy-galaxy basis in the majority of cases. Systematic errors in stellar mass (for the given population synthesis model and IMF) were argued to be at the dex level for galaxies without ongoing or recent major starbursts, however, for galaxies with strong starbursts the stellar mass could be overestimated by up to dex, see Borch et al. (2006) for further details.
The masses of spiral galaxies are reliable for and the masses of E/S0 galaxies are reliable at all masses. However, due to aperture effects on the SEDs, the stellar masses of spiral galaxies are unreliable at , see Wolf et al. (2009) for further details. For this reason we limit ourselves to the mass range for spiral galaxies.
2.2 Galaxy Size Determination
The galaxy sizes used in this paper are the effective radius along the semi-major axis of the 2D surface brightness distribution. Historically, work in this field has used the circularized effective radius , where is the axis ratio of the galaxy (ratio of semi-minor over semi-major effective radius), as the estimate of galaxy size. However, the use of circularized quantities has no effect on the significance of the results of this work or our overall conclusions. Therefore, we choose to use the more physically meaningful as our measurement of galaxy size.
Gray et al. (2009) use the data pipeline GALAPAGOS (Galaxy Analysis over Large Areas: Parameter Assessment by GALFITting Objects from SExtractor; Barden et al., in prep) to perform the extraction and Sérsic model fitting of source galaxies from the HST/ACS -band imaging. This data pipeline uses the GALFIT code (Peng et al., 2002) to fit Sérsic (1968) radial surface brightness models to each ACS image.
GALFIT is a two-dimensional fitting algorithm that determines a best-fit model for the observed galaxy surface brightness distribution. Two-dimensional Sérsic (1968) models are convolved with the PSF of the original ACS (F606W) images and compared to the original surface brightness distribution. The best-fit model is obtained by minimising the of the fit using a Levenberg-Marquardt algorithm. GALFIT determines several structural parameters for the galaxy including the effective radius along the semi-major axis (in image pixels), axis ratio , and Sérsic index . The Sérsic index measures the concentration of the surface brightness profile and is used to eliminate GALFIT model fits with potentially unreliable structural parameters (i.e. those with Sérsic indices and ).
We use simulations of the STAGES dataset in order to determine the reliability of the GALFIT structural parameters. Gray et al. (2009) simulated over 10 million galaxy images with a range of properties analogous to the real STAGES data and subjected the dataset to the same data pipeline. Using a similar approach to that described by (Häussler et al., 2007), we determine the error in our GALFIT structural parameters by comparing the input and output structural parameters for a simulated sample selected by output magnitude and Sérsic index to match that of our galaxy samples. In this work, we use galaxy samples of different morphologies, environments and stellar mass ranges. For each sample we obtain the -magnitude range and use it to select an analogous sample from the simulations. The mean error in the GALFIT semi-major axis effective radius as determined from simulations () was found to increase slightly with decreasing stellar mass and be per cent in all cases, see Table 1.
| Elliptical Galaxies (E) | ||||||
|---|---|---|---|---|---|---|
| range | Field | Cluster | ||||
| SizeGALFIT | Distance | Total Size | SizeGALFIT:Total Size | |||
| range | error | error | error | range | error | |
| [9, 9.5] | ||||||
| [9.5, 10] | ||||||
| [10, 11.5] | ||||||
| Lenticular Galaxies (S0) | ||||||
| range | Field | Cluster | ||||
| SizeGALFIT | Distance | Total Size | SizeGALFIT:Total Size | |||
| range | error | error | error | range | error | |
| [9, 9.5] | ||||||
| [9.5, 10] | ||||||
| [10, 11] | ||||||
| Spiral Galaxies (Sp) | ||||||
| range | Field | Cluster | ||||
| SizeGALFIT | Distance | Total Size | SizeGALFIT:Total Size | |||
| range | error | error | error | range | error | |
| [9, 9.5] | ||||||
| [9.5, 10] | ||||||
| [10, 11] | ||||||
The semi-major axis effective radii were transformed into intrinsic linear scales using a cosmology of , , and . We use the fixed cluster redshift () to determine the sizes of our cluster galaxies and the original COMBO-17 redshift estimate for our field galaxies. Therefore, the photo- errors only propagate into the physical sizes of our field galaxies and not our cluster galaxies. The STAGES multi-cluster system is at a distance of and has a maximum depth of along the line-of-sight. Consequently, the of cluster galaxies are the same () regardless of whether the COMBO-17 redshift is used or the redshift is fixed at . Therefore, fixing the redshift of the cluster sample has no effect on the distribution of the cluster galaxies but eliminates the main source of uncertainty (photo- errors). The mean error in associated with the photo- error (i.e. error in distance to galaxy) for our field galaxies was calculated for each morphology and stellar mass range. The distance error is larger for lower stellar masses, see Table 1, and is per cent in all cases. We return to the effect of this error in §4.1.
The total mean error in our galaxy sizes is per cent for our field sample and per cent for our cluster sample for all stellar mass ranges used in this work.
2.3 Sample Selection
Gray et al. (2009) suggest a cluster sample for STAGES defined solely from photometric redshifts. The photo- distribution of cluster galaxies was assumed to follow a Gaussian, while the field distribution was assumed to be consistent with the average galaxy counts outside the cluster and to vary smoothly with redshift and magnitude. The cluster sample is defined by a redshift interval , where the half-width was allowed to vary with -magnitude. A narrow redshift range is adopted for bright -magnitudes due to the high precision of COMBO-17 photometric redshifts, but the interval increases in width towards fainter -magnitudes to accommodate for the increase in photo- error. The completeness and contamination of the cluster sample at all magnitude points was calculated using the counts of the smooth models (see Fig. 14 from Gray et al., 2009) and the photo- half-width compromised so the completeness was per cent at any magnitude. Contamination is defined to be the fraction of field galaxies in the cluster sample at a given magnitude (not below). The half-width as a function of magnitude is
| (1) |
This equation defines a photo- half-width that is limited to 0.015 at bright -magnitudes but increases as a constant multiple of the estimated photo- error at the faint end. The completeness of this selection converges to nearly per cent for bright galaxies; see Gray et al. (2009) for further details. The catalogue published by Gray et al. (2009) contains a number of flags (combo_flag, phot_flag, stages_flag) that allows the selection of various galaxy samples.
For our cluster sample we use the above cluster definition (combo_flag ), we also only use galaxies with reliable photometry (i.e. those with phot_flag ), and those defined as extended HST sources in STAGES (stages_flag ). We also limit our sample by stellar mass, cutting at . This cluster sample contains 893 galaxies which reach to and has a photo- range at the low-mass end of , see Fig. 1.
For our field sample we use COMBO-17 defined galaxies (combo_flag ) and apply a redshift selection that avoids the cluster. We include a lower redshift interval at and an upper redshift interval at , based on a similar sample selection used by Wolf et al. (2009). We also only use galaxies with reliable photometry (i.e. those with phot_flag ), and those defined as extended HST sources in STAGES (stages_flag ). We also limit our sample by stellar mass, cutting at . This field sample contains 656 galaxies which reach to , see Fig. 1.
The catalogue published by Gray et al. (2009) contains two sets of derived values for properties such as magnitude and stellar mass, one based on the photo- estimate and another assuming the galaxy is fixed at the cluster redshift of . This prevents the propagation of photo- errors into physical values. Here we use the fixed redshift set of values for the cluster sample, but the original estimates for our field comparison sample.
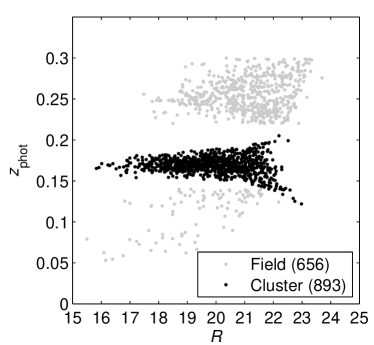
Fig. 1 shows the redshift-magnitude diagram for our field and cluster samples and shows that there is no overlap between the field and cluster samples near as might be inferred from their photo- ranges in the above discussion, see Wolf et al. (2009) for an explanation. The upper redshift interval for the field contains much more volume and hence more galaxies than the lower redshift interval.
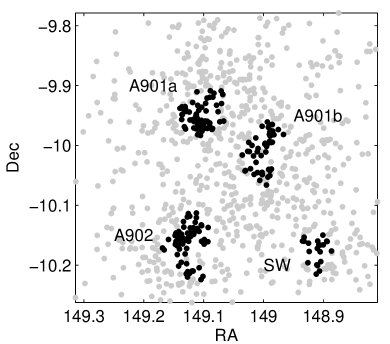
In this paper, we also consider a comparison of the stellar mass-size relation between the extreme environments of the field and cluster core. Any environmental effects on galaxy size will be more apparent in this comparison. Wolf et al. (2009) create a sample of cluster core galaxies in STAGES using the stellar mass surface density of cluster member galaxies. A cluster sample with was used to measure the stellar mass surface density inside a fixed aperture with radius at the redshift of the multi-cluster system (). The aperture stellar mass density in units of was then used to define a cluster core sample. Galaxies where were designated to lie within the cluster cores of the STAGES multi-cluster system. We apply the same selection as Wolf et al. (2009) to our cluster sample and obtain a cluster sub-sample of 203 cluster core galaxies. Fig. 2 shows the location of our cluster and cluster core sample galaxies in the STAGES region and illustrates the extraction of cluster core galaxies from the cluster sample.
2.3.1 Sample Completeness and Morphologies
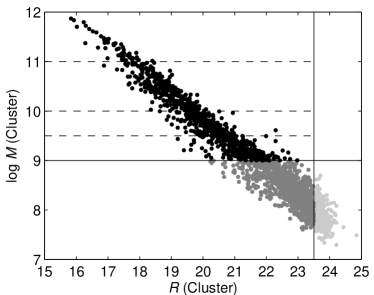
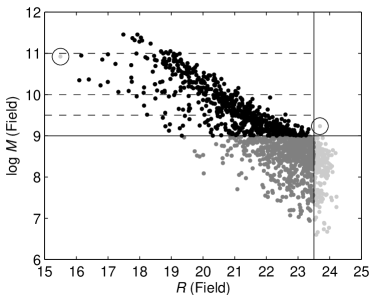
We require visual morphologies for our field and cluster samples from the STAGES morphological catalogue. All galaxies with (as is the case in this work) and have been visually classified into Hubble type morphologies (Gray et al., in prep). In order to assess any selection effect or incompleteness introduced by only using galaxies with visual morphologies, we plot the mass-magnitude relation for our field and cluster samples without the stellar mass cut, see Fig. 3. All galaxies in our mass-selected cluster sample () have and have visual morphologies in the STAGES morphological catalogue. Therefore, we introduce no further incompleteness to our cluster sample by selecting only galaxies that have visual morphologies.
For our field sample, apart from two exceptions all galaxies with () have and have visual morphologies in the STAGES morphological catalogue. Therefore, essentially no further incompleteness is introduced to our field sample by selecting only galaxies that have visual morphologies. One bright high-mass galaxy, (object 35364) in our mass-selected sample was not contained in the original morphological catalogue due to anomalous photometric flags, but upon subsequent visual inspection this galaxy was classified as a spiral. For completeness this spiral was retained in our field sample. A faint () galaxy (object 5622) in our mass-selected sample is unclassified due to the galaxy being too faint for classification.
STAGES is per cent complete for (Gray et al., 2009) as is the case for all galaxies with visual morphologies in the morphological catalogue. However, Wolf et al. (2009) estimate that at masses below , the field sample could have an addiational per cent incompleteness based on previous COMBO-17 experience. Therefore, our field sample (all with ) is essentially per cent complete for and per cent complete for .
In the analysis of this work we consider mass-selected sub-samples of the field and cluster samples, and cluster core sub-sample with in the ranges , and or . We expect the completeness of the cluster samples to be per cent and the contamination of the cluster samples by the field to be per cent in all cases, based on the -magnitude the respective sub-sample reaches down to (Gray et al., 2009), see Fig. 3. Table 2 has detailed numbers per mass bin.
| range | [9, 9.5] | [9,5, 10] | [10, 11] | [11, 12] |
|---|---|---|---|---|
| completeness | ||||
| contamination | ||||
| mean | 21.22 | 20.11 | 18.83 | 17.21 |
| 0.122 | 0.151 | 0.154 | 0.154 | |
| 0.205 | 0.190 | 0.187 | 0.181 | |
| 299 | 236 | 302 | 56 | |
| (Field) | 308 | 163 | 172 | 11 |
We separate the field and cluster samples, and the cluster core sub-sample into Hubble type morphologies using the STAGES morphological catalogue (Gray et al., in prep.) and obtain a sample of elliptical, lenticular (S0), and spiral galaxies in each environment. We obtain 477 field galaxies (100 E, 60 S0, 317 Sp) and 791 cluster galaxies (192 E, 216 S0, 383 Sp), 190 of which are cluster core galaxies (64 E, 67 S0, 59 Sp). Irregular galaxies and other objects are not considered in this paper.
2.3.2 Reliability of Structural Parameters
We remove all high-mass () spirals from our samples (14 cluster and 1 field) due to their unreliable stellar masses (Wolf et al., 2009), see section 2.1. We also remove poor GALFIT (Peng et al., 2002) model fits (i.e. those with Sérsic indices and ) due to the potential unreliable nature of their structural parameters (see section 2.2). This removes 22 galaxies ( per cent) from the field sample (11 E, 1 S0 and 10 Sp) and 43 galaxies ( per cent) from the cluster sample (20 E, 13 S0 and 10 Sp), 8 galaxies of which are from the cluster core sub-sample (6 E, 1 S0 and 1 Sp), and removes outliers (galaxies with incorrect ) from our stellar mass-size relations. Some authors consider high sersic indices intrinsic for galaxies (e.g. Graham et al., 1996), however, this Sérsic cut only affects the significance of our results for high-mass ellipticals where it removes some of the Brightest Cluster Galaxies (BCGs). Otherwise, this Sérsic cut has no effect on the overall significance of the results of this work or our conclusions. The BCGs of the STAGES multi-cluster system are poorly fitted by GALFIT due to large amounts of inter-cluster light. However, 2 are removed by the Sérsic data-cut and the remainder (3 BCGs) are all high-mass () ellipticals which are not considered in the comparisons of our mass-size relations (see section 3). This leaves a final sample of 455 field galaxies (89 E, 59 S0, 307 Sp) and 734 cluster galaxies (172 E, 203 S0, 359 Sp), 177 of which are cluster core galaxies (58 E, 66 S0, 53 Sp).
3 The Observed Stellar Mass-Size Relations
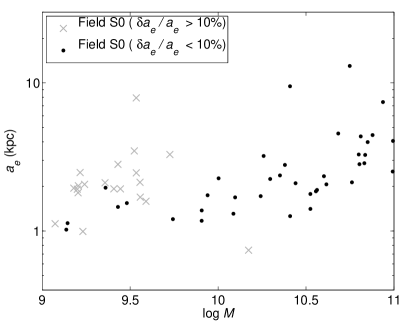
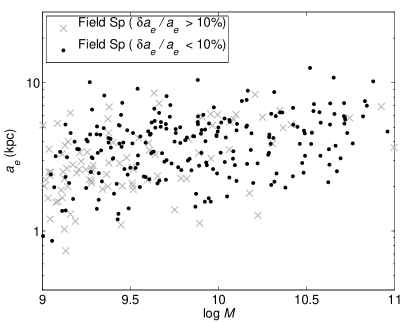
In this section, we discuss the stellar mass-size relations for our sample of field and cluster galaxies, and our cluster sub-sample of cluster core galaxies. For each Hubble type we compare the stellar mass-size relations between the field and cluster, and the field and cluster core. These comparisons are presented in Fig. 4 for elliptical, lenticular, and spiral galaxies.

For each Hubble type, the field and cluster samples, and cluster core sub-sample are split into three stellar mass () bins. The two low-mass bins, and , are the same for all Hubble types but the high-mass bin varies. We use a high-mass bin of for spiral and lenticular galaxies but extended it to for elliptical galaxies. For spiral galaxies, we do not consider due to unreliable stellar masses (Wolf et al., 2009), see section 2.1. For lenticular galaxies, we do not consider due to there being no field lenticulars with to compare to cluster lenticulars. We remove 10 cluster S0s, 5 of which are from the cluster core, with from our stellar mass-size relations. For elliptical galaxies, we do not consider due to there being no field ellipticals with to compare to cluster ellipticals. We remove 5 cluster ellipticals (including 3 BCGs), all from the cluster core, with from our stellar mass-size relations.
For each Hubble type and environment, we calculate the mean semi-major axis effective radius with associated uncertainty in the mean for each stellar mass bin, see Table 3. The values of with errorbars are overplotted on our stellar mass-size relations, see Fig. 4. For elliptical and lenticular galaxies we find no significant difference between the values of for the field and cluster/core samples in all mass bins. For high-mass () spiral galaxies, we find no significant difference between the value of for the field and cluster samples, however, we find core spirals have slightly larger than the field spirals. For lower stellar masses () we find that the cluster spirals have values of significantly smaller than the for field spirals of the same mass. We also find that low-mass spirals () in the core have significantly smaller than similar galaxies in the field, see Table 3. Using the median- instead of the mean- only removes the difference in average size between the low-mass () spirals of the cluster and the field. Otherwise, these results are robust to the use of median-.
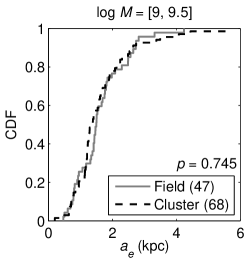
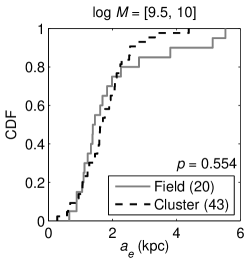
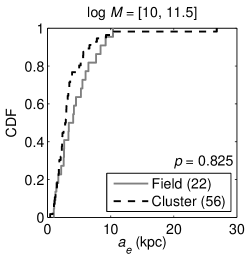
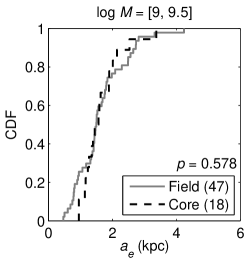
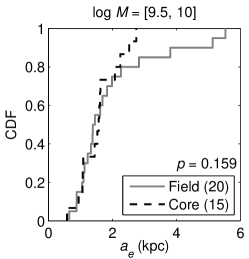
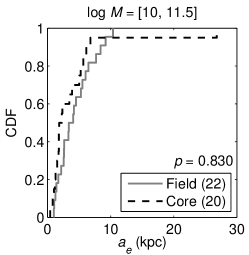
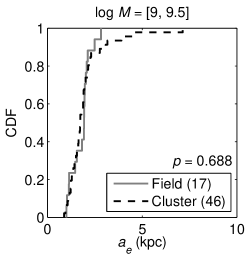
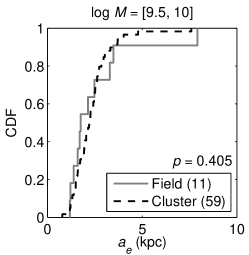
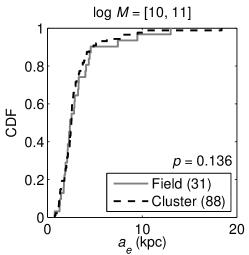
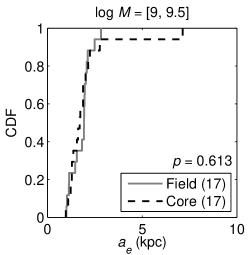
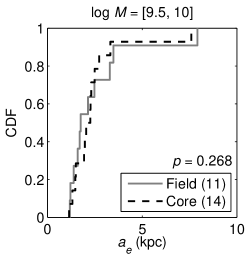
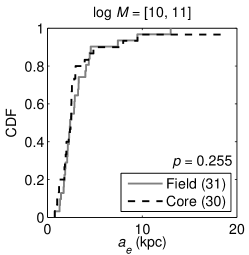
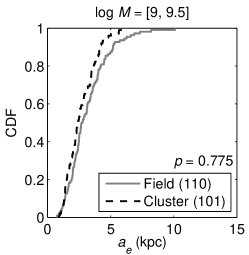
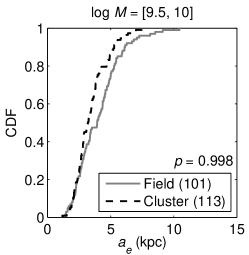
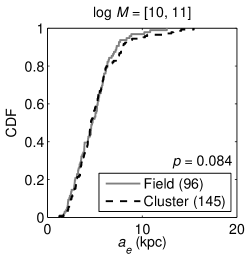
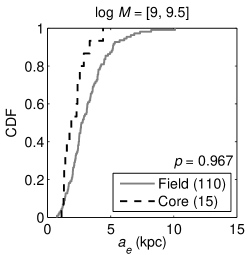
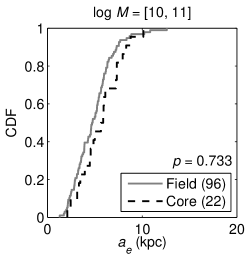
To test the significance of these results, for each Hubble type and environment we construct cumulative distribution functions (CDFs), see Figs. 5–7, and perform Kolmogorov–Smirnov (K–S) tests between corresponding mass-selected sub-samples from the field and the cluster in order to obtain the probability that the these samples are drawn from different continuous distributions. We apply the same K–S tests in a comparison of corresponding mass-selected sub-samples from the field and cluster core. The results per mass bin for each Hubble type are shown in Table 3.

| Elliptical Galaxies (E) | |||||
|---|---|---|---|---|---|
| range | (Field) | (Cluster) | (Core) | ||
| [9, 9.5] | 1.62 (0.11) | 1.63 (0.11) | 1.64 (0.14) | 0.745 | 0.578 |
| [9.5, 10] | 1.96 (0.31) | 1.75 (0.12) | 1.58 (0.16) | 0.554 | 0.159 |
| [10, 11.5] | 4.29 (0.59) | 3.62 (0.51) | 4.03 (1.28) | 0.825 | 0.830 |
| Lenticular Galaxies (S0) | |||||
| range | (Field) | (Cluster) | (Core) | ||
| [9, 9.5] | 1.78 (0.12) | 1.94 (0.16) | 1.99 (0.34) | 0.688 | 0.613 |
| [9.5, 10] | 2.55 (0.59) | 2.33 (0.14) | 2.45 (0.43) | 0.405 | 0.268 |
| [10, 11] | 3.27 (0.46) | 3.01 (0.25) | 3.25 (0.63) | 0.136 | 0.255 |
| Spiral Galaxies (Sp) | |||||
| range | (Field) | (Cluster) | (Core) | ||
| [9, 9.5] | 3.14 (0.16) | 2.63 (0.12) | 2.11 (0.24) | 0.775 | 0.967 |
| [9.5, 10] | 4.00 (0.18) | 3.42 (0.12) | 3.52 (0.39) | 0.998 | 0.566 |
| [10, 11] | 4.85 (0.21) | 5.10 (0.21) | 5.61 (0.46) | 0.084 | 0.733 |
In this work, we only consider an environmental effect on the stellar mass-size relation to be significant if K–S tests yield a level probability for the field and cluster/core samples being drawn from different continuous distributions.
For elliptical and lenticular galaxies, the probability that the field and cluster , and the field and cluster core samples are drawn from different continuous distributions is below the level in all mass bins. Therefore, we find no evidence to suggest an environmental dependence on the stellar mass-size relation for these galaxies. This result is in qualitative agreement with the work of Rettura et al. (2008) who came to the same conclusion at higher redshift () using a much smaller sample of 45 cluster and field early-type galaxies.
For high-mass spiral galaxies (), both the probabilities and are below the level. Therefore, we find no evidence to suggest an environmental dependence on the stellar mass-size relation for high-mass spirals. However, for intermediate and low-mass spirals we find evidence for a potential environmental dependence on the stellar mass-size relation. For intermediate-mass spirals (), the probability is below the level, however, we find a significant probability (at the level) for . This is in agreement with the difference seen between for intermediate-mass spirals in the field and cluster environments, see Fig. 4, where we find a larger for field spirals. For low-mass spirals (), the probability is below the level, however, is at the level. Again this is in agreement with the difference seen between for low-mass spirals in the field and core environments, see Fig. 4, where we find a larger for field spirals. Therefore, there appears to be a population of large-, intermediate/low-mass spirals in the field that is largely absent from the cluster and cluster core environments.
4 Discussion
The main result of this work is the lack of any environmental dependence for the majority of the galaxy types studied. The significance observed for intermediate/low-mass spirals is inconclusive and requires further verification by similar studies in other fields. In this section we discuss some of the considerations for the reliability of our results and for establishing the stellar mass-size relation at low stellar masses.
The majority of our field galaxies have redshift while the cluster galaxies have . Using the fits of Buitrago et al. (2008), we evaluated the expected size evolution between the mean redshifts of our field and cluster samples to be per cent ( per cent for discs and per cent for spheroids). Presently, size evolution has only been characterised for the most massive galaxies (; Trujillo et al., 2007; Buitrago et al., 2008). Consequently, these fits do not hold for our galaxy samples (mostly with ) but we use them to give an idea of the degree of expected evolution. Therefore, neglecting any environmental effects, on average our field galaxies are expected to be per cent smaller than the cluster galaxies. However, we observe the opposite trend for our spiral galaxies at intermediate/low stellar masses.
The evidence we find for an environmental dependence on the stellar mass-size relation for intermediate/low-mass spirals does not however appear in a consistent way. The significance of is at the level for intermediate masses (), but only just above the level for low masses (). Either the significance at intermediate masses is not robust and there is no environmental dependence or the significance at low masses is being masked by some effects (e.g. photometric redshift errors and contaminations). We explore these effects in the following sections.
4.1 The Effect of Photometric Redshift Errors
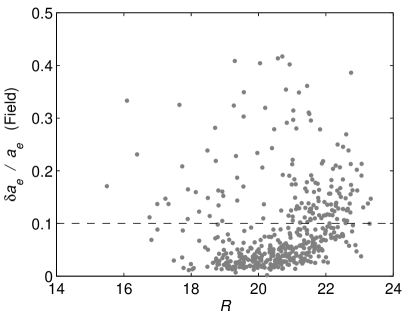
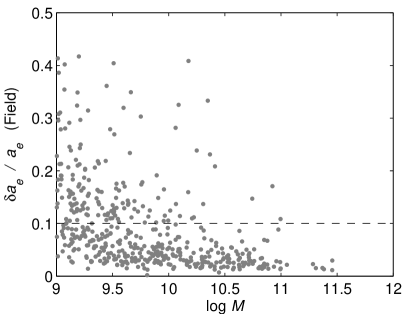
In the determination of our physical galaxy sizes we have used the cluster redshift () for our cluster samples but used the original COMBO-17 redshift estimates for our field sample. Therefore, the errors in the COMBO-17 photometric redshifts () propagate into the physical size measurements of our field galaxies. Fig. 8 shows the relative error in associated with this photo- error (i.e. distance to galaxy () error) , plotted against -magnitude and stellar mass for our field galaxies. The errors can reach out to per cent on a galaxy-galaxy basis and generally increase towards fainter -magnitudes and with decreasing stellar mass. We therefore need to be careful that large galaxies are not affecting our analysis, especially at intermediate/low stellar masses where we find a difference in between the field and cluster/core spirals.
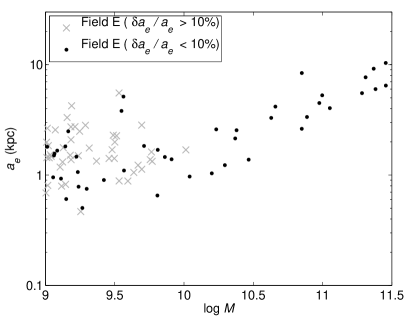
The individual COMBO-17 photo- errors are expected errors based on the shape of the redshift probability distribution (PDF) of a galaxy. As such they can sometimes underestimate the true error when the PDF is based on an incomplete set of comparison templates (i.e. the real spectrum is an unusual one). When the PDF is wide and the estimated error is large, it means that redshift ambiguities are actually present. It is a true sign that the redshift is potentially unreliable. In order to assess the effect of large galaxies on our mass-size relations and analysis, we remove all galaxies from our field sample with per cent, see Figs. 8–9.
For elliptical galaxies there was no effect on the level of significance of the K–S test results; and , in each mass bin. In no cases did the level of significance go above the level. Therefore, our conclusion that there is no evidence to suggest an environmental dependence on the stellar mass-size relation for elliptical galaxies is robust with respect to large galaxies.
For lenticular galaxies there was no effect on the level of significance of the K–S test results for high and low masses () with and remaining below the significance level. However, at intermediate masses () both and increase in significance to the level. In this case, the removal of the large galaxies has introduced a selection effect (see Fig. 9) causing a bias towards smaller sizes and also dramatically reduced the number of field lenticulars in this mass bin. Therefore, we do not trust the high significance in this case and our conclusion that there is no evidence to suggest an environmental dependence on the stellar mass-size relation for these galaxies is robust with respect to large galaxies.
For high-mass spirals () the significance is also robust with respect to the removal of the large galaxies and is below the level for both the , and . For intermediate-mass spirals () the high significance of increases to above the level, however, remains below the level, possibly due to low number statistics. For low-mass spirals () the high significance of , remains at the level, and the significance of increases from below the level to the level, indicating that large errors could be masking the effect in this region. Therefore, our conclusion that the field and cluster/core samples are potentially being drawn from different continuous distributions at intermediate/low-masses is robust with respect to large errors.
4.2 Photometric Redshift Bias
At present, photometric redshifts on the STAGES (A901/2) field have only been assessed for quality by comparison to spectroscopic redshifts at bright magnitudes. Wolf et al. (2004) find for a sample of 404 bright galaxies with and , 351 of which were from the A901/2 field, that per cent had photo- deviations of , and only per cent had deviations from the true redshift.
There are currently no spectroscopic redshifts on the A901/2 field for comparison at faint magnitudes. However, a faint spectroscopic dataset does exist on the COMBO-17 CDFS field from the VIMOS VLT Deep Survey (VVDS; Le Fèvre et al., 2004). Hildebrandt et al. (2008) use a sample of 420 high-quality spectroscopic redshifts that are reasonably complete to and find a scatter of 0.018 in and also a mean bias of .
The mean redshift bias is dependent on errors in the photometric calibration. In COMBO-17 the photometric calibration has slight variations from field to field and therefore the photo- bias measured on the CDFS cannot be assumed to hold for the A901/2 field. However, we need to be careful that any environmental effect on the stellar mass-size relation between the field and cluster/core samples is not due to a redshift bias on our field sample causing biased galaxy . In order to address this, we use the bias for the CDFS field as an order of magnitude estimate for any potential redshift bias on the A901/2 field. We then assess the degree of uncertainty caused by a redshift bias on our field sample, and evaluate its propagation into our results. We do not consider the result valid if the redshift bias introduces any significance at the level due to the uncertain nature of the bias. However, we test to see if the bias causes our high significance results (i.e. intermediate/low-mass spirals) to drop below the level.
For intermediate mass spirals (), is only robust to a positive redshift bias. However, after the removal of large galaxies the level of significance is completely robust to a redshift bias and is always above the level. For low-mass spirals (), the level of significance for is only robust to a positive redshift bias. However, after the removal of large galaxies the level of significance is completely robust to a redshift bias and is always above the level. For after the removal of large galaxies the significance is completely robust to a redshift bias and is always above the level.
4.3 The Effect of Contaminations
Contamination of cluster samples by the field could also have potentially masked an environmental dependence on the stellar mass-size relation in our comparison of the field and cluster for low-mass spirals. In order to address this, we use Monte-Carlo simulations to evaluate the effect of contaminations on in each stellar mass bin for spiral galaxies.
In each environment and stellar mass bin we assume the true distribution of spiral galaxies follows a Gaussian with the same mean and standard deviation as the corresponding sub-sample in the actual data. We then use Monte-Carlo simulations to sample respective distributions in order to obtain a simulated sample of field and “pure” cluster galaxies in each stellar mass bin. We then perform K–S tests between corresponding sub-samples from the field and cluster distributions in order to obtain the probability in each stellar mass bin. The pure cluster samples were then contaminated by galaxies sampled from the field distribution, with a fraction corresponding to the level given in Table 2. Respective sample sizes were matched to that of the actual data. The same K–S tests were then applied between the field and contaminated cluster samples. This Monte-Carlo simulation process was repeated 100,000 times.
For each iteration we also obtain between the pure and contaminated cluster samples in each stellar mass bin in order to assess if any potential bias in is caused by the contamination by the field. We then correct for this bias and evaluate its effect on our K–S tests in order to assess if the contamination is potentially masking an environmental dependence for spiral galaxies at low stellar masses. For high and intermediate masses (), this bias has no effect on the significance of the K–S tests. However, we do observe a change in significance at low stellar masses (), where we find that a mean bias of is expected on the cluster sample. Correcting for this bias causes the significance of to increase from to above the level (). This indicates that the per cent contamination of the cluster sample by the field is potentially masking an environmental dependence at low stellar masses.
4.4 Visual Inspection
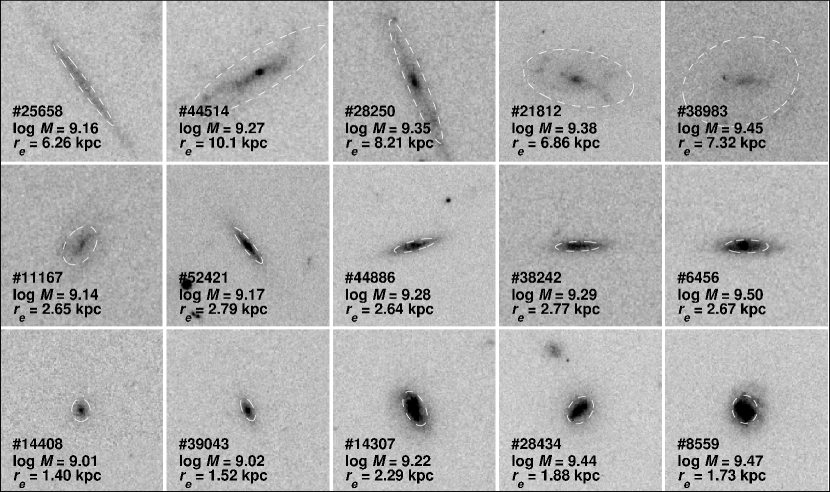
In order to further validate our results, we examined the ACS images of the low-mass (), large- field spirals and compared them to the ACS images of median- field and cluster core spirals of similar stellar mass. The semi-major axis effective radius isophote (calculated using the ellipticity and position angle from the GALFIT model) was over-plotted on each ACS image in order to assess the physical size of the galaxy. Fig. 10 shows a selection of these comparisons across the low-mass range. We find that the large- field spirals appear to have extended discs that are not present in the cluster core spirals. We inspected the ACS images for all 15 low-mass cluster core spirals and find that these extended discs are absent from all but one of the low-mass spirals in the cluster core. The exception could well be a field contaminate (we expect a per cent contamination of the cluster sample by the field, see § 2.3.1) or could be just arriving in the core of the cluster. In Fig. 10 a couple of the large- spiral fits (e.g. and ) are potentially unreliable with the effective radius appearing to be over-estimated. However, the fact that no similar potentially unreliable fits are observed in the cluster core suggests the field sample is drawn from a different parent population for low-mass spirals. We hypothesize that the extended disks present in the low-mass, large-, field spirals do not survive the environmental conditions of the cluster core.
5 Conclusions
We present the stellar mass-size relations for elliptical, lenticular, and spiral galaxies in three different environments: the field, cluster, and cluster core, using HST/ACS imaging and data from STAGES. We use a large sample of field and cluster galaxies, and a cluster sub-sample of cluster core galaxies, and determine the significance of an environmental dependence on the stellar mass-size relation for each morphological type.
For elliptical and lenticular galaxies, significance of an environmental dependence on the stellar mass-size relation is below the level for all mass bins, . These results have been shown to be completely robust to galaxies with high photo- errors and to the effect of a potential photo- bias on the A901/2 field. We conclude that there is no evidence to suggest a significant dependence on the environment of the stellar mass-size relations for elliptical and lenticular galaxies. This implies that elliptical and lenticular galaxies have undergone a similar size evolution in these environments. This result is in qualitative agreement with the work of Rettura et al. (2008) who came to the same conclusion at higher redshift () using a much smaller sample of 45 cluster and field massive () early-type galaxies.
Size evoution is observed to be stronger for early-type galaxies than late-type galaxies (Trujillo et al., 2007). Therefore, if the environment was the principal driver of size evolution, one would expect the environmental dependence of the stellar mass-size relation to be strongest for elliptical and lenticular galaxies. The fact that we find no such dependence suggests internal drivers (e.g., AGN feedback, Fan et al., 2008) are governing their size evolution.
For spiral galaxies, we also find no evidence to suggest an environmental dependence on the stellar mass-size relation for high-masses (), with the significance of an environmental dependence below the level. However, we find a significant environmental dependence (at the level) at intermediate/low stellar masses (). We also find the mean for low-mass spirals to be larger in the field than the cluster/core due to a population of large- spirals in the field that are largely absent from the cluster/core environments. Inspection of the ACS images of low-mass spirals has shown that large- spirals in the field contain extended discs that are largely absent from the cluster and cluster core. We hypothesise that the observed fragile discs of these low-mass field spirals may not survive the conditions of the cluster environments. The significance of these results have been shown to be completely robust to large photo- errors and a potential photo- bias on the A901/2 field. This result is in qualitative agreement with the work of Guo et al. (2009) and Weinmann et al. (2009), who find that at fixed mass, low-mass late-type satellite galaxies (in larger groups/clusters) are smaller than similar mass late-type central galaxies (in smaller groups i.e. the field).
Size evolution is observed to be stronger for more massive galaxies (Franx et al., 2008). Therefore, if the environment was the principal driver behind the size evolution of spiral galaxies, one would expect the environmental dependence of the stellar mass-size relation to be stronger for high-mass spirals. However, the fact that we find no such dependence suggests internal drivers are governing their size evolution. For low-mass spirals we do observe a significant effect of the environment on the stellar mass-size relation suggesting that the environment probably has an effect on the size evolution at intermediate/low masses.
The results presented here are for one survey field and one multi-cluster complex, therefore, we intend to test the environmental dependence of the stellar mass-size relation in other fields and across a wide redshift range. Studies of field and cluster galaxy sizes over a wide redshift range will allow galaxy size evolution to be characterised for the field and cluster environments. This test will provide the strong evidence needed to assess if the environment really does play a role in galaxy size evolution. Also, in order to assess the potential mechanisms responsible for size evolution we intend to extend our studies to look at the environmental dependence of galaxy radial surface brightness profiles in STAGES galaxies. By looking at a galaxy radial surface brightness profile, we can assess if elliptical and lenticular galaxies have compact cores or cusps, if compact cores are identified it would be evidence for smooth envelope accretion (minor/major mergers) having an effect on the size evolution of galaxies. We can also assess if spiral galaxies have discs that are truncated or anti-truncated, which will effect the effective radius, and may also be dependent on the environment.
6 Acknowledgements
Support for STAGES was provided by NASA through GO-10395 from STScI operated by AURA under NAS5-26555. DTM acknowledges the support of STFC. MEG and CW were supported by an STFC Advanced Fellowship. BH was supported by STFC. MB and EvK acknowledge the support of FWF grant P18416.
References
- Barden et al. (2005) Barden M., Rix H.-W., Somerville R. S., Bell E. F., Häußler B., Peng C. Y., Borch A., Beckwith S. V. W., Caldwell J. A. R., Heymans C., Jahnke K., Jogee S., McIntosh D. H., Meisenheimer K., Sánchez S. F., Wisotzki L., Wolf C., 2005, ApJ, 635, 959
- Bell et al. (2005) Bell E. F., Papovich C., Wolf C., Le Floc’h E., Caldwell J. A. R., Barden M., Egami E., McIntosh D. H., Meisenheimer K., Pérez-González P. G., Rieke G. H., Rieke M. J., Rigby J. R., Rix H.-W., 2005, ApJ, 625, 23
- Borch et al. (2006) Borch A., Meisenheimer K., Bell E. F., Rix H.-W., Wolf C., Dye S., Kleinheinrich M., Kovacs Z., Wisotzki L., 2006, A&A, 453, 869
- Buitrago et al. (2008) Buitrago F., Trujillo I., Conselice C. J., Bouwens R. J., Dickinson M., Yan H., 2008, ApJ, 687, L61
- Cimatti et al. (2008) Cimatti A., Cassata P., Pozzetti L., Kurk J., Mignoli M., Renzini A., Daddi E., Bolzonella M., Brusa M., Rodighiero G., Dickinson M., Franceschini A., Zamorani G., Berta S., Rosati P., Halliday C., 2008, A&A, 482, 21
- Daddi et al. (2005) Daddi E., Renzini A., Pirzkal N., Cimatti A., Malhotra S., Stiavelli M., Xu C., Pasquali A., Rhoads J. E., Brusa M., di Serego Alighieri S., Ferguson H. C., Koekemoer A. M., Moustakas L. A., Panagia N., Windhorst R. A., 2005, ApJ, 626, 680
- De Lucia et al. (2004) De Lucia G., Kauffmann G., White S. D. M., 2004, MNRAS, 349, 1101
- Dressler (1980) Dressler A., 1980, ApJ, 236, 351
- Fan et al. (2008) Fan L., Lapi A., De Zotti G., Danese L., 2008, ApJ, 689, L101
- Fioc & Rocca-Volmerange (1997) Fioc M., Rocca-Volmerange B., 1997, A&A, 326, 950
- Franx et al. (2008) Franx M., van Dokkum P. G., Schreiber N. M. F., Wuyts S., Labbé I., Toft S., 2008, ApJ, 688, 770
- Giavalisco et al. (2004) Giavalisco M., Ferguson H. C., Koekemoer A. M., Dickinson M., et al. 2004, ApJ, 600, L93
- Graham et al. (1996) Graham A., Lauer T. R., Colless M., Postman M., 1996, ApJ, 465, 534
- Gray et al. (2009) Gray M. E., Wolf C., Barden M., Peng C. Y., Häußler B., Bell E. F., McIntosh D. H., et al. 2009, MNRAS, 393, 1275
- Gunn & Gott (1972) Gunn J. E., Gott J. R. I., 1972, ApJ, 176, 1
- Guo et al. (2009) Guo Y., McIntosh D. H., Mo H. J., Katz N., van den Bosch F. C., Weinberg M., Weinmann S. M., Pasqual A., Yang X., 2009, ArXiv e-prints
- Häussler et al. (2007) Häussler B., McIntosh D. H., Barden M., Bell E. F., Rix H.-W., Borch A., Beckwith S. V. W., Caldwell J. A. R., Heymans C., Jahnke K., Jogee S., Koposov S. E., Meisenheimer K., Sánchez S. F., Somerville R. S., Wisotzki L., Wolf C., 2007, ApJS, 172, 615
- Hildebrandt et al. (2008) Hildebrandt H., Wolf C., Benítez N., 2008, A&A, 480, 703
- Kauffmann et al. (2004) Kauffmann G., White S. D. M., Heckman T. M., Ménard B., Brinchmann J., Charlot S., Tremonti C., Brinkmann J., 2004, MNRAS, 353, 713
- Khochfar & Silk (2006) Khochfar S., Silk J., 2006, ApJ, 648, L21
- Kroupa et al. (1993) Kroupa P., Tout C. A., Gilmore G., 1993, MNRAS, 262, 545
- Larson et al. (1980) Larson R. B., Tinsley B. M., Caldwell C. N., 1980, ApJ, 237, 692
- Le Fèvre et al. (2004) Le Fèvre O., Vettolani G., Paltani S., Tresse L., Zamorani G., Le Brun V., Moreau C., et al. 2004, A&A, 428, 1043
- Longhetti et al. (2007) Longhetti M., Saracco P., Severgnini P., Della Ceca R., Mannucci F., Bender R., Drory N., Feulner G., Hopp U., 2007, MNRAS, 374, 614
- McIntosh et al. (2005) McIntosh D. H., Bell E. F., Rix H.-W., Wolf C., Heymans C., Peng C. Y., Somerville R. S., Barden M., Beckwith S. V. W., Borch A., Caldwell J. A. R., Häußler B., Jahnke K., Jogee S., Meisenheimer K., Sánchez S. F., Wisotzki L., 2005, ApJ, 632, 191
- Moore et al. (1996) Moore B., Katz N., Lake G., Dressler A., Oemler A., 1996, Nature, 379, 613
- Naab et al. (2007) Naab T., Johansson P. H., Ostriker J. P., Efstathiou G., 2007, ApJ, 658, 710
- Okamoto & Nagashima (2004) Okamoto T., Nagashima M., 2004, in Diaferio A., ed., IAU Colloq. 195: Outskirts of Galaxy Clusters: Intense Life in the Suburbs The roles of ram-pressure stripping and minor mergers in the evolution of galaxies. pp 534–538
- Peng et al. (2002) Peng C. Y., Ho L. C., Impey C. D., Rix H.-W., 2002, AJ, 124, 266
- Rettura et al. (2008) Rettura A., Rosati P., Nonino M., Fosbury R. A. E., Gobat R., Menci N., Strazzullo V., Mei S., Demarco R., Ford H. C., 2008, ArXiv e-prints
- Sérsic (1968) Sérsic J. L., 1968, Atlas de galaxias australes. Cordoba, Argentina: Observatorio Astronomico, 1968
- Shen et al. (2003) Shen S., Mo H. J., White S. D. M., Blanton M. R., Kauffmann G., Voges W., Brinkmann J., Csabai I., 2003, MNRAS, 343, 978
- Toft et al. (2007) Toft S., van Dokkum P., Franx M., Labbe I., Förster Schreiber N. M., Wuyts S., Webb T., Rudnick G., Zirm A., Kriek M., van der Werf P., Blakeslee J. P., Illingworth G., Rix H.-W., Papovich C., Moorwood A., 2007, ApJ, 671, 285
- Trujillo et al. (2009) Trujillo I., Cenarro A. J., de Lorenzo-Cáceres A., Vazdekis A., de la Rosa I. G., Cava A., 2009, ApJ, 692, L118
- Trujillo et al. (2007) Trujillo I., Conselice C. J., Bundy K., Cooper M. C., Eisenhardt P., Ellis R. S., 2007, MNRAS, 382, 109
- Trujillo et al. (2006) Trujillo I., Feulner G., Goranova Y., Hopp U., Longhetti M., Saracco P., Bender R., Braito V., Della Ceca R., Drory N., Mannucci F., Severgnini P., 2006, MNRAS, 373, L36
- Trujillo et al. (2006) Trujillo I., Förster Schreiber N. M., Rudnick G., Barden M., Franx M., Rix H.-W., Caldwell J. A. R., et al. 2006, ApJ, 650, 18
- van den Bosch et al. (2008) van den Bosch F. C., Pasquali A., Yang X., Mo H. J., Weinmann S., McIntosh D. H., Aquino D., 2008, ArXiv e-prints
- van der Kruit (1979) van der Kruit P. C., 1979, A&AS, 38, 15
- van der Wel et al. (2008) van der Wel A., Holden B. P., Zirm A. W., Franx M., Rettura A., Illingworth G. D., Ford H. C., 2008, ApJ, 688, 48
- van Dokkum (2005) van Dokkum P. G., 2005, AJ, 130, 2647
- van Dokkum et al. (2008) van Dokkum P. G., Franx M., Kriek M., Holden B., Illingworth G. D., Magee D., Bouwens R., Marchesini D., Quadri R., Rudnick G., Taylor E. N., Toft S., 2008, ApJ, 677, L5
- Weinmann et al. (2009) Weinmann S. M., Kauffmann G., van den Bosch F. C., Pasquali A., McIntosh D. H., Mo H., Yang X., Guo Y., 2009, MNRAS, 394, 1213
- Weinmann et al. (2006) Weinmann S. M., van den Bosch F. C., Yang X., Mo H. J., 2006, MNRAS, 366, 2
- Wolf et al. (2009) Wolf C., Aragón-Salamanca A., Balogh M., Barden M., Bell E. F., Gray M. E., Peng C. Y., et al. 2009, MNRAS, 393, 1302
- Wolf et al. (2008) Wolf C., Hildebrandt H., Taylor E. N., Meisenheimer K., 2008, A&A, 492, 933
- Wolf et al. (2004) Wolf C., Meisenheimer K., Kleinheinrich M., Borch A., Dye S., Gray M., Wisotzki L., Bell E. F., Rix H.-W., Cimatti A., Hasinger G., Szokoly G., 2004, A&A, 421, 913
- Wolf et al. (2003) Wolf C., Meisenheimer K., Rix H.-W., Borch A., Dye S., Kleinheinrich M., 2003, A&A, 401, 73
- York et al. (2000) York D. G., Adelman J., Anderson Jr. J. E., Anderson S. F., Annis J., Bahcall N. A., Bakken J. A., et al. 2000, AJ, 120, 1579
- Zirm et al. (2007) Zirm A. W., van der Wel A., Franx M., Labbé I., Trujillo I., van Dokkum P., Toft S., Daddi E., Rudnick G., Rix H.-W., Röttgering H. J. A., van der Werf P., 2007, ApJ, 656, 66