A Radio System for Avoiding Illuminating Aircraft with a Laser Beam
Abstract
When scientific experiments require transmission of powerful laser or radio beams through the atmosphere the Federal Aviation Administration (FAA) requires that precautions be taken to avoid inadvertent illumination of aircraft. Here we describe a highly reliable system for detecting aircraft entering the vicinity of a laser beam by making use of the Air Traffic Control (ATC) transponders required on most aircraft. This system uses two antennas, both aligned with the laser beam. One antenna has a broad beam and the other has a narrow beam. The ratio of the transponder power received in the narrow beam to that received in the broad beam gives a measure of the angular distance of the aircraft from the axis that is independent of the range or the transmitter power. This ratio is easily measured and can be used to shutter the laser when the aircraft is too close to the beam. Prototype systems operating on astronomical telescopes have produced good results.
1 Introduction
A number of scientific experiments require the transmission of a laser beam through the atmosphere, using an astronomical telescope or its equivalent. In order to avoid hazard to aircraft the FAA requires that one or more observers be stationed outside any telescope that is transmitting a laser beam. These observers close the laser shutter when an aircraft is observed within of the laser beam (as viewed from the telescope). Such experiments include: lunar and satellite laser ranging (Dickey et al., 1994; Pearlman et al., 2002); creation of artificial guide stars for active optics (e.g., Wizinowich et al., 2006); and atmospheric remote sensing using lidar (Measures, 1984; Jelalian, 1992). In this paper we discuss part of an aircraft detection system now employed at the Apache Point Observatory (APO) for a lunar ranging experiment called APOLLO (Murphy et al., 2008). This system could be used not only for the other laser beam experiments mentioned above, but also for protecting aircraft from high-powered radar transmitters such as those used for ionospheric research (e.g., Folkstead et al., 1983). The detection scheme described here is used in conjunction with a complementary infrared camera detection system, together providing robust protection to aircraft.
The FAA rules effectively require transponders on all commercial aircraft and most private aircraft (the exact language can be found in Section 91.215 of the Federal Aviation Regulations: FAA, 2009). These transponders are interrogated frequently (at 1030 MHz) by the regional ATC radars and also by the airborne Traffic Collision Avoidance System (TCAS). The transponders reply incoherently at MHz with a pulse coded response. The response must have vertical electric field polarization, an omni-directional pattern, and transmitted peak power between 70 and 500 W. Various coding schemes convey information about the aircraft. Mode-A and Mode-C responses communicate a temporarily assigned aircraft identity and altitude, respectively. A newer Mode-S encoding flexibly communicates permanent aircraft identity, coordinates, altitude, etc., but still as pulsed transmission at 1090 MHz.
The APOLLO laser is never used at elevations less than and this elevation restriction is typical of other laser and radar transmitters. Thus for practical altitudes of km the aircraft range will not exceed 50 km, and the received power is very high by modern communications standards ( dBm) so that it may be easily detected with a total power receiver. However the received power is highly variable because both the range and the transmitted power are variable. The design requirement is a highly reliable method of detecting when an aircraft transponder is within about of the telescope beam. This specification—differing from the 25∘ angle used by human spotters—is set by the expected angular rate of aircraft, transponder interrogation frequency, and the desire to avoid excessive triggers when pointing the beam as low as above the horizon. The general concept is to use two antennas aligned with the optical axis of the telescope, one with a beam width (full-width at half-power) of about and the other with a beam width of about , as shown in Figure 1. The ratio of the power received by the narrow beam antenna to that received by the broad beam antenna depends only on the angular position of the transponder with respect to the beam axis. In particular it does not depend on the distance, transmitted power, or polarization mismatch.
The APO telescope, like many others used in this type of experiment, is on an altazimuth mount with a secondary mirror more than 80 cm in diameter centered on the optical axis. The radio antennas can be mounted facing the sky on the secondary support structure and aligned with the optical axis without interfering with the optical beam, and the polarization will remain vertical as the telescope is moved. This geometry is also typical of the radar antennas used for ionospheric research although the secondary reflector is much larger in these cases. For telescopes on an equatorial mount the position angle of the linear polarization changes with hour angle. This variation can be easily accommodated by changing to antennas that are sensitive to circular polarization.
Simple patch antennas are well-suited to this application because the narrow bandwidth of a simple patch is an advantage when the signal also has a narrow bandwidth. Patches are also very robust mechanically—a significant advantage in this application. The polarization of a patch can be changed from linear to circular simply by moving the feed point. A single patch is suitable for the broad beam antenna and the narrow beam antenna can be made with an array of patches. The ratio of the power in the array to the power in a single patch will depend only on the array factor, which is easily calculated. The element spacing of the array can be adjusted to optimize the beam width and the sidelobe levels.
The system design consists primarily of: impedance matching a simple patch antenna at 1090 MHz; adjusting the array configuration to obtain a suitable beam width and adequately low sidelobes; designing total power detectors for the two channels; development of signal processing electronics; and devising a reliable calibration system. A block diagram of the analog signal flow is shown in Figure 2. Here one can see that we have used the center element of the array both as an array element and as the broad beam element by splitting the signal with a power divider. To compensate for that power division, the other array elements must have -3 dB attenuators before the array summer.

2 Patch Design
We used a simple square patch excited by a post, fed by coaxial cable from behind the ground plane. As the desired E polarization is vertical the feed post must be centered in the horizontal coordinate and offset in the vertical coordinate, as shown in Figure 2. Should circular polarization be desired, the feed point would be moved to the corner and the horizontal and vertical widths would be made a few percent different. The resonant frequency is set by the vertical width of the patch. The impedance is determined primarily by the feed position and to a lesser extent by the horizontal width. We wanted to make the patch using 60 mil dielectric circuit board material, as such a patch has about the bandwidth we needed. We tested a patch made with FR4 circuit board material. We found that FR4 has sufficient dielectric loss at 1090 MHz that it reduces the Q of the resonance by about 50%. To avoid broadening the bandwidth and reducing the gain we used a new low-loss laminate (Rogers RO4535) which has a loss tangent about 10% of that of FR4. With this material the dielectric loss was small compared with the radiated power.
This is a very simple patch design so we did not use an electromagnetic simulator. We calculated the gain and impedance by modeling the patch as a pair of slots over an infinite ground plane connected by a microstrip transmission line with a lossy dielectric. We had to trim the final design by a few % after fabrication. The final dimensions were mm, mm, and the feed point was 23.3 mm above the lower edge. The ground plane occupied the entire back surface of the 105 mm square dielectric, so that the ground plane fabricated onto the antenna extended approximately 17 mm beyond the patch boundaries. The calculated gain for an infinite ground plane was 5.3 dBi, which includes a dielectric loss of 0.5 dB. The measured gain for a patch mounted on a large ground plane was dBi, a reasonable agreement. The impedance was measured for four different ground planes and is shown in Figure 3. A ground plane extending 51 mm past the antenna (a total of 68 mm beyond the patch) is indistinguishable from a much larger ground plane.
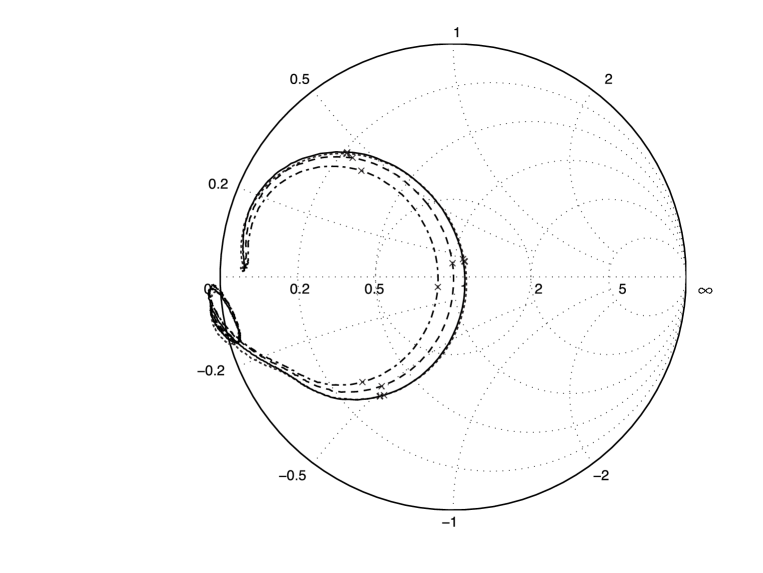
The extent of the ground plane is an important factor as it will often be convenient to minimize the weight and windage of the ground plane material. In the presence of the full array ground plane there is essentially no back radiation. However with a reduced ground plane there will be some back radiation and some change in impedance. Accordingly we measured the impedance and the front-to-back ratio of a single patch with different ground plane widths. The front to back ratio of the three smaller ground planes shown in Figure 3 above, were 9 dB, 13 dB and 22 dB. On the basis of these measurements we decided that a 50 mm aluminum border around the antenna was adequate.
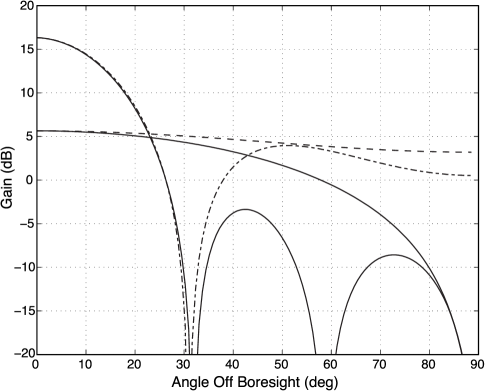
The beam of the patch is relatively broad. An H-plane cut through has behavior as shown in Figure 1 with a solid line. The pattern is broader in the E-plane (shown dashed in Figure 1), dropping only 2.4 dB at . We did not attempt to measure the beam width because a measurement without an adequate test range would be no better than our calculation, and the exact pattern of the patch is unimportant to our design because it factors out of the ratio of the array gain to the patch gain.
3 Array Design
The array must have a beam width of about and sidelobes at least 10 dB below the main beam. The array will be mounted with its normal aligned to the optical axis and the array elements will all be equally phased so the beam is normal to the array plane. The purpose of the array is to create a narrow beam, which can be compared with the broader beam of a single element, to determine the angular separation of the transponder from the telescope optical axis. Thus we are not concerned with the gain of the array as much as the ratio of its gain to that of a single patch (). The gain of the single patch factors out of this ratio, simplifying the calculation. The design problem then is to adjust the patch configuration to obtain an optimal ratio .
The gain of the array . The constant is determined such that the integral of over all space = . The array factor is given by
Here is the vector location of the patch, is the (complex) excitation of the element, and is the wave vector for a plane wave arriving at the array from the direction defined by . The desired ratio . Of course one must also allow for the gains of the amplifiers, losses in the cables and summing junction, etc.
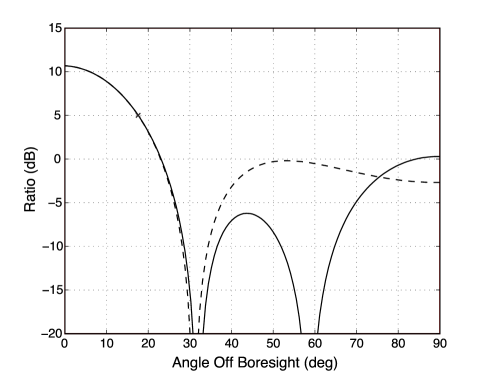
We searched the space of symmetrical equally-weighted arrays () with = 6, 7 and 9 to find a suitable with the minimum . We found a good fit to our requirements with a hexagonal configuration of = 7 elements. The pattern has a six part symmetry in azimuth with sidelobes at two phases. We have defined zero azimuth to be the horizontal as shown in Figure 2. The sidelobes have equal amplitude when the element spacing = 0.82. The peak-to-sidelobe ratio is 11 dB. Cuts through the ratio at azimuths of 0∘ (the H plane) and (the E plane), which correspond to the highest sidelobes, are shown in Figure 4. A detection threshold dB provides the greatest error margin. This corresponds to an angle of off the axis—close to the design goal and somewhat conservative.
The patch antennas were mounted on an aluminum plate to provide accurate location, and the beam former was mounted on the same plate. The plate provides a ground plane, but it is not essential that the ground plane be continuous provided that the ground extends 50 mm past each antenna. The outer boundary of the mounting plate was trimmed to provide just the necessary 50 mm of extent. Slots were also cut within the mounting plate where possible, to reduce the windage.
We did not expect much mutual coupling with the spacing of 0.82 wavelengths, but we measured the magnitude of between the elements. We found it was dB between colinear elements and dB between diagonal elements. We also measured the driving point impedance of the center element with all other elements open and also with all other elements loaded. We could not detect any deviation from the impedance of an isolated element with a ground plane more than 50 mm around the element.
We did not attempt to measure the pattern of the array because, with negligible mutual coupling, the calculation is more accurate than any measurement we could make. However we did measure the gain at the beam center. The calculated array gain is 16.3 dBi and the measurement was dBi, quite a reasonable agreement.
4 Receiver Design
The APOLLO laser is never operated at an elevation less than because the accuracy of the lunar ranging is degraded at low elevations by reduced throughput and atmospheric fluctuations. Thus the greatest range one can expect for aircraft flying 15 km above the site (itself at 2.8 km altitude) is 60 km. The gain of a single patch is about 4.7 dB so the signal level from the minimum-power transponder will be at least dBm. At a distance of 1 km the signal level would increase to about dBm. At the minimum reasonable distance of 100 m, the signal level would be about dBm.
The signal level is so high that the noise figure of the preamp is not a factor, but interference from the cellular communications band near 900 MHz can be very strong. Although the patch antenna has a dB bandwidth of 1%, it does not reject a signal at 900 MHz more than about dB. Thus a high-Q multipole band-pass filter is required. Fortunately suitable filters are available off-the-shelf. We used a 5 pole ceramic filter #930644 from the International Microwave Corporation. We also used a sharp-cutoff low-pass filter to reduce the interference from various communications above 2 GHz. Because the signal level is so high, we split the signal from the center array element and used it both for the array and for the broad-beam single element. To compensate for the 3 dB loss we inserted 3 dB attenuators in the path from the other elements to the beam former, as pictured in Figure 2.
There are a number of inexpensive log amplitude detectors with good accuracy and wide dynamic range. These are particularly attractive because the log of the desired power ratio can be obtained simply using a differential amplifier to subtract the log of the broad beam power from the log of the narrow beam power. We used an ZX47-60+ from Minicircuits Lab with a dynamic range of 5 dBm to dBm. To match this to the expected signal levels we used a preamplifier with a gain of about 38 dB before the power detector. The only requirement on the preamp is that it have relatively low bias current because it is important to minimize the power dissipated near the optical axis of the telescope to avoid image degradation arising from air turbulence. The output of the detectors need only pass the narrowest transponder pulse of 450 ns. We used a 3rd order Butterworth low pass filter with a 100 ns time constant to minimize the post-detection noise.
5 Signal Processing
The signal processing unit performs the dual function of deciding when to close the laser shutter and capturing the pulse code for logging aircraft identities and altitudes. An example pulse pattern is shown in Figure 5. The decision to close the shutter is based on four criteria, any of which—when satisfied—will result in laser closure:
-
1.
D1 = DIREC/BROAD ratio dB, AND DIREC signal dBm at detector
-
2.
D2 = DIREC signal dBm at detector
-
3.
D3 = BROAD signal dBm at detector
-
4.
D4 = Nominal
The first criterion is the most important, representing the directionally-sensitive detection mode. The second criterion avoids a failure mode of the first criterion due to saturation of the DIREC signal from a nearby source The third criterion prevents a nearby, fast-angular-motion airplane from getting into the protected zone before the other two criteria are activated—keeping in mind that we rely on external interrogation occurring before sensing the presence of the aircraft. Each of these decisions is based on comparators sensing the outputs of the logarithmic power detectors and referenced to an adjustable voltage, with the DIREC/BROAD ratio provided by a difference of the logarithmic outputs. The angular size of the protected zone on the sky is adjustable by setting the difference-comparator reference voltage.
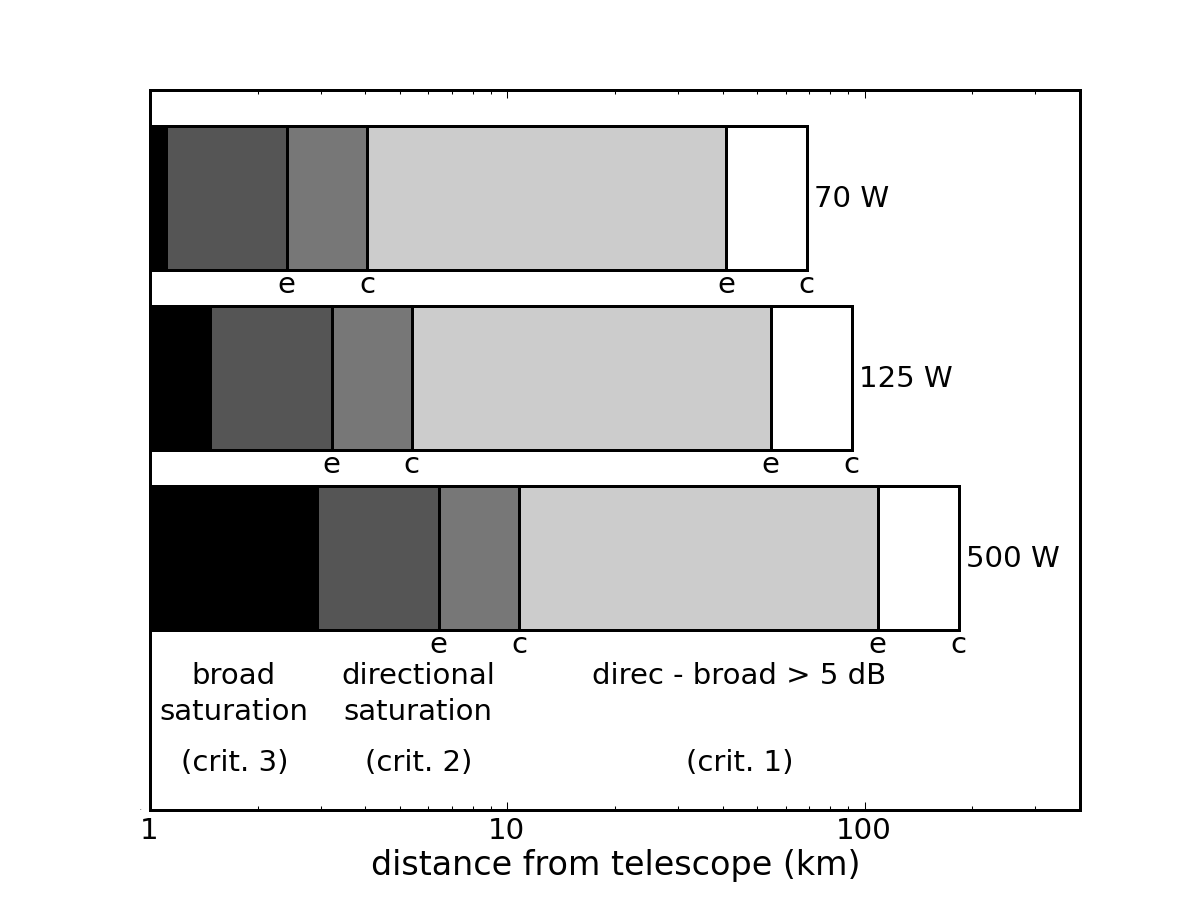
The criteria based on signal levels map into different nominal ranges for the three different peak power requirements imposed by the FAA. For non-commercial traffic (typically low-altitude), the minimum peak power requirement is 70 W. For commercial aircraft, the minimum requirement is 125 W. The maximum allowable peak power is 500 W. Figure 6 illustrates the distances to which the first three criteria in the list above apply for the three limiting cases of transmitted power. For example, an airplane with a 125 W transmitter will saturate the broad antenna channel (criterion 3) if within 1.9 km, will saturate the directional channel (criterion 2) within 3.2 km to 5.4 km depending on where it is within the directional beam, and will be protected by the “in beam” criterion (the first in the list) out to 55 to 92 km depending again on beam position.
Any of the three triggers activates a re-triggerable one-shot, holding the laser shutter in a closed condition for five seconds. Reaction time is within 30 s of signal receipt. The system is not confused by multiple aircraft in the beam at the same time. Any signal deemed to meet the above criteria will activate the shutter. The signal processing unit also monitors the power supply current to ensure that the components are operating normally before allowing the laser shutter to open.
The signal processing unit also captures the altitude and identity codes transmitted from aircraft that have triggered shutter closure, for the purpose of recording activity. This is done using a PIC microprocessor responding to the initial pulse via an interrupt service routine, then checking at regular intervals (about 1.45 s) for any pulse transitions within the previous pulse period. Though coded to interpret Mode-A (identity) and Mode-C (altitude) responses, the characteristic pattern of Mode-S transmissions can be discerned, and distance measuring equipment (DME) signals operating on the same transmit frequency band can also be identified. Note that any signal meeting the criterion established above will close the laser shutter regardless of information content. The information is used to build a data base of the frequency and nature of the aircraft-caused triggers—including a crude estimate of distance, given telescope elevation angle and aircraft altitude. The microprocessor can also assume control of the shutter and build in false-trigger avoidance. Electrostatic discharge or lightning generally produces a single pulse, while aircraft signals (Mode-A, Mode-C, Mode-S, DME) all contain multiple pulses within 20 s. These “glitches” may be ignored.
We have found that multi-path interference—especially seen by the broad beam antenna—often compromises the pulse quality, and often produces false triggers. We have successfully tested a method to mitigate such false triggers, by applying criterion 1 above only during a 50 ns window shortly following the leading edge of a clean pulse (one that has only background noise preceding it). We have seen this approach dramatically reduce the number of false “in-beam” triggers while not compromising the robust detection of true in-beam events.
Besides the check that the current delivered to the electronics is good, the microprocessor sends a keep-alive packet once per minute to assure system health. It is straightforward to verify that the system is operational before commencing with laser activities. Logged information is sufficient to verify sensitivity to aircraft on a nightly basis, but an in-dome calibrated transmitter may also be useful to verify proper sensitivity.
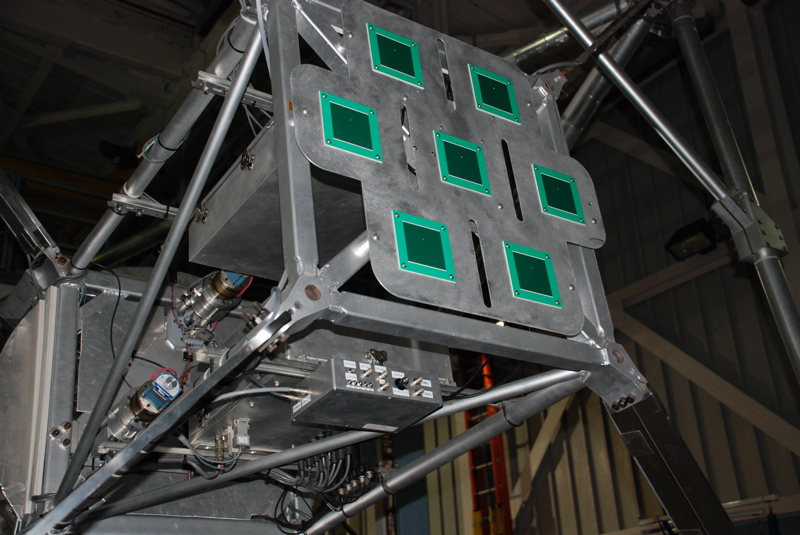
The system is implemented as three physical units, all designed and built at the University of California, San Diego (UCSD). The antenna array and passive summing devices are mounted to a single aluminum plate 0.63 m across that also serves as an extended ground plane. The RF processing and discrimination is performed in a small electronics enclosure measuring cm3 that is located close to the antenna. These electronics only consume 3 W of power, so that the box may be safely deployed in front of a telescope without disrupting image performance. The microprocessor and power supply occupy a second box measuring cm3 that may be located tens of meters from the antenna RF electronics. A connection from the microcontroller box to a computer or terminal server completes the system. Figure 7 shows the antenna mounted on the 3.5 m telescope at APO, on the sky-facing side of the secondary mirror support structure.
6 Performance
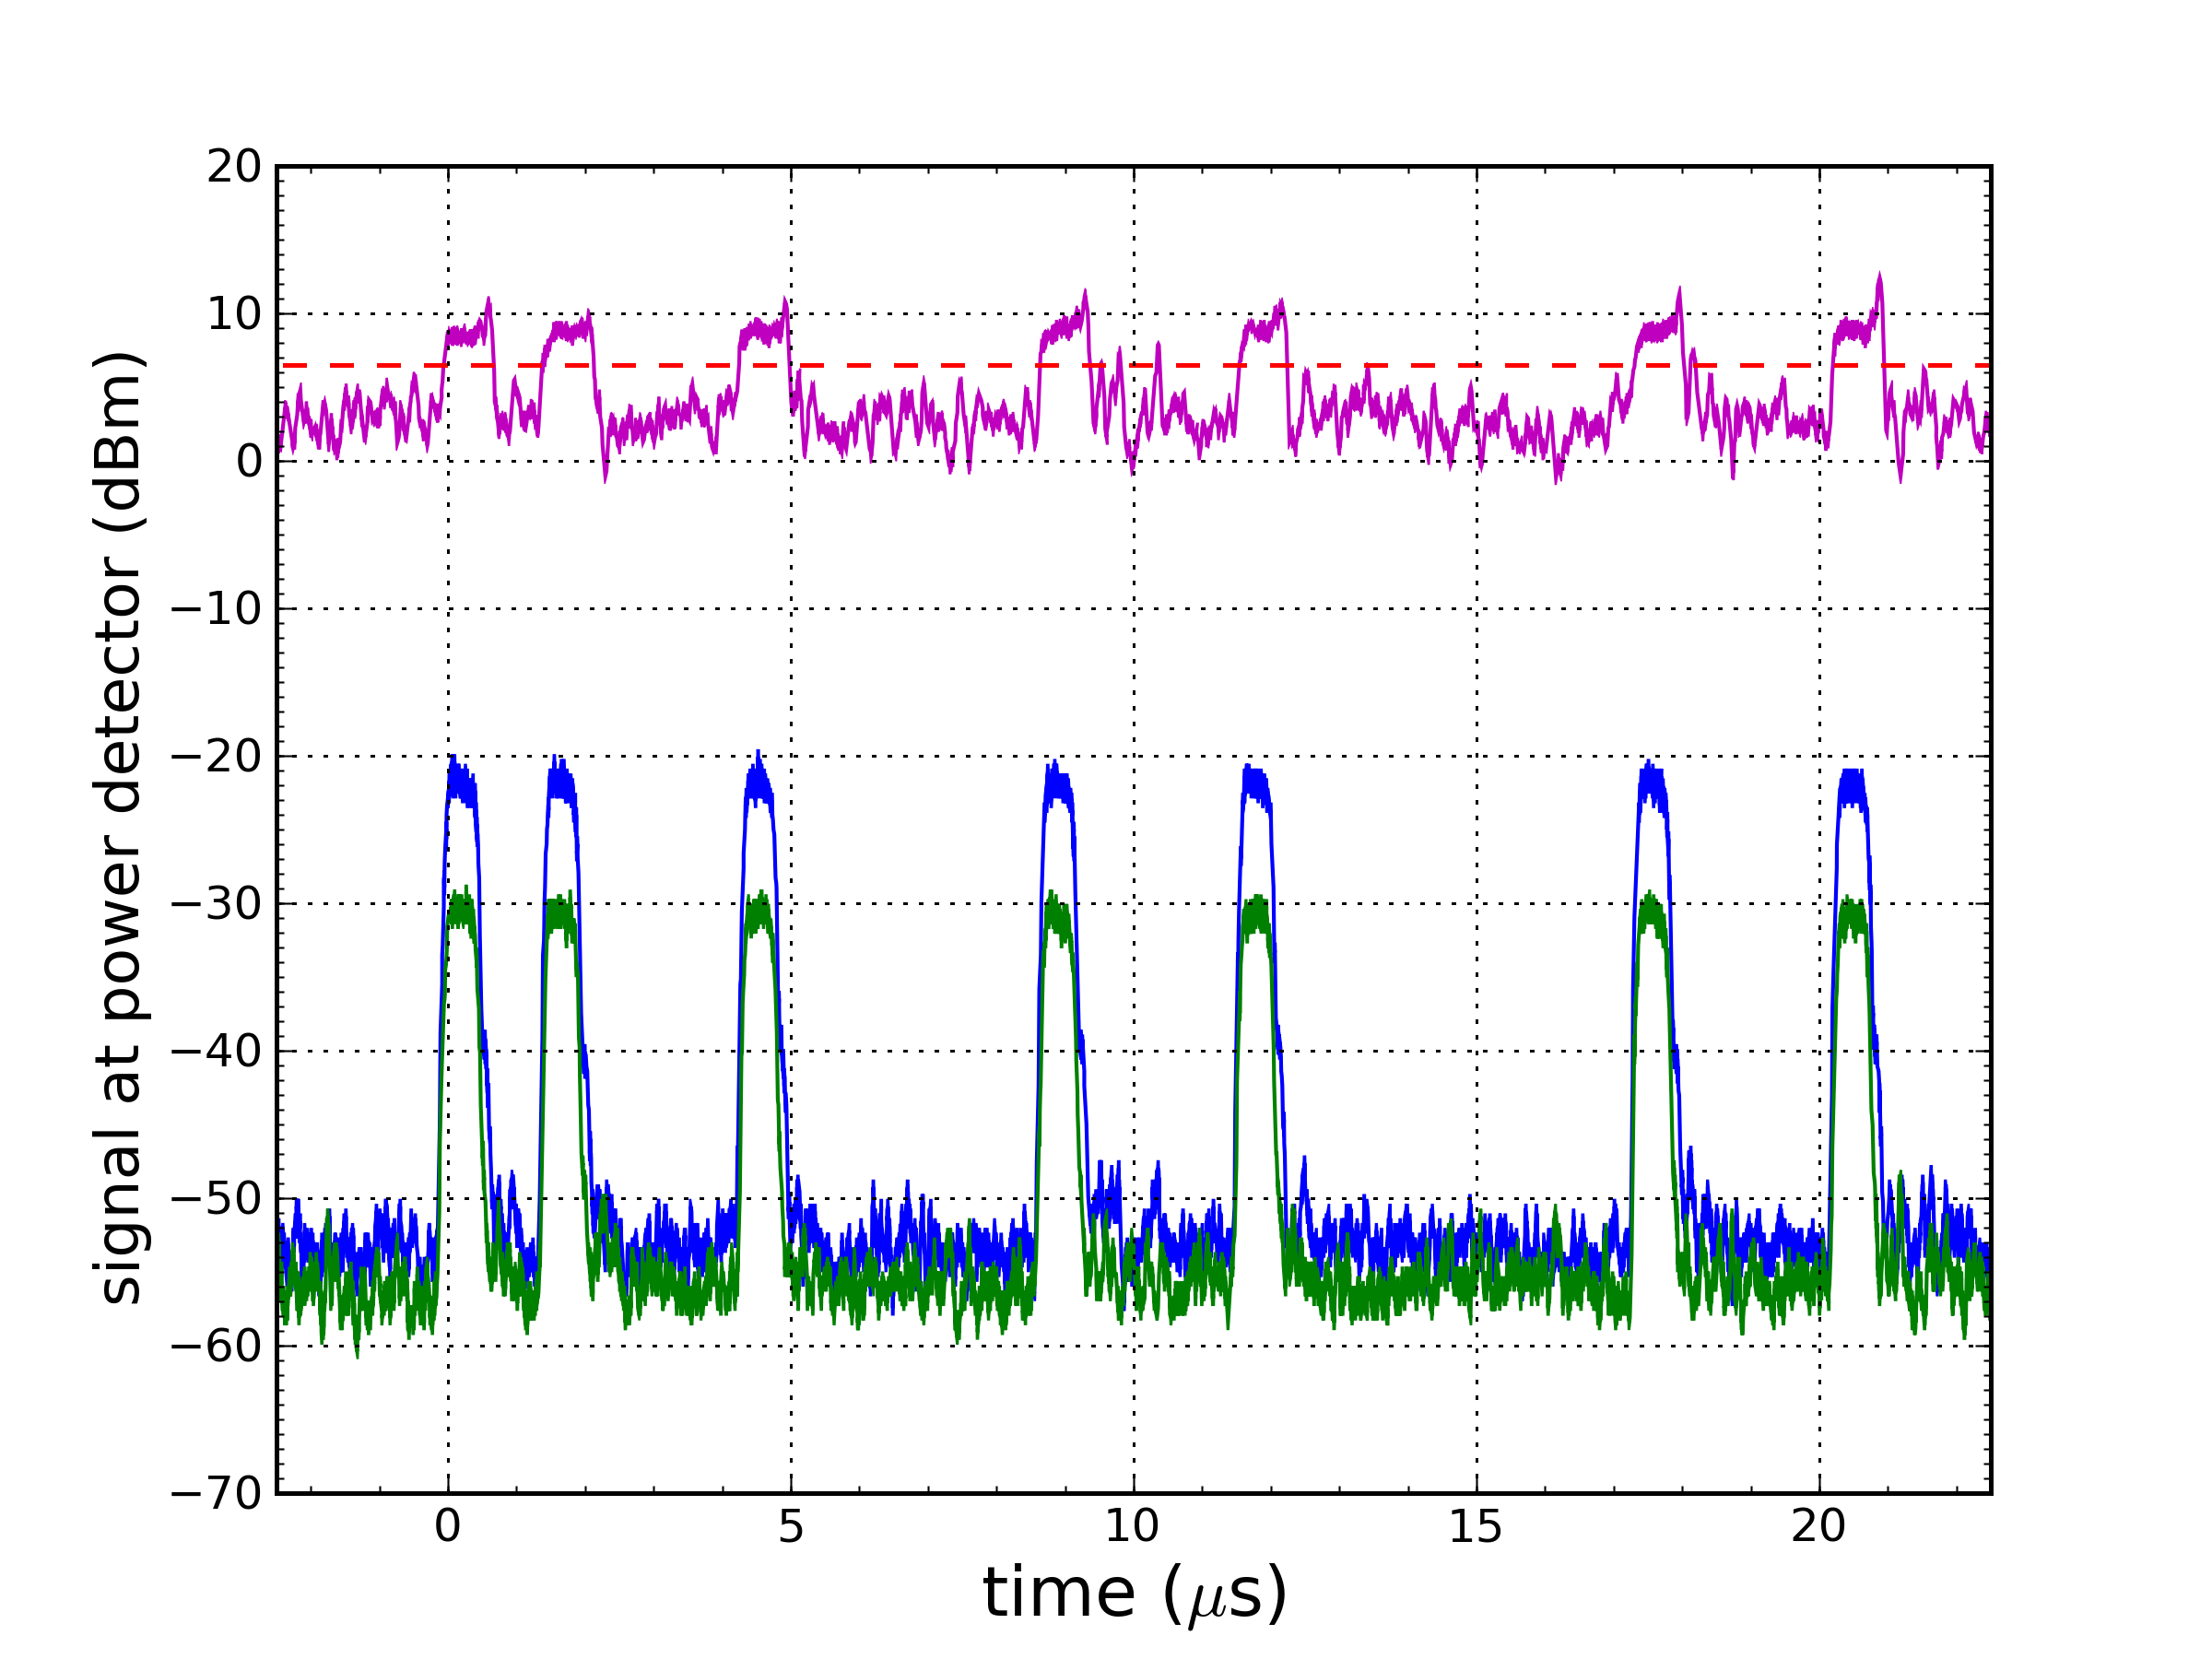
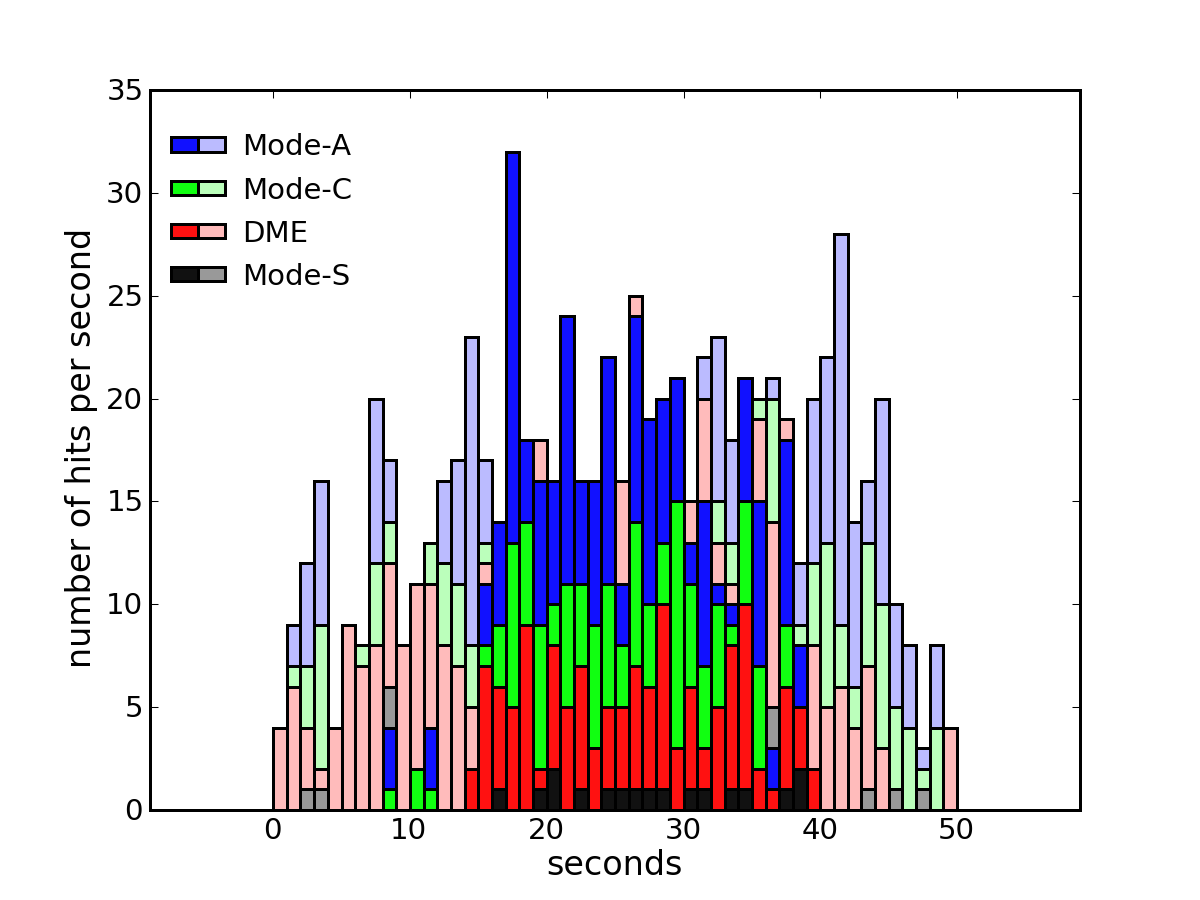
The antenna system was deployed on the Apache Point Observatory 3.5 m telescope on 2008 December 19 for initial characterization. Besides the trigger criteria detailed above, an alternate scheme is employed for the purpose of recording a greater amount of aircraft traffic as detected in the broad-beam antenna. Setting the detection threshold to sense airplanes within 20 km at 70 W peak power, or 52 km at 500 W, we typically record about 6 airplanes (maximum of 20) per night through the slit of the telescope enclosure, when open. This is based on 72 full nights of operation between 2008 December 31 and 2009 August 7. Note that the solid angle of visible sky is restricted by the enclosure to a range of 1.9–2.7 steradians depending on telescope elevation angle, averaging only 36% of the sky. On a nightly basis, about 2–3 (maximum of 9) airplanes cross the threshold to qualify as an “in-beam” detection, resulting in a median of 70 s (maximum 283 s) of shuttered time per night, out of about 42,000 s of open time (0.2% closure). As yet, all closure events are associated with real aircraft. Typical detection rates are about 12 events per second during a beam-crossing pass, about 40% of which are associated with Mode-A identity codes, 35% associated with Mode-C altitude codes, 20% with distance measuring equipment (DME) pulses, and 5% identified as Mode-S information packets. We decode and record the Mode-A and Mode-C information, but do not decode the Mode-S information with the present firmware. Figure 8 demonstrates the behavior of a typical beam-crossing detection. The metal telescope enclosure shields the antenna from line-of-sight detection at large angles, which results in a relatively tight truncation of the sequence. The central beam crossing is robustly detected in 408 events, roughly centered in the crossing of the open enclosure slit.
Tests of a second, improved system at the UCSD campus under heavy air traffic revealed a susceptibility to false triggers due to multi-path interference and coherent interference from overlapping pulses. When the antenna was pointed 25∘ off the horizon toward the San Diego International Airport 17 km to the south, the shutter was closed 40% of the time—and 80% during the busiest hours of the day. Implementing a 50 ns window in which to make the “in-beam” decision just after the leading edge of the individual pulses reduced this to 7% of the time. Additional filtering by the microprocessor to accept only events deemed to be in the beam more often than 10 times in any 5 second interval reduced many of the remaining spurious triggers so that the shutter was closed 3% of the time. More drastic filtering revealed a hard “floor” at 2% of the time, suggesting this to be the actual fraction of time aircraft occupied our beam. Zenith pointings at UCSD resulted in shutter closures 3% of the time without the leading-edge window filter, 0.4% with the filter, and 0.1% of the time with the additional software filtering activated. Observatories tend to be in far less congested areas, so that these interference issues—while manageable—will be less important.
References
- Dickey et al. (1994) Dickey, J. O., Bender, P. L., Faller, J. E., Newhall, X. X., Ricklefs, R. L., Ries, J. G., Shelus, P. J., Veillet, C., Whipple, A. L., Wiant, J. R., Williams, J. G., & Yoder, C. F. 1994, Science, 265, 482
- Folkstead et al. (1983) Folkestad, K., Hagfors, T., & Westerlund, S. 1983, Radio Science, 18, 867
- Pearlman et al. (2002) Pearlman, M. R., Degnan J. J., & Bosworth J. M. 2002, Adv. in Space Res., 30, 135
- Wizinowich et al. (2006) Wizinowich, P. L., Le Mignant, D., Bouchez, A. H., Campbell, R. D., Chin, J. C. Y., Contos, A. R., van Dam, M. A., Hartman, S. K., Johansson, E. M., Lafon, R. E., Lewis, H., Stomski, P. J., Summers, D. M. 2006, PASP, 118, 297
- Measures (1984) Measures, R. M., 1984, Laser remote sensing: Fundamentals and applications, Wiley Interscience, New York
- Jelalian (1992) Jelalian, A. V., 1992, Laser radar systems, Artech House, Boston
- Murphy et al. (2008) Murphy, T. W., Adelberger, E. G., Battat, J. B. R., Carey, L. N., Hoyle, C. D., Leblanc, P., Michelsen, E. L., Nordtvedt, K., Orin, A. E., Strasburg, J. D., Stubbs, C. W., Swanson, H. E., & Williams, E. 2008, PASP, 120, 20
- FAA (2009) http://www.faa.gov/regulations_policies/faa_regulations/Part91,Section215