Molecular Gas in Submillimetre-Faint, Star-Forming Ultraluminous Galaxies at z1
Abstract
We present interferometric CO observations of twelve z2 submillimetre-faint, star-forming radio galaxies (SFRGs) which are thought to be ultraluminous infrared galaxies (ULIRGs) possibly dominated by warmer dust (T40 K) than submillimetre galaxies (SMGs) of similar luminosities. Four other CO-observed SFRGs are included from the literature, and all observations are taken at the Plateau de Bure Interferometer (PdBI) in the compact configuration. Ten of the sixteen SFRGs observed in CO (63%) are detected at 4 with a mean inferred molecular gas mass of 21010 M⊙. SFRGs trend slightly above the local ULIRG LFIR-L relation. Since SFRGs are about two times fainter in radio luminosity but exhibit similar CO luminosities to SMGs, this suggests SFRGs are slightly more efficient star formers than SMGs at the same redshifts. SFRGs also have a narrow mean CO line width, 32080 km s-1. Many SMGs have similarly narrow CO line widths, but very broad features (900 km s-1) are present in a few SMGs and are absent from SFRGs. SFRGs bridge the gap between properties of very luminous 51012 L⊙SMGs and those of local ULIRGs and are consistent with intermediate stage major mergers. We suspect that more moderate-luminosity SMGs, not yet surveyed in CO, would show similar molecular gas properties to SFRGs. The AGN fraction of SFRGs is consistent with SMGs and is estimated to be 0.30.1, suggesting that SFRGs are observed near the peak phase of star formation activity and not in a later, post-SMG enhanced AGN phase. Excitation analysis of one SFRG is consistent with CO excitation observed in SMGs (turning over beyond 12CO(=43)). This CO survey of SFRGs serves as a pilot project for the much more extensive survey of Herschel and SCUBA-2 selected sources which only partially overlap with SMGs. Better constraints on the CO properties of a diverse high- ULIRG population are needed from ALMA to determine the evolutionary origin of extreme starbursts, and what role ULIRGs serve in catalyzing the formation of massive stellar systems in the early Universe.
keywords:
galaxies: evolution galaxies: high-redshift galaxies: infrared galaxies: starbursts1 Introduction
Ultraluminous infrared galaxies (ULIRGs) exhibit some of the most extreme star formation rates in the Universe. The volume density of higher redshift ULIRGs peaks at z2-3 (Chapman et al., 2005)this is also the peak epoch in the cosmic star formation rate density and volume density of active galactic nuclei (AGN; e.g. Fan et al., 2001; Richards et al., 2006). Not only does this indicate a possible link between supermassive black hole growth and rapid star formation, but it also signals the most active phase in galaxy evolution and formation. ULIRGs exhibit very intense (SFR200 M⊙ yr-1), short-lived bursts (100 Myr) of star formation. The possible life cycle of a ULIRG, from star-formation dominated, dust-enshrouded galaxy, to obscured AGN and then luminous quasar (e.g. Sanders et al., 1988; Veilleux et al., 2009), provides a testable evolutionary sequence.
The best studied ULIRGs at high redshift are submillimetre galaxies (SMGs; Blain et al., 2002) which are characterised by their detection at 850m with S mJy. While SMGs put powerful constraints on galaxy evolution theories and the environments of extreme star formation (Greve et al., 2005; Tacconi et al., 2006, 2008; Chapman et al., 2005; Pope et al., 2006), their selection is susceptible to strong temperature biasing (Eales et al., 2000; Blain et al., 2004). At the mean redshift of radio SMGs, z2.2, observations at 850m sample the Rayleigh-Jeans tail of blackbody emission where the observed flux density may be approximated by SL. Due to the strong dependence on dust temperature, the 850m flux density of warm-dust ULIRGs (T40 K) might be much lower than cooler dust specimens (T20-40 K) thus causing the warmer-dust galaxies to evade submm detection. This selection bias suggests that a large fraction of the z ULIRG population has not been accounted for in current work on high-z star formation.
Chapman et al. (2004) describe the first observational effort to identify warm-dust ULIRGs as a population, via the selection of submm-faint radio galaxies (SFRGs) with starburst-consistent rest-UV spectra. While they were thought to be ULIRGs by their similarities to SMGs (similar radio luminosities, optical spectra, stellar masses), without detection in the far-infrared (FIR), there was no direct evidence that their luminosities were in excess of 1012 L⊙. Ideally, detection at shorter wavelengths in the infrared, at 500 m must be used to confirm a ULIRG’s luminosity in the absence of submm detection; Casey et al. (2009a) used 70 m detection to confirm that a subset of the SFRG population contains a dominating warmer-dust component with = 52 K. While a population of warm-dust ULIRGs has been shown to exist, some fundamental questions still remain unanswered: are warm-dust ULIRGs in a post-SMG AGN heated phase? Could they be triggered by different mechanisms than the major mergers said to give rise to cold-dust SMGs?
Investigating the molecular gas content is fundamental to the characterisation of star formation properties and gas dynamics of a galaxy population. Molecular line transitions from carbon monoxide (CO) are a direct probe of the vast gas reservoirs that are needed to fuel high star formation rates (Frayer et al., 1999; Greve et al., 2005; Tacconi et al., 2006, 2008; Chapman et al., 2008). The gas dynamics which are derived from these observations shed light on galaxies’ evolutionary sequences by measuring how disturbed their gas reservoirs are and how long they can maintain their star formation rates with the observed fuel supply. Recent simulations work hint that a ULIRG phase may be triggered by either major merger interactions (e.g. Narayanan et al., 2009) or from steady bombardment from low mass fragments (e.g. Davé et al., 2010); linking observations with these different evolutionary scenarios is an essential step in understanding galaxy evolution in the early Universe.
In this paper, we present CO molecular gas observations, taken with the IRAM Plateau de Bure Interferometer (PdBI), of twelve SFRGs (and four additional SFRGs from the literature) to compare the population with SMGs and other high redshift star forming galaxies. Section 2 describes the sample selection, molecular gas observations and ancillary data, while section 3 presents our results, in the form of derived gas and star formation quantities of the SFRG sample. Section 4 discusses the gas properties of the sample, compares the population to other high redshift galaxies, and hypothesizes on the role of SFRGs in a broader galaxy evolution context relative to local ULIRGs and SMGs while section 5 concludes. Throughout, we use a CDM cosmology with km s-1 Mpc-1, and (Hinshaw et al., 2009).
2 Observations & Reduction
Our sample is drawn from a set of Jy radio galaxies in the GOODS-N, Lockman Hole, Elais-N2, SSA13 and the UDS fields using the Chapman et al. (2004) selection of submm-faint star forming radio galaxies (SFRGs). They were detected in ultra-deep VLA radio maps (Biggs & Ivison, 2006; Ivison et al., 2002; Ivison et al., 2007; Fomalont et al., 2006) with S15Jy at 3 with an approximate upper limit of S1 mJy since strong AGN and radio-bright local galaxies were removed from the sample. The Jy radio galaxy population was identified in an effort to isolate bright star formers at high redshift, so only the sources with non-AGN photometric redshifts of 1 were included (e.g. Chapman et al., 2003). Spectroscopic follow up with Keck LRIS revealed starburst spectral features (Chapman et al., 2004; Reddy et al., 2006), mostly at redshifts z1. The SFRGs with the most reliable spectroscopic redshifts (often due to a strong Ly- emission peak, 0.005) were chosen for CO observations at the IRAM Plateau de Bure Interferometer.
We note that all galaxies in our sample satisfy the ’active’ galaxy selection criterion (Daddi et al., 2004), and 10/14 satisfy the Dust Obscured Galaxy (DOG) selection (Dey et al., 2008). All SFRGs have poor rest-UV photometry, so their selection with respect to BX/BM (Steidel et al., 2004) is not constrained.
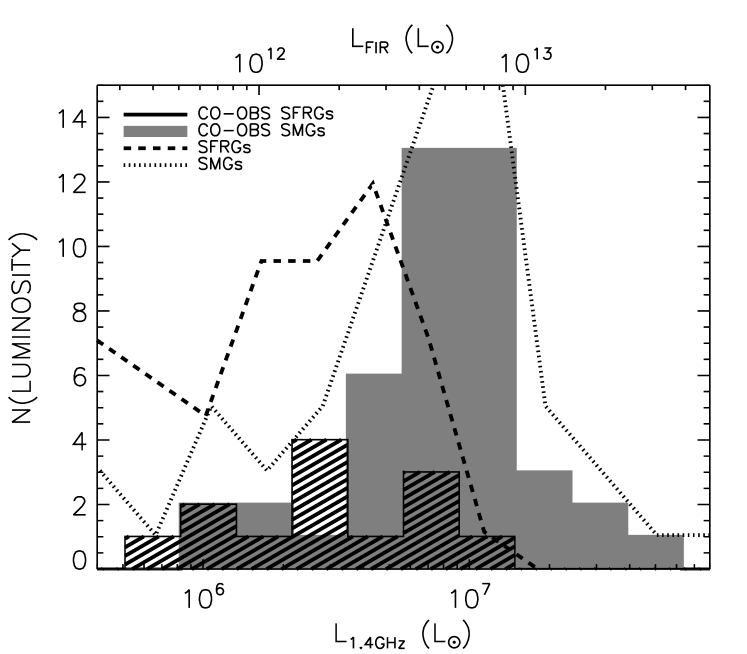
Figure 1 shows the distribution in radio luminosity of the CO-observed SFRG sample relative to the distributions of parent SFRGs, CO-observed SMGs, and parent SMGs. We note that the CO observed sample in this paper is about two times less radio luminous than the CO-observed SMGs which were analyzed in Neri et al. (2003), Greve et al. (2005), and Tacconi et al. (2006)an aspect of their selection which traces back to the removal of more luminous spectroscopic AGN from the SFRG sample. The equivalent class of spectroscopic AGN are not removed from the SMG sample since their detection in the FIR provides sufficient evidence that the SMGs are star-formation dominated. This is likely represents the most dominant selection bias between the populations, however we address more in the discussion in section 4.6. We also discuss the AGN fraction of SFRGs at length in section 4.1. While lower luminosity SMGs have been observed with PdBI (representing the low luminosity tail on the SMGs in Fig 1; Bothwell et al., in preparation), only the published CO observed SMGs are included in this paper for comparison.
2.1 PdBI Observations
Nine SFRGs were observed from June 2008 to October 2008, while three additional sources were observed in August through October of 2009. The mean redshift of the sample is .
| NAME | zopt | Obs. 12CO | BWa | RMSct | RMSch | Bin | Beamsize | S24 | S70 | S350 | S850 | S1200 | S | ||
|---|---|---|---|---|---|---|---|---|---|---|---|---|---|---|---|
| Transition | (GHz) | (GHz) | (mJy) | (mJy) | (MHz) | (″ ″, o) | (mag) | (mJy) | (mJy) | (mJy) | (mJy) | (mJy) | (Jy) | ||
| RGJ021827 | 1.361 | 21 | 97.810 | 0.9 | 0.11 | 0.71 | 20 | 7.14.4, 150o | 24.5 | … | … | … | 3.5 | … | 83.77.0 |
| RGJ105209 | 2.112 | 32 | 111.117 | 1.8 | 0.08 | 0.56 | 40 | 5.13.9, 133o | 25.1 | 16747 | 1.8 | 33 | 4.2 | 1.8 | 34.55.5 |
| RGJ105239 | 1.819 | 21 | 81.780 | 0.9 | 0.10 | 0.65 | 20 | 6.15.1, 98o | 22.8 | 15030 | 6.2 | … | 1.8 | 1.4 | 25.66.2 |
| RGJ123642 | 3.661 | 43 | 98.915 | 1.8 | 0.08 | 0.56 | 40 | 7.63.9, 49o | 25.9 | 15 | 1.9 | … | 3.4 | 0.9 | 20.18.2 |
| RGJ123644 | 2.095 | 32 | 111.727 | 1.6 | 0.10 | 0.66 | 40 | 6.63.6, 46o | 24.2 | 12329 | 1.8 | … | 3.6 | 2.8 | 39.68.7 |
| RGJ123645 | 1.433 | 21 | 94.755 | 1.8 | 0.06 | 0.39 | 40 | 5.04.8, 86o | 23.5 | 17234 | 4.80.4 | … | 10.8 | 1.6 | 83.49.8 |
| RGJ123653 | 1.275 | 21 | 101.335 | 1.8 | 0.08 | 0.56 | 40 | 4.94.0, 75o | 22.7 | 16433 | 6.60.4 | … | 1.2 | 0.7 | 86.78.3 |
| RGJ123707 | 1.489 | 21 | 92.623 | 1.8 | 0.08 | 0.56 | 40 | 6.14.4, 65o | 22.9 | 58863 | 1.7 | … | 3.2 | 1.7 | 24.18.6 |
| RGJ123711 | 1.996 | 43 | 153.885 | 1.8 | 0.09 | 0.60 | 40 | 4.22.7, 53o | 24.2 | 47357 | 1.40.4 | 24 | 2.4 | 4.4 | 126.38.6 |
| RGJ123718 | 1.512 | 21 | 91.775 | 1.8 | 0.06 | 0.39 | 40 | 5.54.4, 80o | 23.1 | 7323 | 1.7 | … | 3.8 | 0.6 | 15.26.8 |
| RGJ131207 | 1.532 | 21 | 91.050 | 0.9 | 0.12 | 0.82 | 20 | 5.84.3, 127o | 24.8 | 10515‡ | … | … | 3.8 | … | 44.92.4 |
| RGJ131208 | 2.237 | 32 | 106.826 | 1.8 | 0.07 | 0.44 | 40 | 4.54.0, 82o | 25.2 | 27914‡ | … | 82 | 3.0 | … | 37.64.0 |
| Lit SFRGs: | |||||||||||||||
| RG J123626a | 1.465 | 21 | 93.525 | 1.8 | 0.09 | 0.78 | 12 | 24.3 | 9426 | 1.7 | … | 7.0 | 1.1 | 37.99.3 | |
| RG J123710a | 1.522 | 21 | 91.411 | 1.8 | 0.10 | 0.87 | 12 | 24.2 | 22739 | 3.90.5 | … | 1.8 | 1.2 | 38.310.1 | |
| ( RG J123711b | 1.996 | 32 | 115.410 | 0.9 | 0.19 | 1.34 | 18 ) | ||||||||
| RG J131236b | 2.224 | 32 | 106.727 | 0.9 | 0.10 | 0.69 | 18 | 24.1 | … | … | … | 2.2 | … | 43.97.1 | |
| RG J163655b | 2.186 | 32 | 108.536 | 1.2 | 0.07 | 0.49 | 20 | 23.5 | 150 | … | 13.76.9 | 2.2 | … | 48.74.3 |
Table Notes. The top 12 sources were observed in our program and the bottom five CO-observed SFRGs are taken from the literature: a from Daddi et al. (2008) and b from Chapman et al. (2008). BWa denotes the bandwidth of observations. Non-detections are 2 upper limits, magnitudes are in AB, and ellipses denote that no data have been taken of that galaxy at the given wavelength (24m, 70m, 350m, and 1200m). RGJ123711 is listed twice, once for its observations taken under our program, and once for the observations discussed in Chapman et al. (2008). The 24m flux densities of the SSA13 field sources are marked by ‡: they are derived from IRS spectral observations since no MIPS imaging exists for this field (Casey et al., in preparation). The RMSct is the noise of the CO observations averaged over the bandwidth of observations (also over one beamsize at phase centre), while RMSch is the noise per frequency channel which has width with size Bin, in MHz. The frequency bins are chosen for optimum presentation of the spectra, as shown in Figure 3 and are based on bandwidth. The uncertainties on the radio flux densities are errors on flux integrated measurements and not statistical errors. RGJ021827 was targeted at a redshift of 1.357, which is the redshift of a nearby source; the correct UV spectroscopic redshift is 1.361, which is within the bandwidth of our CO observations. RGJ163655 has an H redshift of 2.192 and a UV redshift of 2.186, both within the bandwidth of the literature observations. The redshift for RGJ131236 has been corrected from earlier measurement of 2.240. Its CO observations were taken at 2.240, so unfortunately the CO[3-2] line at 2.224 falls at the edge of the PdBI bandwidth, which makes it difficult to put constraining limits on its CO emission.
CO Observations were carried out with PdBI in the 5 dish D-configuration (i.e. compact). We used the 2 mm and 3 mm receivers tuned to the appropriate frequencies of redshifted CO transitions, as detailed in Table 1. Pointing centres were at the VLA positions of the galaxies, and example phase calibrators which we used were 0221+067, 1044+719, 1418+546, 1308+326, and 0954+658 with flux calibrators like MWC349, 3C84, and 3C345. The synthesised beam size for the configuration varies from 3-6″ FWHM. Receiver Noise Temperature calibration was obtained every 12 min using the standard hot/cold–load absorber measurements. The antenna gains were found to be consistent with a standard range of values from 24-31 Jy K-1. We estimate the flux density scales to be accurate to about %.
Data were recorded using both polarisations, offset in frequency, covering a 1.8 GHz bandwidth, except in the case of RGJ021827, RGJ131207, and RGJ105239 which had 0.9 GHz bandwidth coverage (overlapping polarisations), and RGJ123644 which had 1.6 GHz coverage (semi overlapping polarisations). RGJ123644 had an uncertain spectroscopic redshift and upon initial observations with a 0.9 GHz bandwidth, a feature was identified at the edge of the bandwidth and subsequent observations were shifted in redshift, thus totaling 1.6 GHz coverage. The total on-source integration time varied between 4-12 hours. The data were processed using the GILDAS packages CLIC and MAPPING and analyzed with our own IDL-based routines. The RMS noise of each object’s map is also given in Table 1. For clarity of presentation, we have re-gridded the data to a spectral resolution of 40 MHz for data with 1.5GHz bandwidth and to 20 MHz for data with 1.5GHz bandwidth. The bandwidths, binsizes and noise properties of the maps are given in Table 1.
The search for CO line detection was performed by integrating over all possible combination of channels at every location in the observed maps using our own iterative GILDAS script. From the result we measure the data’s signal to noise ratio (S/N) at all points in the map, and subsequently investigate signal peaks greater than 4. If a detection with signal strength 4 exists within 5″ of the target position, the observed galaxy is classified as detected.
2.1.1 Offset CO Detections
Searching for detections within a 5″ radius imply that significant positional offsets are acceptable. In our galaxies, only three of our sources, RGJ021827, RGJ105209, and RGJ105239), have offsets 2″. Nominally, an offset 2″ would be too large to attribute to the targeted source, however we note a few factors which can increase the positional uncertainty to 5″. PdBI D-configuration positional uncertainty is governed by the source S/N (which is proportional to beamsize/2(S/N), 1″, but might diverge at small S/N), the baseline model uncertainty (0.25″ for D-config), and the quality of phase calibration (which can translate to 1.5-3″ seeing). Since the S/N of these galaxies is small, then the nominal uncertainty likely increases from 2″to 3″. It is also possible for the bulk of the gas reservoir in a system to be offset from the primary source of starlight, especially in the case of major mergers. In addition, we have found large positional offsets 5″ with strong 5 CO detections in the larger samples of SMGs (i.e. CO positional offset from radio centroid, Smail & Bothwell, private communication). Since these detections are centred on the correct redshifts and there does not seem to be other radio/UV/IR sources corresponding with their positions, we treat RGJ021827, RGJ105209, and RGJ105239 as detected; however, we label their spectra and CO maps as ‘OFFSET’ and list them separately in Table 2, both as tentatively detected and as undetected, giving the upper limits for phase center observations. We plot them in subsequent figures as detected, although mark them with different symbols to indicate exclusion from key calculations in our analysis.
2.1.2 Remarks on Individual Sources
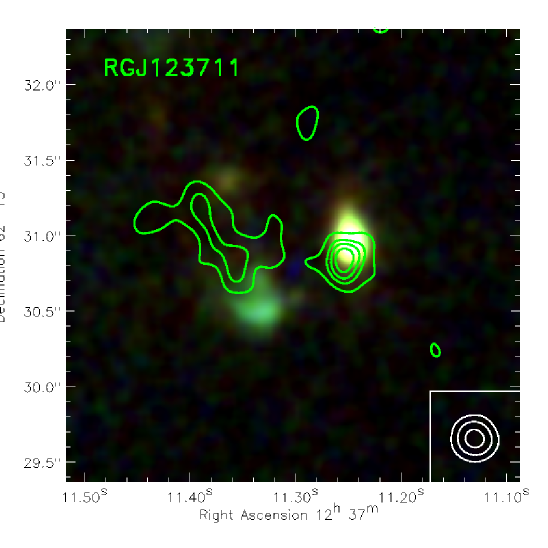
RGJ163655, RGJ131236, and 12CO(=32) RGJ123711 are taken from Chapman et al. (2008), the pilot study for the sample observed in this paper. These data, when presented in this paper, are different from the spectra and maps presented in Chapman et al. due to a different reduction. We decided to re-reduce their data to be consistent with our reduction, making significant improvements in both phase and amplitude calibration. The differences do not change the results of Chapman et al., but a few changes in minor conclusions are noted later on in the results and discussion. The Chapman et al. CO observations of RGJ131236 were carried out assuming 2.240 however more recent rest-UV spectroscopic observations indicate a different rest-UV redshift, 2.224. The final channel in the data cube might suggest a flux excess at the correct redshift, although we cannot distinguish between a bright line cutoff at the edge, a broad faint line, continuum, or noise spike. We treat this source as undetected with the associated noise properties of our observations. We also note that RGJ123711 was observed as part of Chapman et al. (2008) in 12CO(=32), but newer, higher S/N observations in 12CO(=43) were taken as part of this program. For comparison, we include the Chapman et al. results in Tables 1 and 2. In the re-reduction of RGJ163655 observations, we find a possible companion CO source at the same redshift offset by 8″ to the northwest which is not seen in the Chapman et al. results, however significant improvements on phase and amplitude calibration have been made since. This source is discussed briefly in section 3.1. The new data taken for RGJ123711 reveals a marginal 12CO(=43) detection for the SMG SMM J123711.98+621325.7 (also called HDF 255); its integrated CO flux (detected at 4.5) is 0.540.12 Jy km s-1; its spectrum and properties will be discussed more at length in a paper summarising CO properties of observed SMGs to date (Bothwell et al. in preparation).
2.2 Archival Observations
This paper also includes the CO-observations of two additional SFRGs from the literature. Daddi et al. (2008) analyzed RGJ123710 and RGJ123626 as being high redshift normal spiral galaxies which have very low star formation efficiencies (a study expanded upon in Daddi et al., 2010). The active galaxies which Daddi et al. survey have significant overlap with the SFRG population, since their CO sources require radio detection, thus they have ULIRG luminosities implied from the radio. Both RGJ123710 and RGJ123626 are selected as SFRGs via the Chapman et al. (2004) method and are likely very-luminous star formers, with higher SFRs than most active s. RGJ123710 has also been detected at 70m (Casey et al., 2009a), directly confirming that it is a ULIRG with a warm dust temperature. Interpreting the active galaxy population as ULIRGs rather than “high- normal spirals” is perhaps sensible for these reasons.
| NAME | zoptical | zCO | Obs. | S/N | ICO | L | ICO(1-0) | L | |
|---|---|---|---|---|---|---|---|---|---|
| Transition | (Jy km s-1) | (K km s-1 pc2) | (Jy km s-1) | (K km s-1 pc2) | (km s-1) | ||||
| CO-Detected SFRGs: | |||||||||
| RGJ123626.53+620835.3 | 1.465 | 1.4650.002 | 12CO(=21) | 6.8 | 0.600.09 | (1.70.3)1010 | 0.200.10 | (2.30.3)1010 | 350 |
| RGJ123644.13+621450.7 | 2.095 | 2.0900.001 | 12CO(=32) | 4.3 | 0.790.22 | (1.90.5)1010 | 0.120.03 | (2.50.7)1010 | 214132 |
| RGJ123645.88+620754.2 | 1.433 | 1.4340.001 | 12CO(=21) | 4.1 | 0.640.17 | (1.80.5)1010 | 0.220.06 | (2.40.6)1010 | 320144 |
| RGJ123710.60+622234.6 | 1.522 | 1.5220.002 | 12CO(=21) | 8.9 | 0.850.10 | (2.50.3)1010 | 0.280.08 | (3.30.3)1010 | 250 |
| RGJ123711.34+621331.0 | 1.996 | 1.9880.002 | 12CO(=43) | 6.5 | 1.020.16 | (1.30.2)1010 | 0.100.02 | (2.00.4)1010 | 558121 |
| 1.9960.002 | 12CO(=43) | 7.3 | 0.610.08 | (7.81.1)109 | 0.060.01 | (1.20.1)1010 | 31886 | ||
| COMBINED: | 12CO(=43) | 10.4 | 1.870.18 | (2.40.2)1010 | 0.190.02 | (3.70.4)1010 | (1400100) | ||
| (RGJ123711.34+621331.0 | 1.996 | 1.995 | 12CO(=32) | 3.2 | 0.700.22 | (1.50.5)1010 | 0.100.03 | (2.00.6)1010) | … |
| RGJ131208.34+424144.4 | 2.237 | 2.2370.001 | 12CO(=32) | 5.6 | 0.880.15 | (2.40.5)1010 | 0.130.02 | (3.30.6)1010 | 43984 |
| RGJ163655.04+410432.0 | 2.186 | 2.1870.002 | 12CO(=32) | 4.9 | 0.290.06 | (7.81.6)109 | 0.040.01 | (1.00.2)1010 | 25240 |
| Offset-CO SFRGs: | |||||||||
| (as detections) | |||||||||
| RGJ021827.35–050055.9 | 1.361 | 1.3620.002 | 12CO(=21) | 4.2 | 0.440.10 | (1.10.2)1010 | 0.150.04 | (1.50.3)1010 | 557107 |
| RGJ105209.31+572202.8 | 2.112 | 2.1130.001 | 12CO(=32) | 4.6 | 1.120.25 | (2.80.6)1010 | 0.170.04 | (3.70.7)1010 | 44685 |
| RGJ105239.84+572509.1 | 1.819 | 1.8200.001 | 12CO(=21) | 4.7 | 0.570.12 | (2.50.5)1010 | 0.190.04 | (3.30.7)1010 | 498157 |
| (as non-detections) | |||||||||
| RGJ021827.35–050055.9 | 1.361 | … | 12CO(=21) | … | 0.20 | 4.9109 | 0.07 | 6.5109 | … |
| RGJ105209.31+572202.8 | 2.112 | … | 12CO(=32) | … | 0.21 | 5.1109 | 0.03 | 6.9109 | … |
| RGJ105239.84+572509.1 | 1.819 | … | 12CO(=21) | … | 0.20 | 8.5109 | 0.07 | 1.11010 | … |
| CO-Undetected SFRGs: | |||||||||
| RGJ123642.96+620958.1 | 3.661 | … | 12CO(=43) | … | 0.22 | 7.8109 | 0.02 | 1.31010 | … |
| RGJ123653.37+621139.6 | 1.275 | … | 12CO(=21) | … | 0.22 | 4.7109 | 0.07 | 6.2109 | … |
| RGJ123707.82+621057.6 | 1.489 | … | 12CO(=21) | … | 0.23 | 6.7109 | 0.08 | 8.9109 | … |
| RGJ123718.58+621315.0 | 1.512 | … | 12CO(=21) | … | 0.15 | 4.7109 | 0.05 | 6.3109 | … |
| RGJ131207.74+423945.0 | 1.532 | … | 12CO(=21) | … | 0.24 | 7.3109 | 0.08 | 9.8109 | … |
| RGJ131236.01+424044.1 | 2.224 | … | 12CO(=32) | … | 0.18 | 4.7109 | 0.03 | 6.3109 | … |
Table Notes. The observed CO properties of the sample. The top seven sources have clean 4 detections of CO at phase center, the next three sources (labeled ’Offset’) have CO detections at the correct redshift but offset 3-5″ from phase center, and the remaining six sources are undetected in CO. and ICO are given for the observed CO transition, which does not depend on source excitation. Then assuming the Weiss et al. (2007) SMG excitation ladder (see text for description), we convert to and , which is given in the subsequent columns. is the FWHM of the fitted feature shown in Fig. 2. The SFRG with a double peaked feature (RGJ123711) has the details of each feature listed separately. ICO 2- limits for undetected SFRGs are calculated assuming a = 320 km s-1 (the mean FWHM of the detected-SFRG sample).
2.3 Multiwavelength Data
Radio fluxes from VLA B-array maps (5″ resolution) are taken from Richards (2000) and Morrison et al. (2008), where the uncertainty represents the error in the extracted flux measurement rather than statistical error. High-resolution observations from the Multi-Element Radio Linked Interferometer Network (MERLIN; Thomasson, 1986) were obtained for the sources in GOODS-N as described in Muxlow et al. (2005), and a combined MERLIN+VLA map was constructed with an RMS noise of 4.0 Jy beam-1. A similar map was constructed in Lockman Hole with an RMS noise of 4.5 Jy beam-1 (Biggs & Ivison, 2008). The combined MERLIN+VLA maps have positional accuracies of tens of mas and restoring circular beam sizes of 0.4″ (GOODS-N) and 0.5″(Lockman Hole).
RGJ105209, RGJ123711 and RGJ131208 were all observed at 350m with the SHARC2 camera (Dowell et al., 2003) on the Caltech Submillimeter Observatory and reduced with CRUSH software (Kovács et al., 2006). With on-source integration times of 950s, 1080s and 200s, RGJ105209, RGJ123711 and RGJ131208 were have flux densities of 197 mJy, 69 mJy, and 4817 mJy respectively. A fourth SFRG, RGJ163655, was observed at 350m with the CSO previously (Chapman et al., 2008). None are detected at 3. While the acquisition of ground-based 350 m observations is laborious and dependent on the best weather conditions (0.06, measured at 225 GHz), the relative depth of our observations is comparable to expected confusion limits for the Herschel Space Observatory at 350 m. While Herschel will detect 40 mJy 350 m sources at high- regularly, sources with flux density 20 mJy will need follow up from ground-based facilities like the CSO for more precise flux density estimates and better SED constraints.
The 1200m flux limits for GOODS-N and Lockman Hole come from the Max-Planck Millimeter Bolometer (MAMBO, with a mean RMS of 0.8 mJy; Greve et al., 2008) and 850m flux limits from the Submm Common User Bolometric Array (SCUBA, with a mean RMS of 1.6 mJy; Borys et al., 2003; Coppin et al., 2006). All fields are covered with IRAC (3.6, 4.5, 5.8, and 8.0m) and MIPS (24 and 70m), however at greatest depths in all bands in GOODS-N. Optical photometry in GOODS-N is from the ACS111Based on observations made with the NASA/ESA Hubble Space Telescope, and obtained from the Hubble Legacy Archive, which is a collaboration between the Space Telescope Science Institute (STScI/NASA), the Space Telescope European Coordinating Facility (STECF/ESA) and the Canadian Astronomy Data Centre (CADC/NRC/CSA). using the F435W, F606W, F814W, and F850LP filters (B, V, i and z bands). The Lockman Hole has ACS F814W (PI: Chapman HST 7057) in addition to extensive optical photometry from Subaru/Suprime-Cam (Miyazaki et al., 2002). X-ray fluxes are measured from the Chandra/XMM maps of GOODS-N (Alexander et al., 2003), Lockman Hole (Brunner et al., 2008), SSA13 (Mushotzky et al., 2000), and SXDF (Ueda et al., 2008).
2.4 RGJ105209
Recent work on mid-infrared spectra of SFRGs from the Spitzer InfraRed Spectrograph (IRS) (Casey et al., in preparation) has revealed that the 24m source that lies at the position of RGJ105209 (at the radio position) has a dominant PAH redshift of 2.37, in contrast to the CO and UV spectroscopic redshift of 2.112. We suspect that two different systems overlap to create these discrepant redshifts, but note that only one source is visible in the rest-UV. The high-resolution MERLIN+VLA radio imaging also shows only one point source slightly offset 1.2″ from the UV source. Due to positional uncertainties, it is difficult to pinpoint which source is generating the radio emission. For that reason, we assume in this paper that the radio is associated with the 2.112 CO source. We note that similar positional overlap phenomena have occurred with star forming galaxies before, for example there are several examples of sources with two distinct redshifts for one continuum source in the surveys of Steidel et al. (2004) and Reddy et al. (2006, 2008), and the density of bright star forming z2 sources is high enough that overlap will occur with non-negligible probability.
3 Analysis and Results
3.1 Derived Properties from CO Data
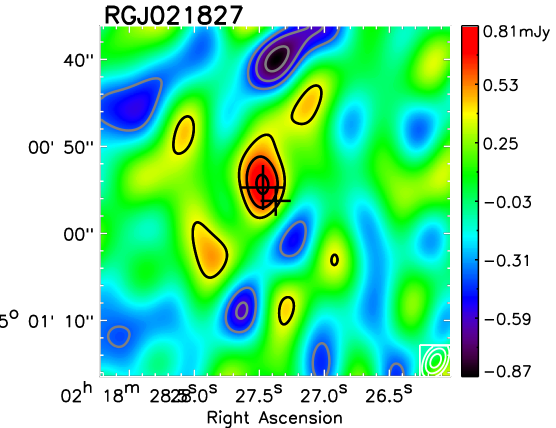
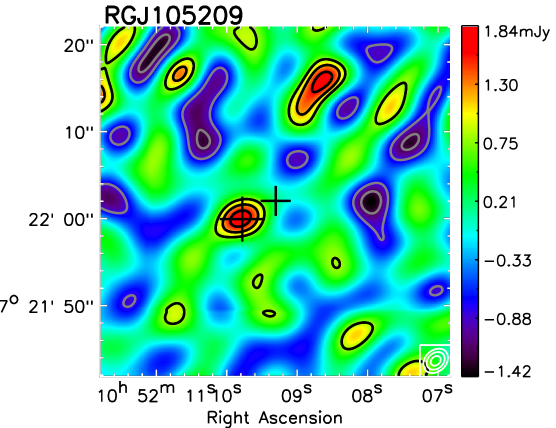
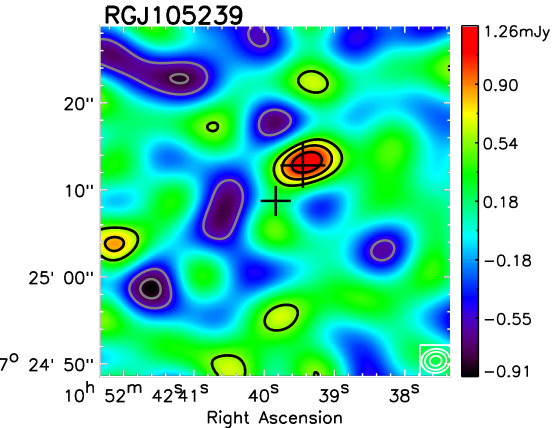
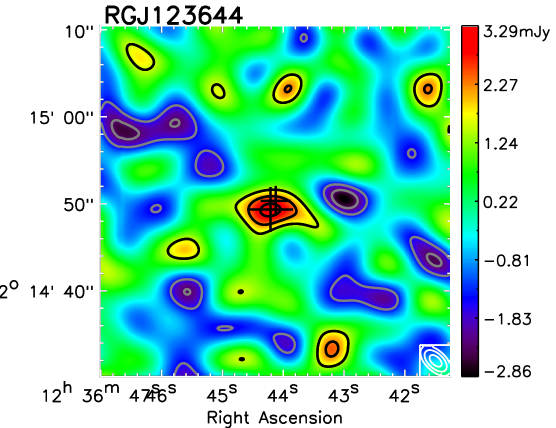
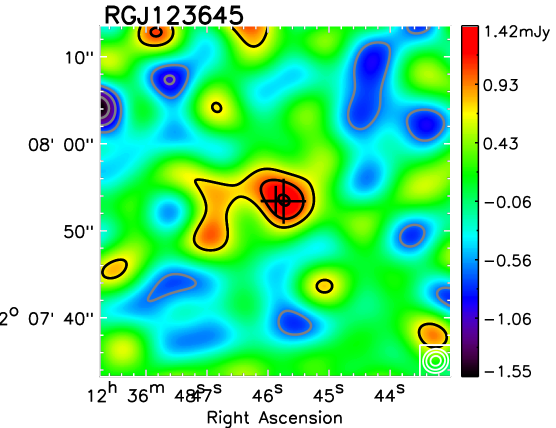
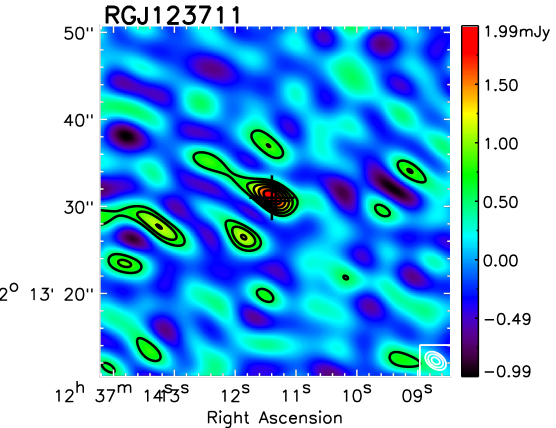
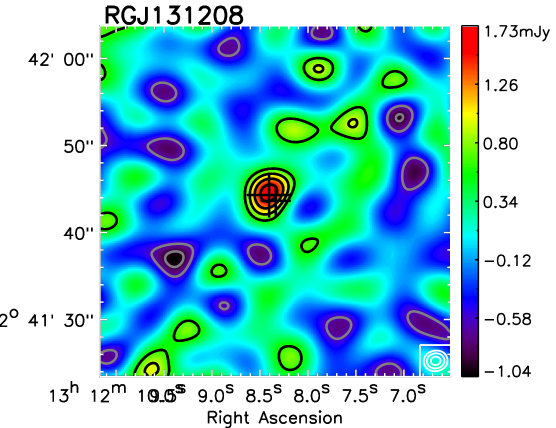
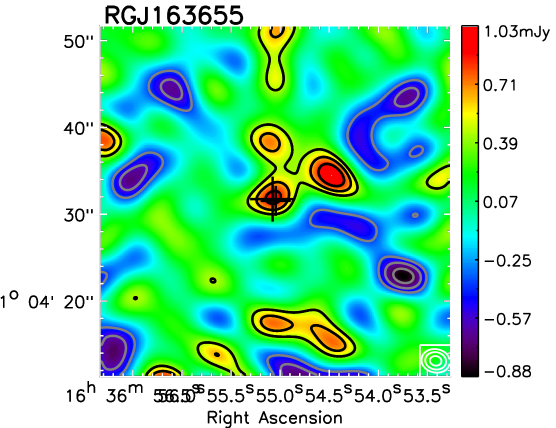
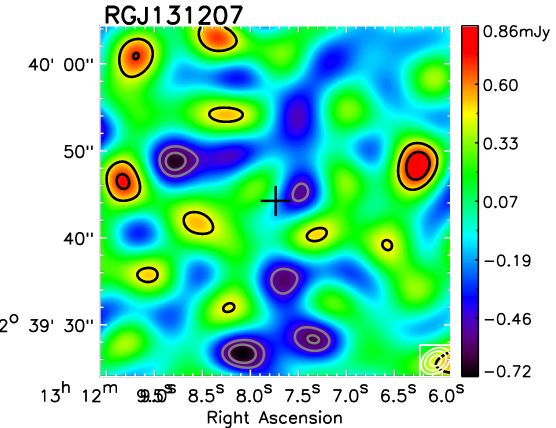
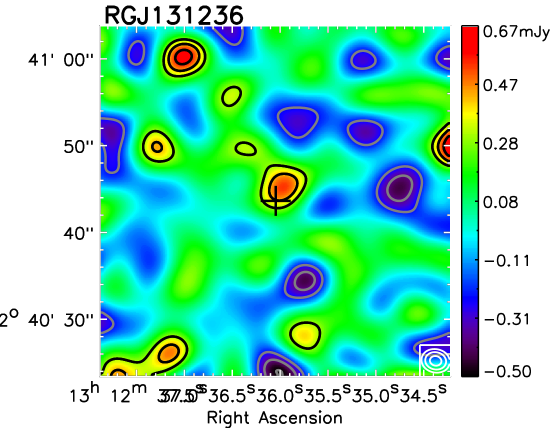
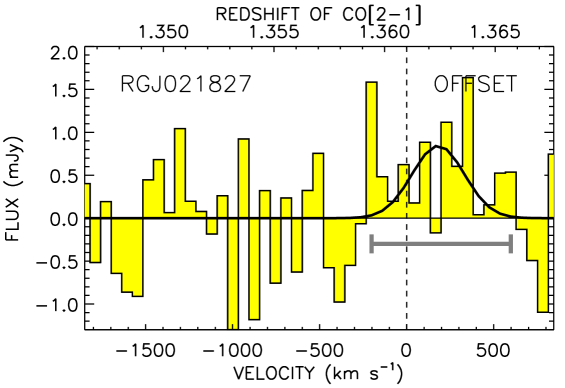
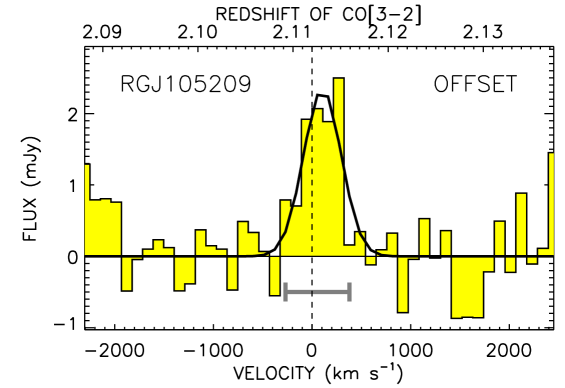
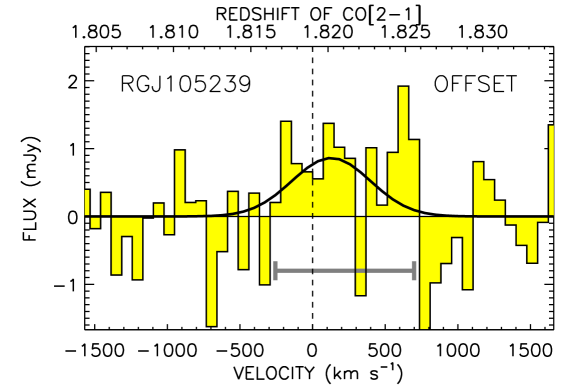
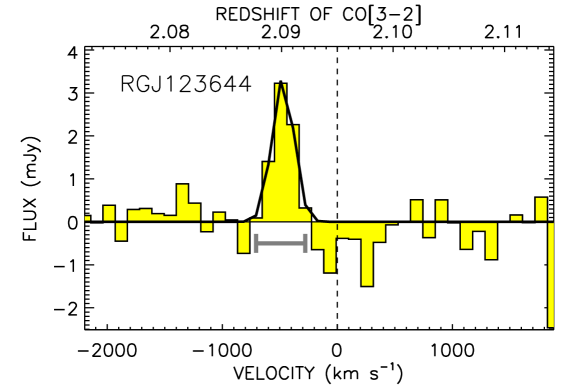
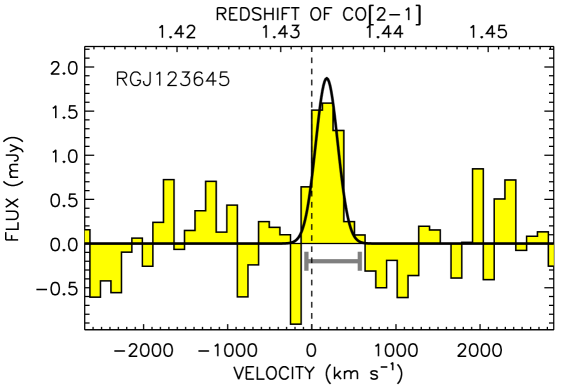
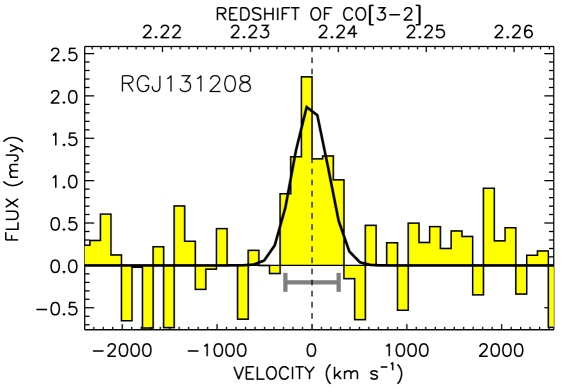
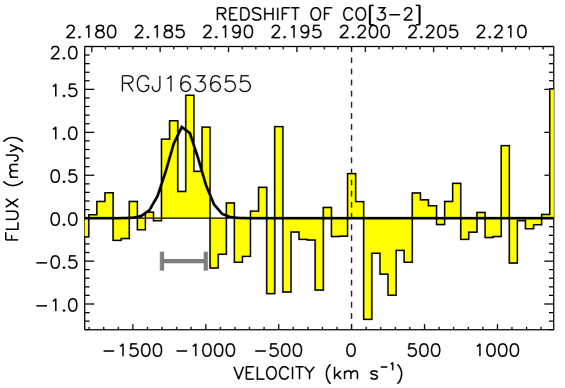
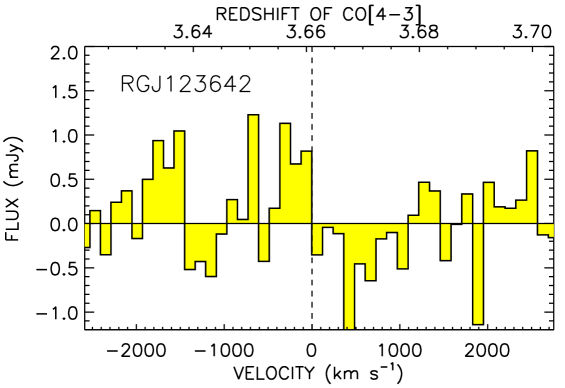
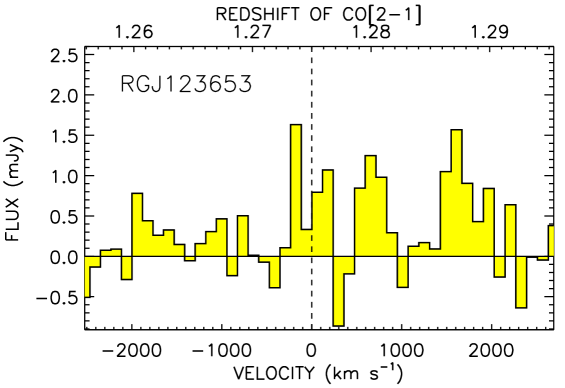
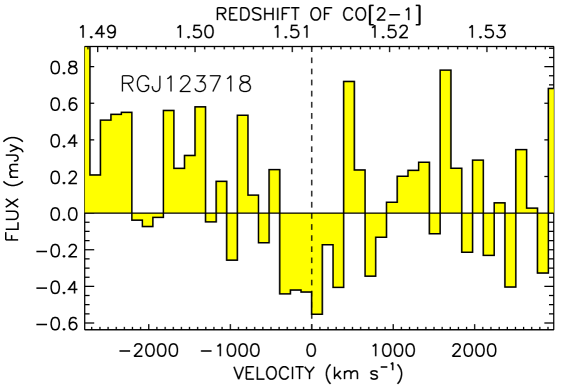
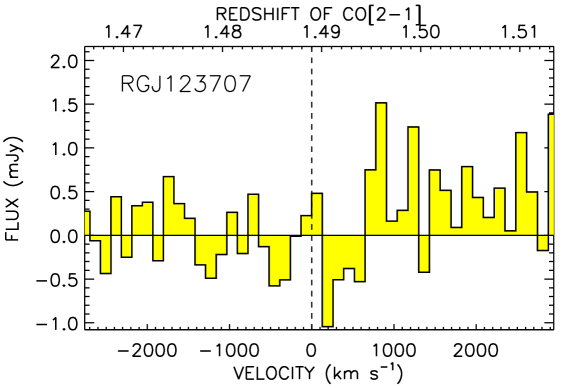
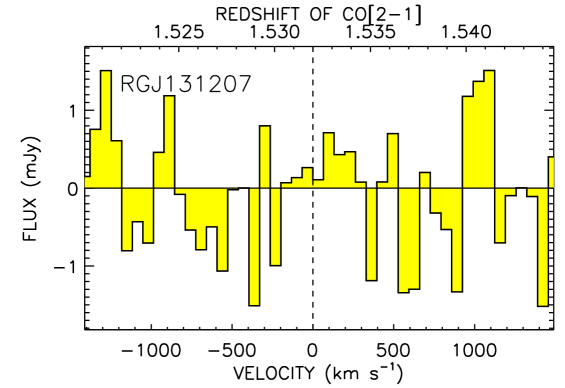
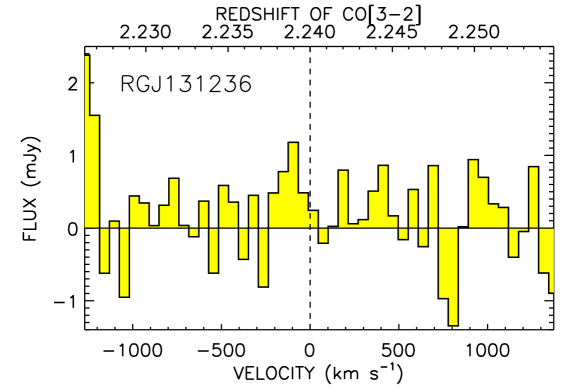
Table 2 lists the integrated line fluxes and limits for all SFRGs in our sample. Out of the twelve sources in our observing program, seven SFRGs were detected at 4. Including the literature SFRGs, 10/16 are CO detected, and one ‘undetected source’ has insufficient data to determine detection (RGJ131236, with an ambiguous redshift). Three of our detected sources have significant positional offsets from their radio positions, thus we have classified these as ‘tentative’ detections in Table 2 and excluded them from calculations in our analysis. The detection fraction of SFRGs, 10/16 (63%, including offset sources), is similar to the detection fraction of SMGs in Greve et al. (2005) and Coppin et al. (2008).
While we do not expect continuum flux from any SFRGs, we test for it based on FIR detection limits. To test the detectability of blackbody continuum radiation, we interpolate the best fit FIR SEDs (see section 3.6) to estimate the flux density at the frequency of PdBI observations (GHz). All SFRGs in the sample have estimated continuum flux densities 0.13 mJy, which is of order the RMS noise in our CO spectra, thus not detectable.
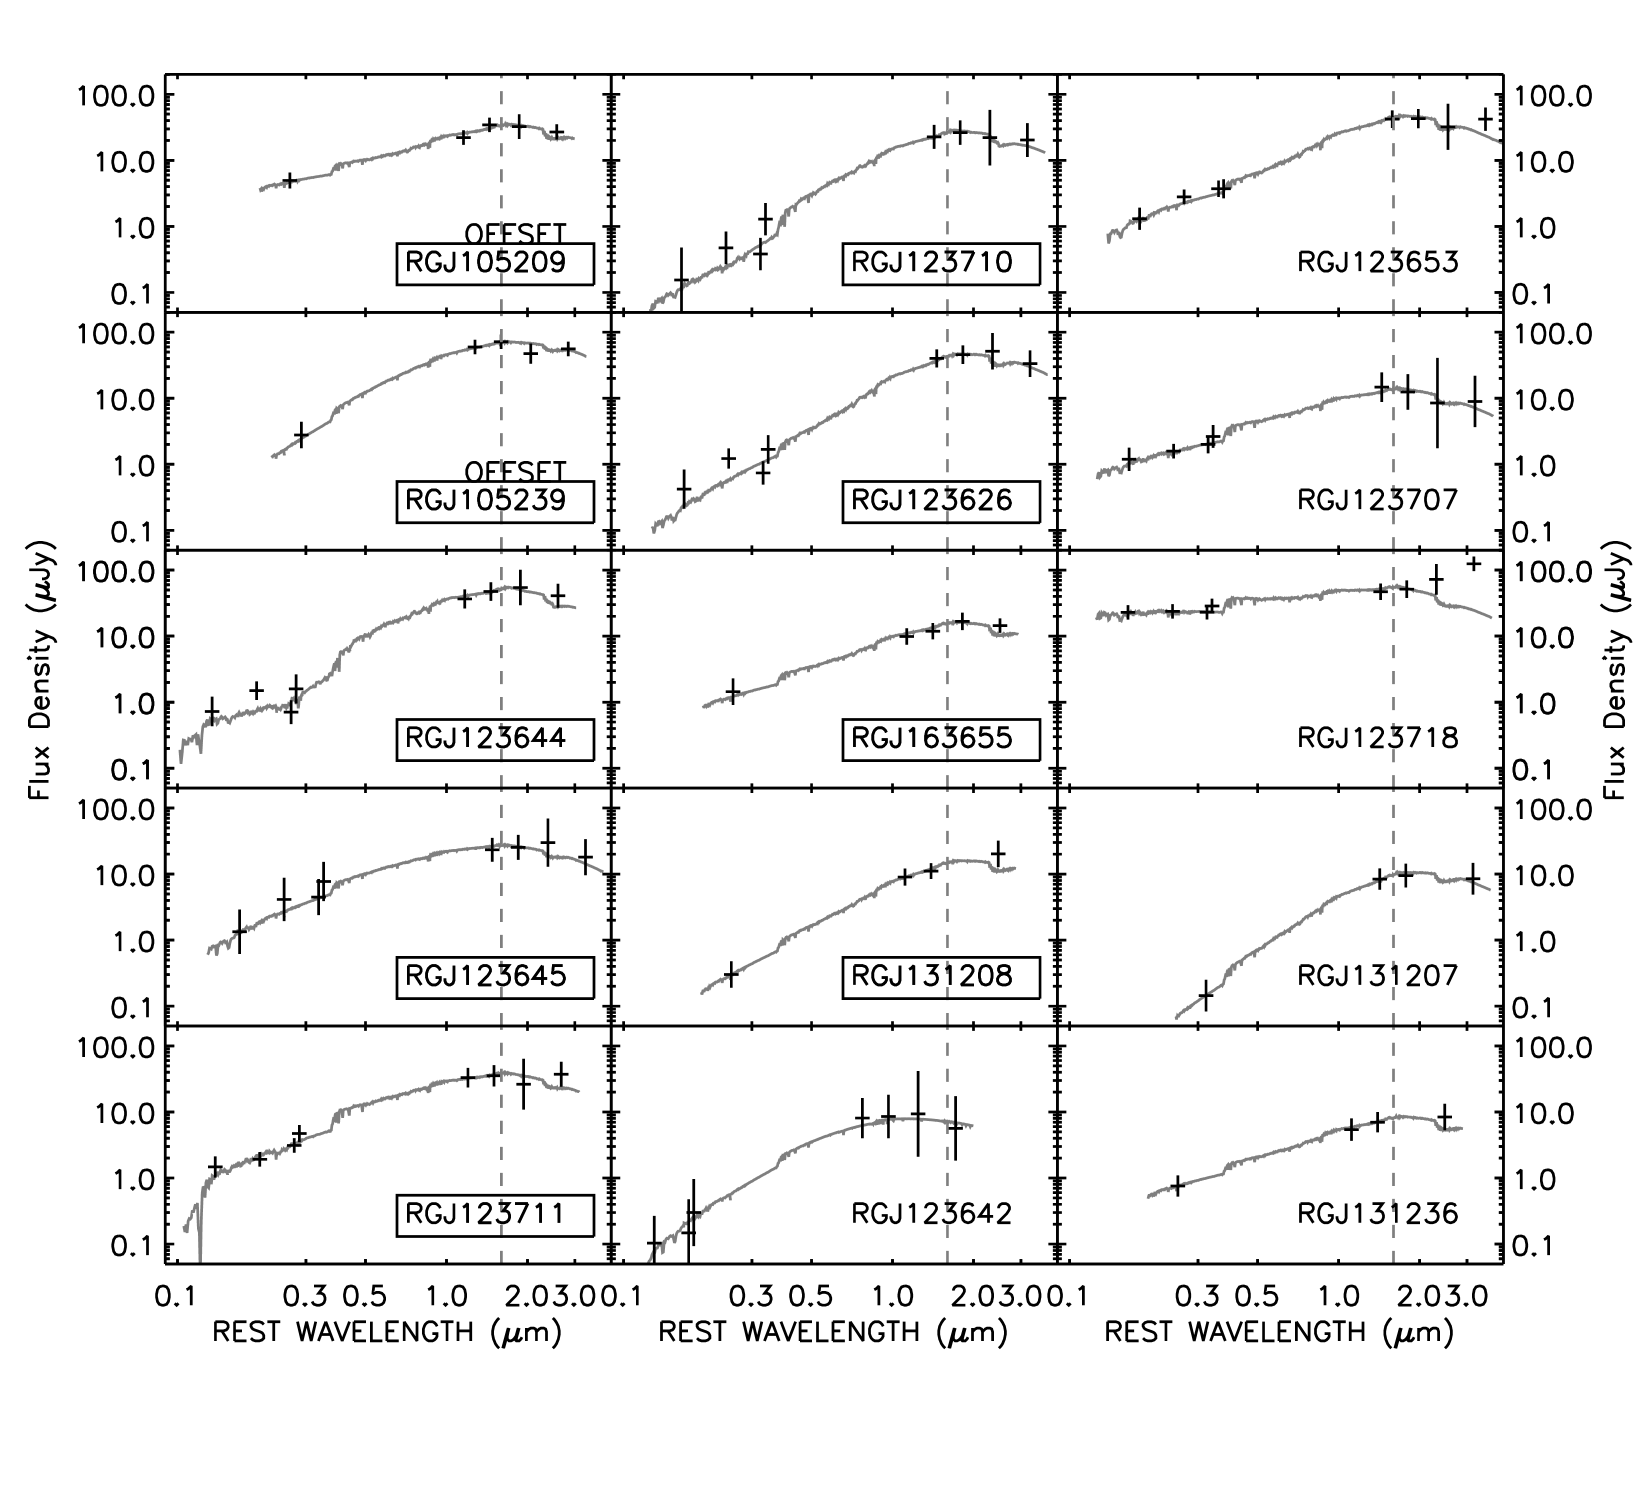
Each remaining SFRG spectrum was fit with a three parameter Gaussian using a least squares fitting algorithm, where the spectral noise is simulated as a function of the RMS channel noise (see Coppin et al., 2007, for details). Since no detectable continuum emission is expected we do not fit line profiles with constant baselines. Figure 2 shows the velocity-averaged spatial maps of the mm line observations (with VLA centroids marked with crosses) and Figure 3 shows the extracted spectra of the CO detections with overlaid Gaussian fits and the original optical spectroscopic redshifts. The 2D maps for CO-detected SFRGs are integrated over the channel range which produces the highest signal to noise line profile in the spectrum. The 2D maps of the undetected sample are integrated over all velocity channels. CO detected SFRGs have CO redshifts which agree with their optical spectroscopic features. Every spectrum was also tested against two three-parameter Gaussian fits (i.e. a double peaked line) in a squared goodness of fit algorithm. Only one galaxy’s line fits were significantly improved by fitting to a double peaked Gaussian. The detection of RGJ123711 is double peaked with one component centred at zCO = 1.988 and another at zCO = 1.996 which bracket its optical redshift ( 1.995). The line properties of both components of RGJ123711 are listed separately in Table 2; the total system is represented by the sum of the two separate gas masses and sum of dynamical masses (we treat them as separate systems since the peaks are asymmetrical and more likely indicative of a merger than rotating disk). The ratio for double-peaked CO in SFRGs is thus 1/8 13%, comparable to 5/30 17% for SMGs. The weighted mean line width of this sample, excluding ‘offset’ detections is 32080 km s-1(note that it increases to 370110 km s-1if the offset sources are detections).
The 2 line intensity limits for the CO-undetected SFRGs are calculated using the following:
| (1) |
where is the channel noise from Table 1, and is the spectral resolution, the binsize value given in Table 1 converted to km s-1 (as in Boselli et al., 2002). These limits are given in Table 2. The spatial maps for the undetected SFRGs (in Figure 2) are integrated over the entire bandwidth of observations. None of the maps are corrected for primary beam attenuation; given the 4040″ size, the PBA correction is 2 even for all peripheral areas of the map.
The spatial map for RGJ163655 shows another bright companion CO emitter 8″ to the northwest of RGJ163655 not previously identified in the reduction of Chapman et al. 2008. Extraction of its spectrum reveals a line centred on the same frequency as the RGJ163655 12CO(=32) line, however there are no radio sources or spectroscopically identified sources nearby. If followup CO observations of RGJ163655 reveal the same feature in different CO transitions, then high resolution CO will be needed to precisely measure the companion galaxy’s position, and thus its multi-wavelength properties.
A lack of multiple CO transition data has meant that many past studies have relied on the assumption of constant brightness temperature to convert between higher transition line luminosities and L. However, recent observations of multiple CO transitions in high redshift galaxies has shown that the transitions are often not in thermal equilibrium (Dannerbauer et al., 2009). The three SMGs of Weiss et al. (2007) are consistent with being in thermal equilibrium up to a J=3 transition yet not towards higher-J values, while there are several other high redshift sources which are much more excited, for example, FSC 10214+4724 (Scoville et al., 1995) and APM 08279+5255 (Weiß et al., 2007) which have nearly constant brightness temperatures out to J=6) or much less excited (ERO J16450+4626 turns over at CO(3-2)). In this paper we adopt the brightness temperature conversions inferred from the spectral line energy distributions for three SMGs observed in Weiss et al. (2007); explicitly, we assume the following line flux ratios derived from LVG models: SCO21/SCO10 = 3.00.1, SCO32/SCO10 = 6.80.5 and SCO43/SCO10 = 10.00.8. One SFRG has multiple line data (RGJ123711) and can be analyzed for its excitation. This work is presented in section 3.2.
More recent work (Ivison et al., 2010c; Danielson et al., 2010) on 12CO(=10) observations in SMGs show that the assumption of a constant brightness temperature can lead to underestimations of gas mass by factors of 2. They find that the ratio of luminosities between 12CO(=32) and 12CO(=10) is 0.55 and 0.67 respectively. Our excitation assumption implies a ratio 0.78, slightly higher than these recent studies, but well within the uncertainties of the measurements of Ivison et al. and Danielson et al.. The derived line luminosities for our observations are listed in Table 2, in their observed transition as well as in our conversion to L.
3.2 CO Excitation of RGJ123711
The observations of RGJ123711 in 12CO(=32) and 12CO(=43) allow an analysis of the CO excitation in the system. Figure 4 shows the spectrum of both lines and the proposed CO spectral line energy distribution (SLED) for the source; since the 12CO(=32) observations do not cover the entire velocity range of the emitting gas, a direct comparison of the line strengths can only be done in the channels where data overlap (between -700 and 300 km s-1) marked by vertical dashed lines in Figure 4. The ratio of fluxes is then SCO[4-3]/SCO[3-2] = 1.60.4. We use Monte Carlo testing to estimate the added uncertainty introduced by not including the missing portion of 12CO(=32) (from -1150 to -700 km s-1) and we remeasure this ratio to be SCO[4-3]/SCO[3-2] = 2.00.8. This agrees with the mean [4–3]/[3–2] ratio observed for SMGs, 1.40.2 (Weiss et al., 2007) and the expected ratio if constant brightness temperature is assumed, 1.8, however it appears to be inconsistent with the ratio for the Milky Way, 0.7 (Fixsen et al., 1999).
We contrast this result with those of Weiss et al. (2007), Dannerbauer et al. (2009), and Danielson et al. (2010) in the right panel of Fig. 4. Although we have taken measurements for 3 and 4 only and other work is restricted to 3 transitions, we see that RGJ123626 and RGJ123711, the two SFRGs included here, seem to exhibit different excitation levels where RGJ123626 is more consistent with Milky Way type excitation and RGJ123711 is consistent with the Weiss et al. (2007) SMGs. The issue of gas excitation is essential to the physical interpretation of high- star formers, and more/multiple line transitions are necessary for a full analysis of the population (e.g. see recent work on low CO transitions, like 12CO(=10) in Riechers et al., 2006; Hainline et al., 2006; Ivison et al., 2010c; Carilli et al., 2010).
3.3 Gas Mass and Dynamical Mass
To derive H2 masses we assume the ULIRG H2/CO gas conversion factor 0.8 M⊙ (K km s-1 pc2)-1 from Downes & Solomon (1998). It is worth noting, however, that the CO to H2 conversion factor varies substantially depending on the type of source being sampled, and it can range from 0.8 in ULIRGs to 4-5 in normal spiral, late-type galaxies (see discussion in the Appendix of Tacconi et al., 2008). The basis of our choice of 0.8 M⊙ (K km s-1 pc2)-1 is based on the merger, or disturbed nature of ULIRGs and their high star formation rates. Mergers are confined by ram pressure which pervades the whole system, while quiescent discs are confined gravitationally leading to gas fragmenting into clouds (per the jeans mass) and thus much higher ratios of H2 mass to unit CO. We note that higher gas conversion factors are possible and perhaps likely if SFRGs were to represent an intermediate stage or ‘less extreme’ population of galaxies than SMGs. For this reason, we advise that our H2-dependent quantities (like , gas fraction, etc) be taken with a hint of caution, since the full range of galaxy properties and conversion factors (from 0.8–4.5) suggest variations of of order 0.75 dex and variations of gas fractions of order 0.6. We also include gas mass estimates for 4.5 M⊙ (K km s-1 pc2)-1 for contrast in Table 3 but proceed with =0.8 for our analysis. Using XCO=0.8 for ULIRGs, the mean gas mass of the sample is (2.10.7)1010 M⊙, which is roughly half the mean H2 mass of CO-observed SMGs (5.11010 M⊙; Greve et al., 2005; Neri et al., 2003).
Dynamical mass is dependent on the galaxy’s inclination angle; we use the average inclination correction of 1/2 (in other words = 30o, corresponding to a random distribution in galaxy angles between 0 and 90o). Thus
| (2) |
where 4 (the value adopted for mergers; Genzel et al., 2003) and is given in kpc and in km s-1. We note however that the difference between assuming a merger (), spheroid (), or rotating disk () is on the order of the uncertainty in M caused by uncertainty in line width.
Deriving a dynamical mass is dependent on a resolved spatial size measurement ( in Eq 2), which is unfortunately unavailable with this low resolution, 3-6″ beam size (D-configuration PdBI) data. In place of measuring CO sizes explicitly, we assume that the SFRGs of this sample have gas emitting regions roughly the size of SMGs (Tacconi et al., 2008) which have 21 kpc. This is supported by our analysis of high-resolution MERLIN+VLA radio imaging discussed in the next section (in section 3.4), where SFRGs and SMGs are shown to have similar radio sizes and SFRG sizes average to 2.30.8 kpc. Bothwell et al. (2010) have taken high-resolution CO observations of RGJ123711 and found its size to be consistent with this assumption (its CO emission extends over 12.6kpc in one direction and 5kpc in the other, corresponding to a 3.9kpc effective radius, only 0.2kpc larger than our measured MERLIN+VLA radio size). RGJ123711 is perceived to be a merging system that has two components of roughly equal spatial extent 2kpc, thus its effective size is about 2 larger than the rest of the galaxies in our sample, although we still use the MERLIN+VLA sizes as priors for CO size due to lack of resolved CO data. For the sources with measured MERLIN+VLA sizes, we use the as the radius in Equation 2, and for sources without MERLIN+VLA data, we assume that is equal to the mean of the measured MERLIN+VLA sizes, = 2.30.8 kpc.
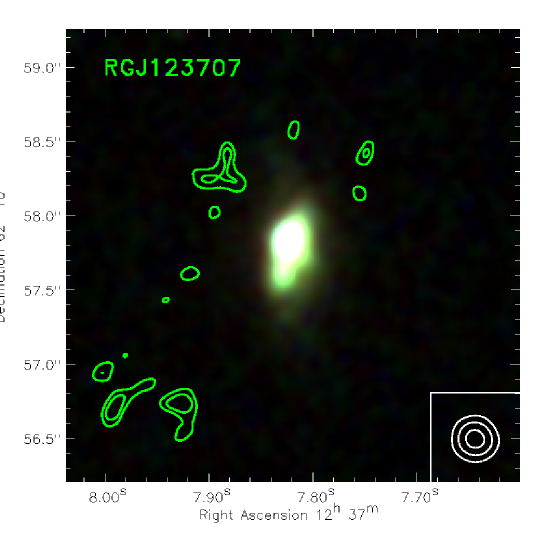
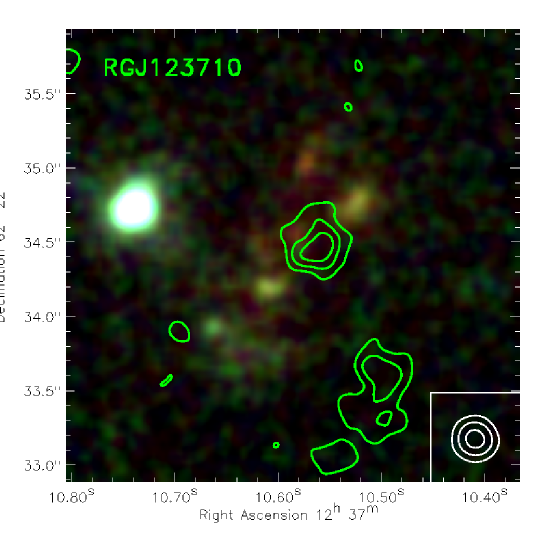
It is important to note that the extent and morphology of the MERLIN+VLA radio emission can affect the interpretation of the dynamical mass estimate. Three objects have large radio/UV offsets or very extended radio emission: RGJ105209 (whose offset is discussed in section 2.4), RGJ123707 (extended across a 7 kpc17 kpc area), and RGJ123710 (two knots separated by 8kpc). If the CO gas were to trace the MERLIN+VLA morphology perfectly, as is our a priori assumption, then the radius of each knot of radio emission would be used to estimate dynamical masses and they would be summed. Depending on the distribution of these knots, the true dynamical mass would be calculated by considering the size of each knot and the distance separating them, however, within the uncertainty of our measurements and assumptions (e.g. inclination angle, line-width uncertainty and uncertainty on the value of ) we consider our approach of circularising the MERLIN+VLA sizes and inferring a radius as accurate. We caution that dynamical masses are potentially slightly underestimated, due to the size and distribution of the CO gas relative to radio emission. For example, radio sizes are potentially inconsistent with CO sizes, as with the B-configuration data of RGJ123626 and RGJ123710 presented in Daddi et al. (2010), which suggest larger dynamical mass estimates by a factor proportional to the radius.
When applied to the whole SFRG sample, we derive a median SFRG dynamical mass of M(7.2)1010 M⊙2.91011 M⊙. The same value of is used to compare with mean dynamical mass of SMGs, which is M(1.5)1011 M⊙6.01011 M⊙.
3.4 MERLIN+VLA Radio Morphology
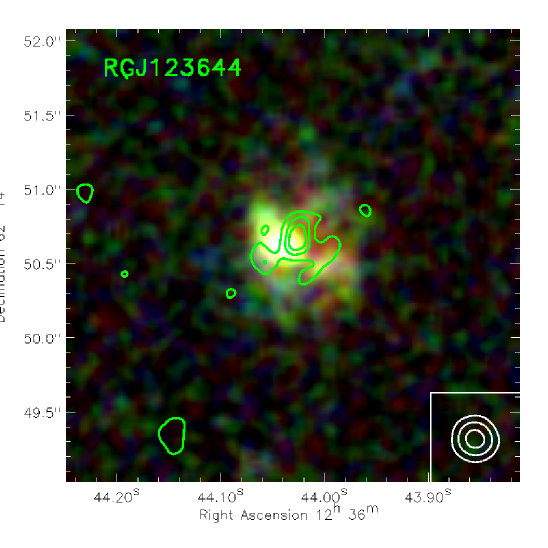
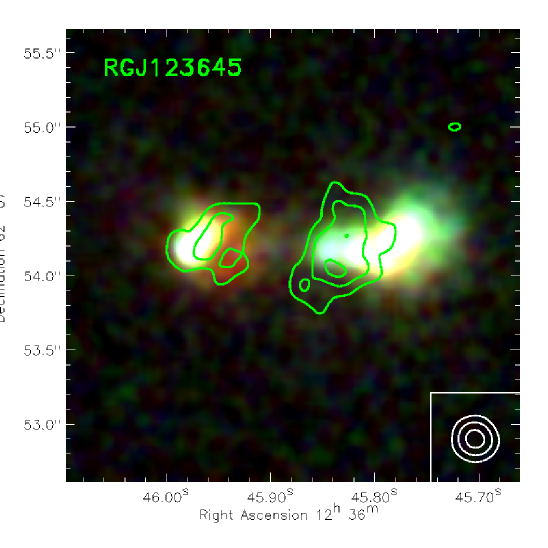
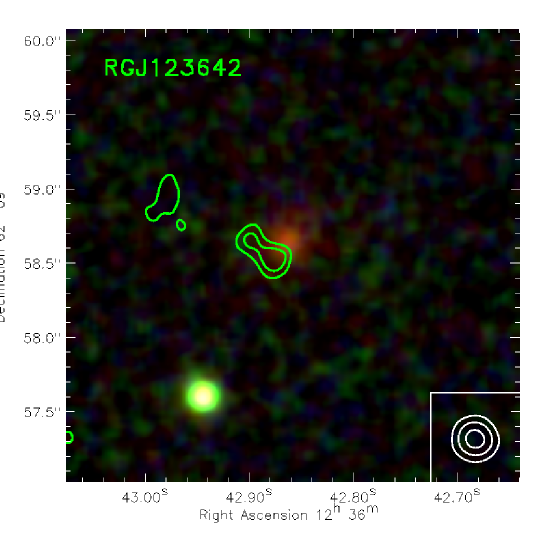
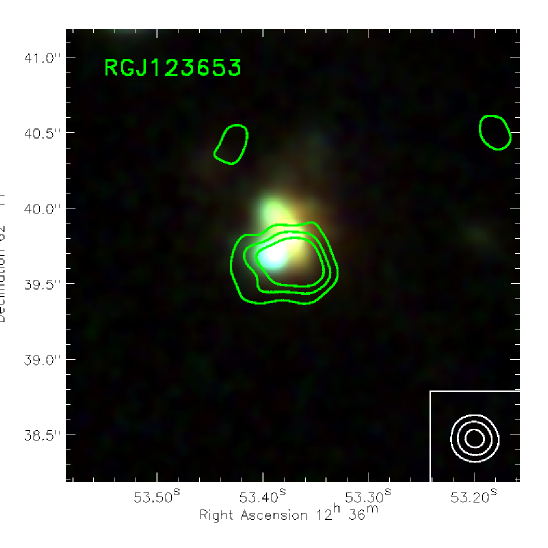
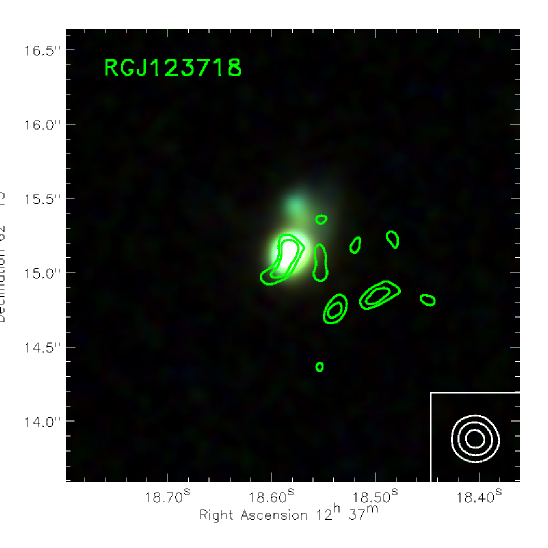
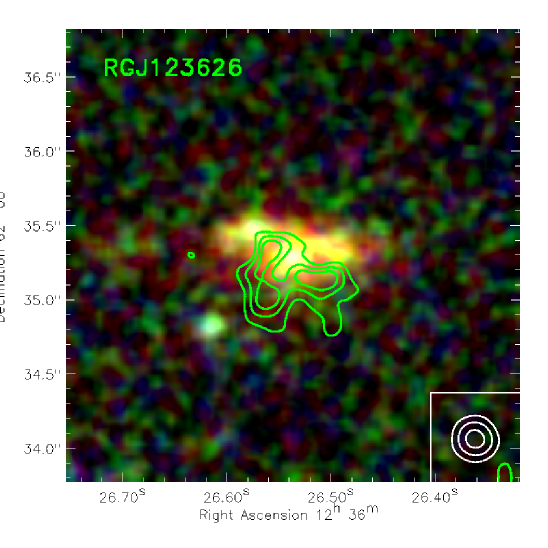
We use the high-resolution MERLIN+VLA radio maps to map the extension of starburst emission and assess the contribution of AGN by considering their radio morphology, which is shown as contour overlays on optical imaging in Fig. 5. With resolutions of 0.4″ and 0.5″ per beam (for GOODS-N and the Lockman Hole respectively), the smallest resolvable structure at z1.5 would be 4-5 kpc across. The typical size of an AGN emission region in a Jy radio galaxy at (see Casey et al., 2009b) at radio wavelengths is much less than 1kpc, implying that an AGN dominated source would be completely unresolved in MERLIN+VLA radio maps (e.g. as seen in the high stellar mass, giant elliptical systems of Casey et al., 2009b). Fig. 5 shows that each of these galaxies has extended emission regions on large scales irregularly spread across large regions of the galaxy, suggestive of spatially distributed star formation, unlikely to be generated by AGN. About 10-60% of the total flux from the source is estimated to be resolved out by the high-resolution imaging, which is dependent on the galaxies’ extended or compact morphologies. We measure an effective radius of the star forming area by isolating the regions where MERLIN+VLA radio emission is significant to 3, and we then take the square root of the surface area over pi (effectively circularised), Reff, which is given in Table 3). While the morphologies are irregular (and are not in fact circular), we find that the effective radii average to 2.30.8 kpc, which agrees with the size measurements of SMGs in Biggs & Ivison (2008) and Chapman et al. (2004). We use the agreement of MERLIN+VLA SFRG and SMG sizes to partly justify our assumption of similar CO sizes between the populations.
Since as much as 60% of the radio flux can be resolved out in the high-resolution maps, we caution that this effective radius might be an underestimate, and that it could increase by factors of 1.1-1.5 if all of the flux is accounted for; however, this adjustment is not made to our effective radii measurements since it is highly uncertain and relies on assumptions of the distribution of star formation activity in the outskirts of each source. Similarly, this underestimate of effective radius would propagate to the derivation of dynamical masses.
| NAME | z | LFIR | SFRradio | SFRUV | M[U] | M[Sp] | Mdynsin | SFE | Reff | M⋆ | ClassX | ClassIR | ClassCO | |
|---|---|---|---|---|---|---|---|---|---|---|---|---|---|---|
| (1012 L⊙) | ( M⊙ yr-1) | ( M⊙ yr-1) | ( M⊙) | ( M⊙) | ( M⊙) | ( L⊙/ M⊙) | (kpc) | () | ( M⊙) | |||||
| RGJ021827… | 1.362 | 3.3 | 570 | 9 | 1.21010 | 6.51010 | 1.21011 | 280 | … | … | 2.31011 | SB | SB | SB |
| RGJ105209… | 2.113 | 4.4 | 750 | 20 | 3.01010 | 1.71011 | 7.41010 | 150 | 2.2 | 49 | 1.01011 | SB | SB | SB |
| RGJ105239… | 1.820 | 2.2 | 380 | 90 | 2.61010 | 1.51011 | 9.61010 | 80 | 2.3 | 23 | 1.21011 | SB | SB | SB |
| RGJ123626… | 1.465 | 1.9 | 320 | 7 | 1.81010 | 1.01011 | 5.81010 | 110 | 2.8 | 13 | 2.81010 | SB | SB | SB |
| RGJ123642… | 3.661 | 1.1 | 1900 | 30 | 1.01010 | 5.91010 | … | 110 | 1.4 | 310 | 4.11010 | SB+ | SB | SB |
| RGJ123644… | 2.090 | 5.0 | 850 | 30 | 2.01010 | 1.11011 | 2.11010 | 250 | 2.7 | 37 | 1.11011 | SB+ | SB+ | SB |
| RGJ123645… | 1.434 | 3.8 | 660 | 30 | 1.91010 | 1.11011 | 5.21010 | 200 | 3.0 | 23 | 4.91010 | SB | SB | SB |
| RGJ123653… | 1.275 | 2.9 | 500 | 40 | 5.0109 | 2.81010 | … | 580 | 2.8 | 20 | 3.61010 | SB | AGN | SB+ |
| RGJ123707… | 1.489 | 1.2 | 210 | 50 | 7.1109 | 4.01010 | … | 170 | 1.3 | 39 | 2.31010 | SB+ | SB | SB |
| RGJ123710… | 1.522 | 2.1 | 350 | 10 | 2.71010 | 1.51011 | 2.01010 | 80 | 1.9 | 30 | 2.41010 | SB | SB | SB |
| RGJ123711… | 1.996 | 8.8 | 1500 | 30 | 3.01010 | 1.71011 | 1.11011 | 290 | 3.7 | 34 | 1.21011 | SB+ | AGN | SB |
| RGJ123718… | 1.512 | 0.8 | 140 | 40 | 5.0109 | 2.81010 | … | 160 | 1.1 | 36 | 1.61011 | SB | AGN | SB |
| RGJ131207… | 1.532 | 2.5 | 420 | 9 | 7.8109 | 4.41010 | … | 320 | … | … | 6.0109 | SB | SB | SB |
| RGJ131208… | 2.237 | 5.6 | 960 | 20 | 2.61010 | 1.51010 | 7.51010 | 220 | … | … | 1.81010 | SB | AGN | SB |
| RGJ131236… | 2.224 | 6.6 | 1100 | 40 | 5.0109 | 2.81010 | … | 1300 | … | … | 2.41010 | AGN | SB | AGN |
| RGJ163655… | 2.187 | 6.8 | 1200 | 70 | 8.0109 | 4.51010 | 2.51010 | 850 | … | … | 4.11010 | SB | SB+ | AGN |
Table Notes. Derived gas properties of SFRGs. LFIR is derived from radio luminosity, and the associated SFR is thus labelled . Conversion to gas mass assumes the typical ULIRG conversion factor 0.8 M⊙ (K km s-1 pc2)-1 (Downes & Solomon, 1998) for [U], the default assumption of gas mass for this sample, although we note that higher conversion factors (4.5 M⊙ (K km s-1 pc2)-1) might be appropriate for a subset of these galaxies which exhibit normal spiral galaxy characteristics (see Daddi et al., 2010), and these gas masses are given in [Sp]. The total dynamical mass is calculated by assuming a size of CO emission, which we do not directly measure, but assume is equal to the effective radius of radio emission, given as , and when radio is not available we assume a radius of 2.3 kpc, the mean MERLIN+VLA radius, consistent with SMG sizes. The star formation efficiency (SFE) is divided by the ULIRG molecular gas mass, M. SFRUV has not been corrected for extinction. The star formation rate density, , has units of M⊙ yr-1 kpc-2 (). Since these galaxies were selected in the radio, we provide a measure of their starburst and AGN content by classifying them into starburst (SB), AGN, and starburst/AGN mix (SB+) in five separate AGN selection criteria. ClassX marks any galaxy with X-Ray luminosity 51043 erg s-2 as “AGN”, 11043 erg s-2 as “SB” and intermediate luminosity galaxies as “SB+”. X-ray data is taken from Alexander et al. (2003), Brunner et al. (2008), Ueda et al. (2008), and Mushotzky et al. (2000). ClassIR marks galaxies with significant 8m flux excess (relative to the stellar population fits) as “AGN”, galaxies with marginally significant 2 8m excess as “SB+” and galaxies with no 8m excess as “SB” (see Figure 6). ClassCO marks galaxies with unusually high FIR-to-CO ratios as “AGN” (2.7), “SB+” (2.52.7), and at low FIR-to-CO ratios, “SB” (2.5). A fourth class may be defined as a measure of the star formation rate density, ; all of the galaxies for which we have measurements satisfy the “SB” criteria however, with star formation densities 200 M⊙ yr-2. A fifth class is defined by their rest-UV/optical spectroscopic properties, which, by method of their selection, is uniformly “SB.”
3.5 Star Formation Rates, Densities and Efficiencies
We estimate SFRs from VLA radio luminosities, using the radio/FIR correlation for star forming galaxies (e.g. Helou et al., 1985; Condon, 1992; Sanders & Mirabel, 1996):
| (3) |
where is luminosity distance in cm, is evaluated from 8-1000m and is in L⊙, is the radio flux density at 1.4 GHz in units of Jy. A Salpeter initial mass function is assumed. The factor of (1 + z)(1-α) accounts for bandwidth compression and the radio K-correction to the rest-frame luminosity; is the synchrotron slope index, here taken to be 0.75 (Yun et al., 2001). Since this is an empirical relation defined by the mean ratio between FIR and radio luminosities, there are a few different versions in use in the literature. This relation uses the bolometric ratio between FIR flux and radio flux of 2.46 (e.g. Ivison et al., 2010a, b; Casey et al., 2010). The relation is traditionally defined by = 2.35 (Sanders & Mirabel, 1996) and was used by Chapman et al. (2005) to calculate FIR luminosities for the redshift-identified SMGs (only differing by factors of 20% between different assumed ratios). In most cases, the FIR luminosities derived from the radio are consistent with the submm detection limits and any flux density measurements at shorter wavelengths in the FIR (e.g. at 70m or at 350m).
The FIR luminosity is then converted into a star formation rate (SFR) using the following relation:
| (4) |
from Kennicutt (1998). The inner quartile (25-75 percent) of star formation rates is 400-1600M⊙ yr-1 with median 700M⊙ yr-1. Both derived quantities, LFIR and SFR, are given in Table 3. We also derive UV-inferred SFRs using -band and -band optical photometry. Since all SFRGs are quite optically faint () and FIR luminous, they are potentially subject to significant (yet uncertain) extinction factors. While not taken into account for the UV-inferred SFRs themselves, the large extinction factors may be deduced from the large disparities between SFRradio and SFRUV given in table 3 with a typical ratio of SFRradio/SFRUV = 30 (we do not consider SFRradio/SFRUV to have AGN contamination based on the previous section).
Additional evidence that extinction caused by dust is significant comes in the comparison between rest-UV morphologies and their MERLIN+VLA radio morphologies as seen in Fig. 5. Since the brightest and/or bluest components of the rest-UV emission and radio emission do not often coincide, it indicates that the dustiest, most FIR-luminous regions in the galaxy could be highly obscured.
Total star formation rate densities, , are estimated by dividing these SFRs (from VLA fluxes) by the surface areas of MERLIN+VLA radio emission regions. We measure an effective star formation surface area by isolating the regions where MERLIN+VLA radio emission is significant to 3 (the values for effective radius of radio emission and SFR density, , are given in Table 3). The median total SFR density is 30 M⊙ yr-1 kpc-2. Note that this is potentially an overestimation of the SFR density since the radio flux contained within the 3 MERLIN+VLA region constitutes a fraction of the total VLA radio flux (it is inferred that this fraction is within 40-90%). For this reason we also compute alternate star formation rate densities using the total integrated MERLIN+VLA flux within the 3 emission area. We convert the flux to a radio luminosity, then FIR luminosity, then SFR, and divide it by the area. The median value for this alternate SFR density is 10 M⊙ yr-1 kpc-2 which is on average, three times less than the total .
Comparing either SFR density measurements to their theoretical maximumthe maximum gas density divided by the local dynamical time (see equation 5 of Elmegreen, 1999, we use tdyn=4107yr)we can determine if the implied SFR density exceeds the theoretical prediction. While local ULIRGs with 200 M⊙ yr-1 kpc-2 are forming stars at their theoretical maximum (e.g. Tacconi et al., 2006), only one of the SFRGs exceeds this limit, which is a dust opacity Eddington limit for SFR density (see Thompson et al., 2005). This source is RGJ123642, the highest redshift source in our sample having a low S/N in the radio, meaning the measured effective radius is unusually small. Even by assuming unresolved radio profiles, only RGJ123642 exceeds the maximal starburst density, further highlighting that even starburst emission can dominate unresolved radio emission. In contrast, it would be unlikely for extended radio emission (this faint at these redshifts) to be driven by emission from AGN.
The star formation efficiency (SFE) can be calculated by dividing the FIR luminosity by the H2 gas mass. This calculation is contingent on the gas reservoir being in the same region as the starburst, which is an assumption which needs to be investigated in more detail through future high-resolution multiple- CO maps and resolved FIR emission maps. The mean SFE for SFRGs is 280260 L⊙/ M⊙. Put another way, the median depletion timescale (defined as M/SFR, assuming 100% efficiency) for SFRGs is 34 Myr with inner quartile 20 Myr - 55 Myr. It should be noted here that a different gas conversion factor (e.g. 4.5 M⊙ (K km s-1 pc2)-1) would increase the depletion timescale and decrease the star formation efficiency by 5.6 times.
3.6 Dust Temperature and Dust Mass
We fit FIR spectral energy distributions (SEDs) to the FIR flux density limits at 70m, 350m, 850m, and 1200m (see Table 1 for details). Our fitting method follows the methodology of Chapman et al. (2004), Chapman et al. (2005), and Casey et al. (2009a): a single dust temperature modified black body fit. We fix the dust emissivity to 1.5 and use the FIR/radio correlation to infer a FIR luminosity from the radio flux. Since we are limited by a lack of data in the FIR for most of our sample (many only have limits), our derived dust temperatures are not well constrained. However if the uncertainty in our assumption of the radio/FIR correlation and dust emissivity are taken as givens, then we deduce temperature uncertainties on the order of 20-30K. This is calculated by assuming scales with ; a higher implies a high , and a FIR SED with a high can then be constrained by the FIR flux density measurements, even in the case of upper limits. Despite the large uncertainties, our measurements (whose statistical mean is 65 K) are consistent with a selection of warmer dust galaxies, even though there may be outliers.
We also estimate dust mass for the SFRG sample by using the following relation
| (5) |
where is the dust mass absorption coefficient as a function of rest wavelength: = 0.15 m2 kg-1, = 0.290.03 m2 kg-1 (Wiebe et al., 2009) and = 1.2 m2 kg-1 (Weingartner & Draine, 2001). Again, the lack of FIR data means that our dust mass calculations are not well constrained; our SFRGs have a mean dust mass upper limit (at 2) of 2109 M⊙, which is not a well constrained measurement. A quick comparison to the mean gas mass (21010 M⊙) implies mean dust-to-gas ratios of 1/10 (well within expectation).
3.7 Stellar Mass
To estimate the galaxies’ stellar masses, we combine the photometric points in the optical ( ACS , , , and for GOODS-N, ACS for Lockman Hole, and Subaru for SSA13) and the mid-IR (-IRAC 3.6m, 4.5m, 5.8m and 8.0m). For 1-3, these photometric points cover rest-frame 1.6m where stellar emission peaks. We use the hyperz photometric redshift code (Bolzonella et al., 2000) to fit this photometry to several stellar population SEDs (Bruzual & Charlot, 2003). Using the best fit stellar population SED, we estimate the rest-frame H-band magnitude. While rest-frame K-band is often used to measure stellar mass for high-redshift galaxies (using the method outlined by Borys et al., 2005), recent work has shown that stellar masses derived from K-band are overestimated due to increased contribution from AGN power law and decreased contribution from star light at longer wavelengths, (see Hainline et al., 2009). The mean light to mass ratio, /M, can range from 5-10 L⊙/ M⊙, and using the Bruzual & Charlot (2003) models, is set at 5.6 L⊙/ M⊙for SMGs as in Hainline et al.. The mean rest-frame H-band absolute magnitude is -25.40.8 with an inferred average stellar mass of 71010 M⊙. These masses are consistent with the H-band derived SMG stellar masses (H-band absolute magnitude averages -25.80.2 and masses average 21011) found by Hainline et al. (2009) and a factor of 2 lower than the K-band SMG masses derived by Borys et al. (2005).
Figure 6 illustrates the best stellar population models with respect to the galaxies’ photometric data. If an excess flux density is detected above the stellar model SED at observed 8m then an AGN might be contributing significantly to the near infrared luminosities (see section 4.1 for an analysis of AGN contamination). While there are potential flux excess in seven of the 15 sources illustrated, the excess is only significant 2 in RGJ123653 and RGJ123718. The former is discussed in detail in Casey et al. (2009a) who conclude an insignificant AGN contribution based on combined evidence from X-ray (very low flux, consistent with starbursts), extended radio emission (inconsistent with AGN radio emission), and no clear powerlaw dominating the near to mid-IR data. The latter has extended radio emission, no X-ray detection and is the faintest radio galaxy of our sample (15Jy), and therefore, it is unlikely that it is dominated by a very powerful AGN. There is no clear relation between a system’s stellar mass and its resulting detection in CO.
The galaxies’ formation timescales are given by /SFR; the median of the sample is 10 Myr. While this quantity could be overestimated if M⋆ is overestimated, the formation timescales likely represent a lower limit on the time it took to build up the stellar population since the star formation rates are hypothetically near their peak during the ULIRG phase (200 M⊙ yr-1) in comparison to most galaxies at the same epoch (1-10 M⊙ yr-1). The hypothesis of SFRGs being near the peak is based on the fact that their SFRs are not sustainable beyond 100 Myr, but it is unlikely that these systems are that young; it is more probable that SFRGs evolved more slowly, building up stellar mass gradually until a point, when a trigger led to an extreme star-bursting phase.
4 Discussion
Here we explore the relationship between the CO observations in SFRGs and their other multi-wavelength properties, drawing on comparisons with other galaxy populations. CO observations provide a unique and independent probe of the galaxies’ star formation properties, by constraining the molecular gas reservoirs which fuel the star formation. In Table 4 we have summarised many of the measured physical properties of SFRGs relative to SMGs for quick reference. Important to note, however, is that the SMGs of Table 4 are those with CO observations, limited to the mostly bright SMG subsample. After comparing with other populations, we discuss the implications that these observations have for the study of all high-z ULIRGs and how improved targeted observations, in both molecular interstellar medium lines and FIR continuum, will enable thorough, unhindered analysis of ULIRG evolution and extreme star formation at z2.
The original motivation for segregating submm-faint and submm-bright populations for CO observations is the premise that they exhibit similar extreme starburst qualities, thus molecular gas qualities, but differ in dust distribution whereby slightly warmer dust systems are undetectable at 850m (the usual SMG-selection band). Surveying SFRGs in CO provides confirmation, through detection of vast gas reservoirs, that SMGs are not the only significant population of ULIRGs at high-. The basic physical premise of the comparison is that the dust distribution in SFRGs would need to be clumpier or more compact to be heated to slightly higher dust temperatures. Since SFRG radio morphologies on average seem to be similarly extended and irregular, SFRGs are suggested to be less homogeneously diffuse than SMGs (Menéndez-Delmestre et al., 2009; Hainline et al., 2009), with more concentrated clumps, yet spread over the same large area.
| Property | SFRGs | SMGsa |
|---|---|---|
| 1.80.7 | 2.40.6 | |
| LFIR ( L⊙) | (43)1012 | (84)1012 |
| SFR (M⊙ yr-1) | 700500 | 1400500 |
| R (kpc) b | 2.30.8 | 2.70.4 |
| (M⊙ yr-1 kpc-2) b | 30 | 60 |
| Tdust (K) c | 6615 | 415 |
| Mdust ( M⊙) c | 2109 | 9108 |
| H-band Mag | -25.40.8 | -25.80.2 |
| M⋆ ( M⊙) | (76)1010 | (21)1011 |
| (Myr) | 10 | 14 |
| M ( M⊙) | (2.10.7)1010 | (5.12.8)1010 |
| ( km s-1) | 32080 | 530150 |
| SFE ( L⊙/ M⊙) | 280260 | 450170 |
| M ( M⊙) d | (7.2)1010 | (1.5)1011 |
| (Myr) | 3424 | 40 |
| f e | 0.07 | 0.09 |
| f e | 0.2 | 0.3 |
| f | 2.00.8 | 1.40.2 |
| g | 0.30.1 | 0.40.2 |
a All aggregate properties of SMGs are measured with respect to the CO-observed subset from Neri et al. (2003), Greve et al. (2005), and Tacconi et al. (2006).
b Effective radius and SFR density are measured for MERLIN+VLA imaged SFRGs only. The effective size of SMGs is from Biggs & Ivison (2008) and the SFR density is the SMG SFR divided by the mean Reff.
c Tdust and Mdust fits for SFRGs are described in section 3.6; while both measurements are highly uncertain due to poor FIR flux density constraints, their calculation is useful for comparison with SMGs from Chapman et al. (2005) and Kovács et al. (2006).
d Dynamical mass assumes an effective radius of 2 kpc for SFRGs and SMGs without radio size measurements; for SMGs, this size is supported by measurements from Tacconi et al. (2008), and for SFRGs the size has been shown to be similar for one SFRG (Bothwell et al., 2010) and is similar to their MERLIN+VLA radio sizes (Reff).
e The gas and stars fraction represent the fraction of total mass which is in gas (or in stars), internal to each galaxy. Note: the gas fraction does not include the 40% correction for helium.
f The ratio of CO line fluxes represents the source excitation. The value for SFRGs is based on the single measurement of RGJ123711 described in section 3.2, and the SMG measurement is taken from the three SMGs measured by Weiss et al. (2007).
g The AGN fraction (within a population) is estimated in the SFRG sample as described in section 4.3, while the AGN fraction of CO-observed SMGs is taken from their rest-UV spectral classification (note none of the SFRGs have AGN spectral signatures). The entire SMG population is estimated to have an AGN fraction of 0.25 (see Alexander et al., 2005).
4.1 Multi-wavelength Properties of SFRGs and AGN fraction
Table 3 provides a summary of SFRGs’ physical properties derived from multi-wavelength data. It includes AGN/starburst classifications for each individual SFRG, which help shed light on the complex nature of the population, and the potential for AGN contamination. “ClassX” classifies SFRGs based on X-ray luminosity, “ClassIR” classifies according to 8m flux excess in the near-IR, and “ClassCO” classifies according to FIR-to-CO luminosity ratio (where an unusually high ratio can be accounted for by an AGN contributing significantly to radio luminosity, thus overestimated FIR luminosity). A fourth class and fifth could also be defined, as rest-UV/optical spectroscopic features and as a function of the star formation rate density as traced by MERLIN+VLA morphologies, however we have noted that all of the samples’ morphologies are consistent with starbursts in both criteria. While we leave the reader the flexibility to interpret the AGN content of the SFRG sample as (s)he sees fit, we infer a total SFRG AGN fraction of 0.30.1 to first order (included in Table 4), the mean AGN dominated fraction from each of the three Table 3 classifications. This agrees with earlier measurements and estimates for SFRGs given in Casey et al. (2009b) and Casey et al. (2009a). Also, the possibility exists that weak beaming of low-luminosity radio jets could overestimate radio luminosity by factors of a few for some SFRGs (please see Casey et al., 2009b, for the detailed discussion of radio beaming in more compact SFRGs). Again, we caution AGN contamination has the potential to strongly bias the CO observations/interpretation of individual objects.
Figure 5 shows that SFRGs have faint optical luminosities, suggestive of heavy reddening or obscuration by dust. This idea is supported further by the large discrepancy between star formation rates derived from radio luminosity versus rest-UV flux densities. Even after correction for dust extinction using the UV slope and dust extinction models of Calzetti et al. (1994), the UV derived SFR can be a factor of 10-100 times lower than the radio-inferred SFR demonstrating that SFRGs are far dustier than normal dust extinction laws predict (which also holds for SMGs). Their radio morphologies are primarily extended and irregular, thus attributable to star formation and not compact AGN as is also the case for SMGs (Biggs & Ivison, 2008; Chapman et al., 2004). We also note the effective MERLIN+VLA radii between SFRGs that have been CO detected (2.70.6 kpc) and those that have not (1.70.8 kpc). While the difference is insignificant, it could be explained by observing that the sources with lower effective radii have lower S/N in the radio, implying lower FIR luminosities. If we assume the inferred radio/FIR and the ULIRG / relations, we predict integrated CO fluxes of 0.1-0.3 Jy km s-1 for CO-undetected sources based on radio flux density (requiring particularly sensitive observations with our setup).
Figure 6 showed that most SFRGs have only minor AGN contribution in the near-IR; most emission is dominated by stars. The stellar masses of SFRGs average to 71010 M⊙, consistent with SMG masses derived by Hainline et al. (2009) using rest H-band luminosity but a factor of 2 lower than the SMG masses of Borys et al. (2005) from rest K-band luminosity.
4.2 Comparing to SMGs
The comparison of molecular gas properties between SFRGs and SMGs is the main focus of this work, however, a strong selection bias is folded into this comparison. The first SMGs to be observed in CO (Neri et al., 2003; Greve et al., 2005; Tacconi et al., 2006) were among the brightest SMGs with spectroscopic redshifts (1012.5 L⊙) since brighter systems had a higher likelihood of being CO detected. We note that the luminosity distribution of SMGs plotted in Fig. 1 includes many lower luminosity SMGs which have recently been observed in CO, in parallel to our SFRG observing programs, but have not yet been analyzed or published (Bothwell et al., in preparation). Most of the ’bright-SMGs’ (those with published CO spectra) have AGN signatures in their rest-UV spectra, a property which would exclude them from SFRG selection if they were submm-faint. This means that similarly bright radio sources which are submm-faint, comparable to the ’bright-SMGs,’ were excluded from our sample due to AGN contamination.
Besides the luminosity bias introduced by weeding out AGN as revealed by rest-UV/optical spectroscopy, a further bias exists due to spectroscopic incompleteness of the SFRG population. Since their radio emission was more likely thought to be dominated by AGN, SFRGs were not followed up in rest-UV/rest-optical spectroscopy nearly as thoroughly or completely as SMGs. This likely means that the absolute brightest SMGs were CO observed while a large sample of bright SFRGs could have been excluded from CO observations due to a lack of reliable redshift information or potentially strong AGN contamination. Furthermore, the original SFRG selection of Chapman et al. (2004) had the added criteria of a faint optical magnitude 23, which made redshift measurement from rest-UV spectra more difficult. There has been some anecdotal indication, however, that warmer dust systems might not exist at the highest luminosities with the same frequency as colder dust systems, as revealed by 250m selected HyLIRG populations (Casey et al., 2010).
We note that the mis-identification of optical counterparts to SMGs has potentially led to a lower CO-detection rate for that population than other CO-observed galaxy populations; some of the radio galaxy SMG-counterparts might not be starbursts and might have intrinsically low FIR luminosities, thus CO luminosities. We note that SFRGs (although not faced with the issue of matching FIR positions to a correct radio counterpart) could also suffer from the selection of non-starburst radio galaxies.
In the sections below, we frequently discuss how SFRGs relate to SMGs: both the CO-observed ’bright’ subsample of SMGs and extrapolations based on preliminary analysis on the fainter, more numerous sample of SMGs (Bothwell, private communication). The overall luminosity bias existing in these distinct samples must be kept in mind when population comparisons are made.
4.3 Star Formation Efficiencies
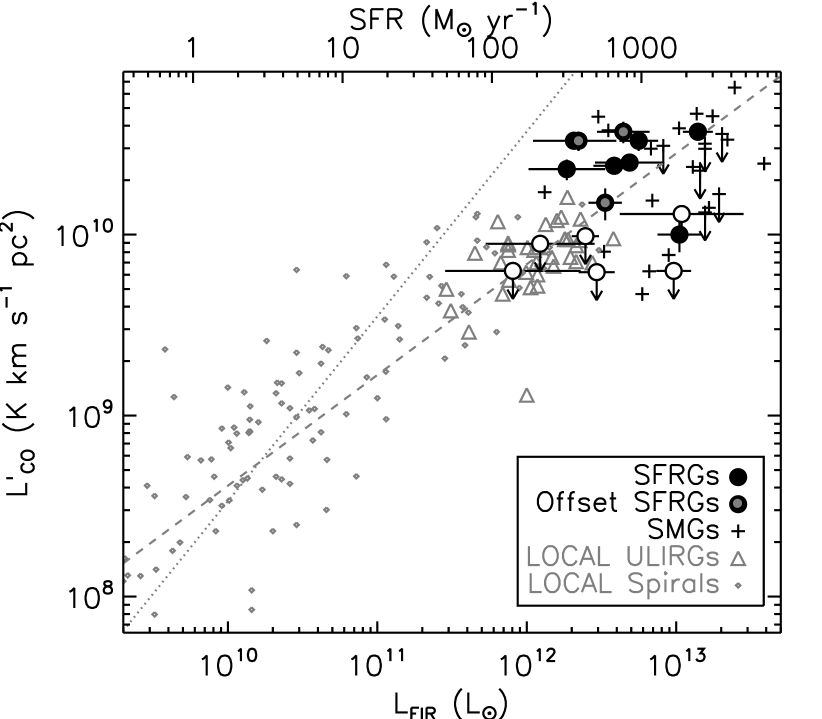
The relationship between star formation rate and molecular gas mass is paramount to a galaxy’s evolutionary interpretation. This is measured by comparing the FIR luminosity with CO line luminosity, as we show in Figure 7. In this context, SFRGs appear to have similarly high CO luminosities as SMGs, and most SFRGs lie slightly above the ‘ULIRG’ star formation efficiency powerlaw relation, 0.61, which is followed by both local ULIRGs and SMGs. However, SFRGs are inconsistent with the star formation efficiency relation which describes local spiral galaxies (0.93; Solomon & Sage, 1988; Gao & Solomon, 2004). The SMGs shown on Fig 7 are those of Neri et al. (2003), Greve et al. (2005) and Tacconi et al. (2006). As mentioned in section 4.2, SFRGs are a factor of 2 less luminous in radio (thus LFIR) than CO-observed SMGs. Due to their relative high luminosities with respect to local ULIRGs, the SMGs have been described as the scaled-up high-redshift analogues to local ULIRGs (Tacconi et al., 2006). In contrast, SFRGs probe a luminosity regime 1012.5 L⊙ closer to the locus of local ULIRGs at 1012 L⊙. While SFRGs might seem to be better analogues of local ULIRGs than SMGs in luminosity space, we note that the stellar and gas properties of the two populations are quite distinct: local ULIRGs being more compact with lower stellar masses than SFRGs and SMGs (Dasyra et al., 2006), and they have lower CO luminosities by a factor of 2-3.
The star formation efficiencies (SFEs) of SMGs and SFRGs span the range 70-1000 L⊙/ M⊙. The median SFE of the CO-detected SFRG sample is 280260 L⊙ M⊙-1 which is statistically consistent with the mean SFE for SMGs, 450170 L⊙ M⊙-1, although both values incorporate the large uncertainties of the gas conversion factor and FIR-derived SFR. Chapman et al. (2008) highlights that the two pilot program 12CO(=32) detections of RGJ123711 and RGJ163655 have exceptionally high SFEs and hypothesised that SFRGs, with further observation, might show similarly high SFEs compared to SMGs. Daddi et al. (2008) analyzed the CO content of two selected galaxies (RGJ123710 and RGJ123626, also selected as SFRGs and included in our analysis) and claimed that they had relatively low, Milky Way/“normal spiral” efficiencies, emphasising the difference between them and the high-efficiency ULIRGs. Our large sample of SFRGs, including both the Chapman et al. and Daddi et al. subsamples reveals a much wider spread in star formation efficiencies, suggestive of a wide range in gas states and a possible range of galaxy states, although more SFRGs are consistent with the less-efficient Daddi et al. sample.
The SFRGs not detected in CO and those far below the ULIRG / relation would appear to be very efficient star formers (less gas to fuel their high SFRs), however this assumes that AGN contamination is minimal. AGN contamination is more likely than super-efficient star formation and happens when AGN boosts the radio-inferred FIR luminosity, thus inferred star formation rate; as the empirical relation between and suggests, AGN contaminated sources would be fainter in CO gas than predicted. We then can classify SFRGs in terms of CO luminosity to FIR luminosity (i.e. the ratio of /), where low ratios are designated ’AGN’ in ’CLASSCO’ in Table 3. While the scatter of local ULIRGs around the / relation is minimal, 0.3 dex, both SFRG and SMG populations have more significant scatter below the relation; this is consistent with many SFRGs and SMGs having powerful AGN which boosts radio (thus FIR) luminosity.
The scatter of SFRGs above the ULIRG / relation is suggestive of low star formation efficiencies as presented by Daddi et al. (2008) and Daddi et al. (2010). We caution that sources like RGJ123710 and RGJ123626 which have these low star formation efficiencies, it might be more appropriate to assume that the gas properties are more similar to spiral/disk galaxies than ULIRGs, particularly when converting to molecular gas mass using the CO/H2 conversion factor. This factor differs greatly between ULIRGs (0.8 /(K km s-1 pc2)) and Milky Way type disk galaxies (4.5 /(K km s-1 pc2)). Since the inferred gas masses differ so greatly given these different assumptions, we give for both ULIRG and spiral/disk galaxy assumptions in Table 3 but proceed with our interpretation using the ULIRG conversion factor.
4.4 Line Widths: Implications for Merger Stage
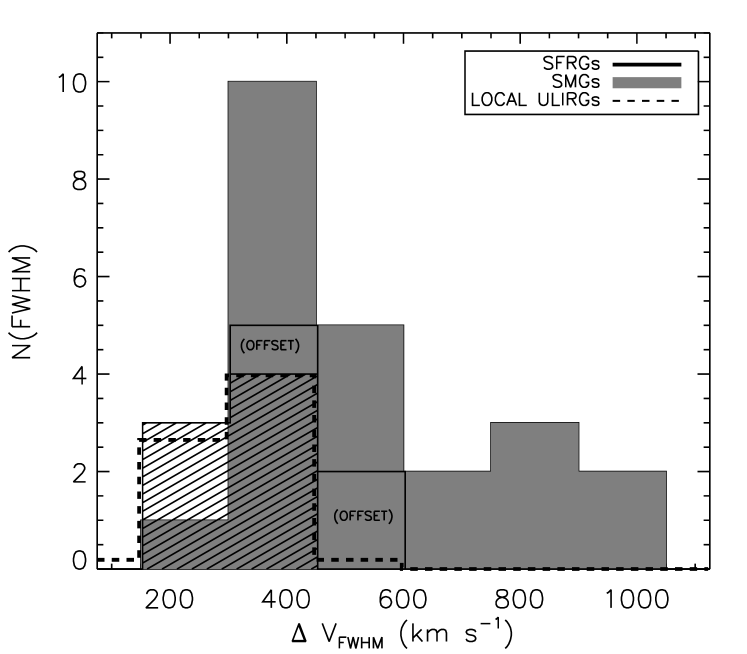
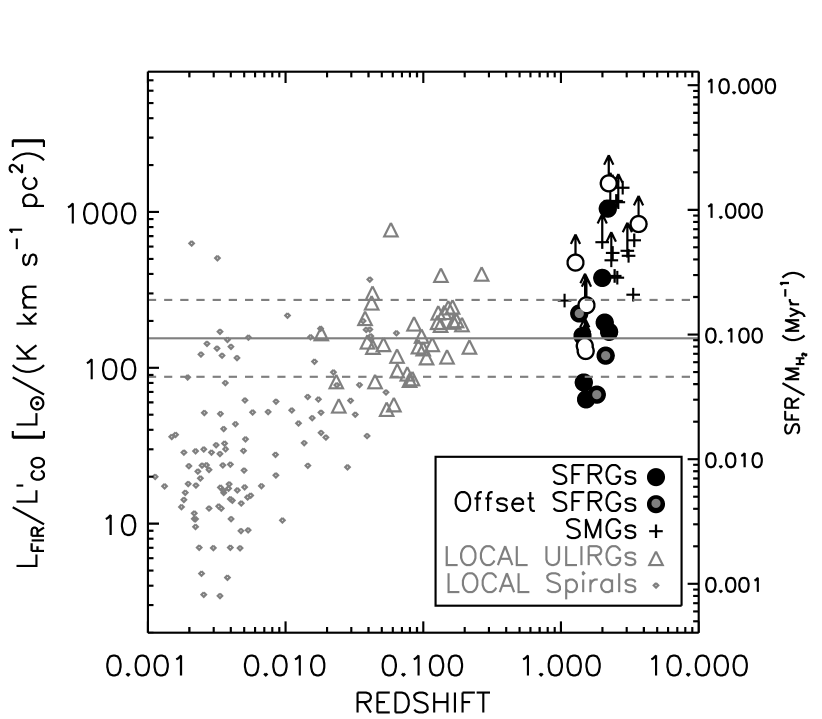
The distribution in CO line widths provides important insight into the galaxies’ dynamics. Figure 8 shows the full width at half maximum (FWHM) distributions for our SFRGs, SMGs (both ’bright’ SMGs and the fainter sample observed in CO only recently; Smail, private communication) and local ULIRGs (Solomon et al., 1997). None of the line widths presented here have made any inclination angle assumptions. The line widths of SMGs were adjusted to correct for the prior exclusion of double-peaked Gaussians (see the details of this correction in Coppin et al., 2008); this has reduced the mean SMG line width from 600 km s-1 to 530 km s-1. Despite the adjustment, SMGs seem quite distinct from SFRGs and local ULIRGs by having a high-FWHM tail in its distribution. This high-FWHM tail is seen only in bright subsample of SMGs originally surveyed in CO gas. While it could be attributed to selection bias, in that wide CO features are only detectable in the brightest objects where S/N is much higher, we highlight that there was significant improvement in receiver sensitivity between observations of these bright and wide SMG CO lines and the fainter SFRG observations, so the data have comparable S/N. This raises the possibility that only the brightest subsample of high- ULIRGs (1013 L⊙) have wide CO line widths (500 km s-1).
Broad dispersion-dominated CO lines (and irregular double peaked profiles) in the highest luminosity systems is suggestive of early stage major mergers where two gas rich disks are infalling. Local ULIRGs in contrast have a much narrower line width distribution and are a factor of 5-10 fainter in . For this reason, local ULIRGs are often said to be in a late starburst phase, at a coalesced point during a merger (when progenitors have coalesced into a single system; for a review see Sanders & Mirabel, 1996). SFRGs and more modest-luminosity SMGs are difficult to place in this evolutionary sequence, but their populations are not likely to be exclusively dominated by either beginning or ending merger sub-stages.
The lower dynamical masses of local ULIRGs (typical sizes 1 kpc and 300 km s-1) could be due to downsizingwhere extreme starbursts today are less massive than those at high-. Both SFRGs and SMGs are consistent with this picture since they seem to be a factor of 2 larger (2 kpc, see measurements of CO size in Tacconi et al., 2008; Daddi et al., 2010; Bothwell et al., 2010). The subsample of SMGs which have very broad features may be in a particular stage of merger where their line profile becomes broadened, perhaps in observation of two distinct components with very small physical separation or gas. This would appear to increase our dynamical mass estimates of these systems. However, the radial ‘size’ and merger correction factor would both need to be reasessed (both of which have not been measured on a case by case basis for these sources) before physical interpretation of higher dynamical mass estimates were made.
Although more observations need to be taken to conclude, an alternate explanation for the narrower line widths observed in modest-luminosity sources, including SFRGs, is that the population consists of fewer major mergers than the very bright systems. Observational evidence indicates that anywhere from 50-90% of local ULIRGs have undergone recent mergers (Lawrence et al., 1989; Melnick & Mirabel, 1990; Clements et al., 1996, e.g.), but that a sizable fraction might be triggered by other mechanisms. Recent work from Genzel et al. (2008) suggests that high star formation rates in secularly evolving disk galaxies may be caused by rapid rotation or smooth accretion of material from its surroundings (e.g. minor merging or tidal accretion). In addition, theoretical work indicates that the high star formation rates and IR luminosities in ULIRGs could often be generated by minor mergers and turbulent disk processes (e.g. Monaco, 2004; Dib et al., 2006). ULIRGs driven by secular processes would exhibit narrow CO line widths, consistent with the SFRGs presented in this paper. High spatial resolution gas observations are needed to determine the true nature of their dynamics however.
Recent observations and simulation work have reiterated the idea that 1013 ULIRGs are more often in early-stage major mergers. Tacconi et al. (2008) and Engel et al. (2010) show that most SMGs at z2 exhibit disturbed gas morphologies rather than smoothly rotating disks, and simulations and semi-analytic SMG models tell us that major mergers likely initiate most ultraluminous phases of high- star formation seen in SMGs (Narayanan et al., 2009; Swinbank et al., 2008; Baugh et al., 2005). However, recent work from Davé et al. (2010) indicate that ULIRGs may also be driven by continual bombardment by very low mass fragments onto a 1011 M⊙ galaxy. Cold streams feeding continual gas buildup (e.g. Dekel et al., 2009) has also been raised as a possible origin. The tail of large CO line widths in SMGs provides a crucial piece of observational evidence that some SMGs are much more highly disturbed and represent a different phase than SFRGs and local ULIRGs.
We note that the mean gas fraction, defined as gas mass to dynamical mass ratio, of SFRGs is Mgas/M= = 0.07, consistent with the same ratio for SMGs, which have Mgas/M0.09 (after correction for a 30o inclination angle). While this comparison is between SFRGs which have lower luminosities than CO-observed SMGs, the same molecular gas fraction suggests that the two populations are likely in similar evolutionary stages. We note, however, that if we assume a CO/H2 gas conversion factor consistent with spirals instead of ULIRGs, the gas mass fraction increases substantially to 0.60. While overall, SFRGs and SMG properties are more consistent with ULIRGs, it is possible that a few outliers, for example RGJ123710 and RGJ123626 described in (Daddi et al., 2008) and a few of the SMGs exhibiting unusually low SFEs, are much more gas rich than the ULIRGs which comprise the rest of the populations.
4.5 Comparison with Other Populations
An evolutionary transition stage between ULIRG and quasar has been explored extensively by work on Dust Obscured Galaxies (DOGs; Dey et al., 2008; Pope et al., 2008), a population of galaxies with warm dust temperatures and more modest SFRs than the brightest SMGs, consistent with 1012 L⊙ ULIRGs. Ten of fourteen SFRGs with 24m flux measurements satisfy DOG selection. While DOG selection is quite broad and selects nearly all SFRGs and many SMGs (requiring 24m flux densities 100 Jy and red optical to IR colors), a subset of DOGs with spectroscopic redshifts have detailed near-IR to FIR photometric constraints (Bussmann et al., 2009) which show that AGN may contribute significantly to their bolometric luminosities, and as a result, most have warm dust temperatures ( 45 K). Due to their high AGN fraction (dependent on luminosity and only 0.5 in the faintest, S0.5 mJy subset, e.g. Pope et al., 2008) and heavy dust obscuration, many DOGs are believed to lie at the transition phase between SMGs (or star-forming ULIRG) and luminous quasar (Pope et al., 2008) and overlap with the SFRG population.
While SFRGs might have warm dust temperatures like some DOGs, we find that most are dominated by star formation and not AGN. This is largely a function of the aggressive selection of SFRGs, meant to weed out strong AGN by their spectral indicators in the rest-UV/optical and the observation of minimal 8m flux excess and of extended radio emission. High star formation rates and a low AGN fraction (with respect to a higher AGN fraction in DOGs) are strong evidence that SFRGs are at a similar ULIRG phase to SMGs despite their warm dust.
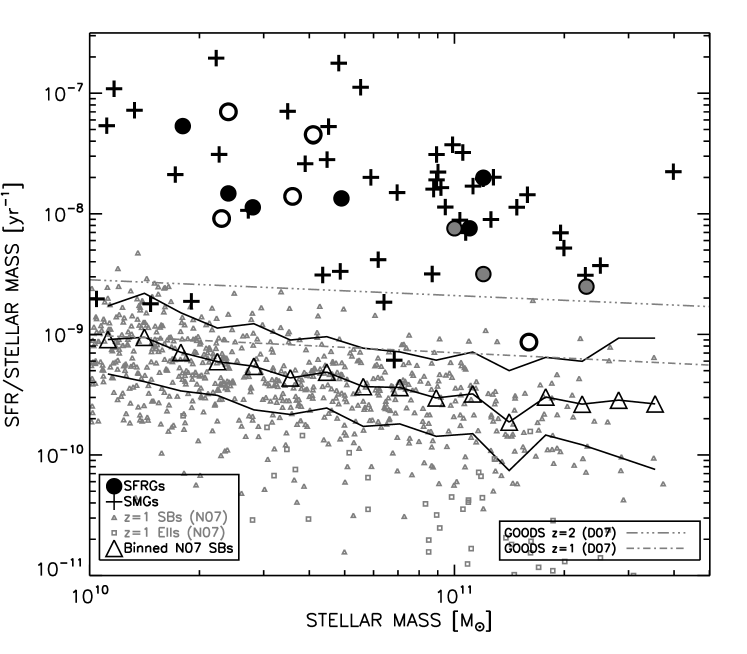
The molecular gas fractions of z2 normal starburst galaxies have been estimated at 0.4-0.5 (assuming a prior; Erb et al., 2006). The gas fraction in SMGs (and a few BX active galaxies) has been measured to be 0.3-0.5 (these values do not take inclination into account, which is a factor of 1/4 Tacconi et al., 2008). We measure an internal gas fraction of our SFRG sample of 0.07, which is consistent with SMGs, both the Tacconi et al. estimate (0.1 if corrected for inclination) and our reassessment of the same data (0.09). All measurements for high- ULIRGs (0.1) are lower than the inferred gas fractions for normal z2 galaxies (0.5) from Erb et al. (2006). This could indicate that the more modest-luminosity galaxies, consisting of gas-rich disks, have low dynamical masses but proportionately high gas mass, meaning they would be good progenitor candidates for ULIRG systems, if set on collision courses with other gas-rich disks. During the ULIRG starburst phase, the gas mass would start to decrease with rapid star formation. In contrast, we recognize that by using a higher conversion factor more consistent with quiescent disks, then the measured gas fractions of these ULIRGs would increase by 6, making their gas fractions consistent with those of the estimate for normal 2 galaxies. Future observations of more modest-luminosity galaxies in CO gas (e.g. like the recent work of Tacconi et al., 2010) are needed to to truly understand the sequencing and gas properties of ULIRGs and their progenitors.
Figure 9 highlights the unusually high star formation rates per unit mass of SFRGs and SMGs above normal starbursts (AEGIS samples; Noeske et al., 2007), for a wide range of stellar masses. The relation between stellar mass and specific star formation rate has been shown to evolve with redshift, e.g. Daddi et al. (2007); however, SMGs and SFRGs still lie at higher star formation rates than galaxies of equal mass at the same redshift (e.g. da Cunha et al., 2010). This enhanced SFR fraction per unit mass reveals that SFRG and SMG star formation processes seem fundamentally different than SF processes in more modest luminosity galaxies, despite the overall range of stellar mass spanning almost two orders of magnitude.
The active galaxy selection (Daddi et al., 2004) is meant to select moderate star forming (100-200 M⊙ yr-1), massive (1011 M⊙) galaxies at high redshiftsystems which are typically below the ULIRG star formation rate threshold (200 M⊙ yr-1). Daddi et al. (2010) detect several active galaxies in 12CO(=21) with surprisingly high gas masses given their star formation rates, indicating that they exhibit gas properties more consistent with normal Milky Way type galaxies, but at ’scaled-up’ luminosities, stellar masses and gas masses. It is important to note however that the active galaxies observed in CO were all radio-detected, in other words, most of them have SFRs above the ULIRG cutoff (200 M⊙ yr-1) and might otherwise be characterized as SMGs or SFRGs. All SFRGs in this paper satisfy the active selection criterion, indicating that selection might probe both massive star-bursting galaxies and massive, extreme, dusty starbursts. Similarly, it appears as if SFRG selection might select both high- ULIRG merging systems and extreme gas-rich disk galaxies.
4.6 Volume Density
It is probable that the luminosity bias described in section 4.2 has significant effect on how we can interpret the CO observations of either population.
Spectroscopic incompleteness in the SFRG population (as discussed in section 4.2) makes volume density difficult to calculate. We estimate that about 35 % of a complete sample of Jy radio galaxies (0.7 arcmin-2) with S20 Jy have not been observed spectroscopically (see Chapman et al., 2003). The majority of these are submillimetre faint (since most spectroscopic observations of Jy radio galaxies has been of SMGs). Of the submm-faint galaxies which were spectroscopically observed, 65 % have confirmed redshifts, roughly half of which are low luminosity AGN and the other half are star forming galaxies. This means that by completing spectroscopic observations of known submm-faint Jy radio galaxies in well surveyed fields, the source density of star-forming, submm-faint ULIRGs with redshifts would likely increase by 30 %, increasing the source density of all high- ULIRGs by 15%, which could also increase the ULIRG contribution (including SMGs) to the cosmic star formation rate density at its peak (e.g. see Bouwens et al., 2009; Goto et al., 2010).
Future observations from SCUBA2 and the Herschel Space Observatory in the 50-500 m range will dramatically improve the census of warmer dust ULIRGs (and all dusty starburst galaxies) at z2 through continued discovery, thus allowing more thorough follow up of the submm-faint (and 50-500m bright) radio sample. With improved interferometric millimetre line observations at low and high frequencies from the Atacama Large Millimeter Array (ALMA), we will be able to target these high redshift sources in multiple CO transitions, thus removing an observational bias towards certain J-transitions of CO and enabling more accurate calculation of gas masses. Without such strong temperature biases in gas and dust observations, a more complete interpretation of high redshift ultraluminous galaxies will finally be possible.
5 Conclusions
We have presented CO molecular gas observations of a sample of submillimetre-faint, star-forming radio galaxies (SFRGs). Due to their non-detection at submillimetre wavelengths and lack of dominant AGN, these ultraluminous, Jy radio galaxies are thought to be dominated by star formation but have warmer dust temperatures than SMGs. Out of 16 CO-observed SFRGs (12 from this paper and 4 from the literature), 10 are detected with a mean CO luminosity of 2.61010 K km s-1 pc2, which is slightly less luminous than the CO-observed SMG sample, despite being 2 less luminous in the radio. We attribute the luminosity difference to a selection bias but suggest that physical driving mechanisms might differ between the very bright (1013 L⊙) and moderately bright (1012 L⊙) populations.
High-resolution radio imaging from MERLIN+VLA shows that the radio emission in the SFRG sample is resolved and extended with mean effective radii 2 kpc, suggesting that the SFRG radio luminosities are dominated by star formation rather than AGN. The MERLIN+VLA sizes constraints are consistent with similarly analyzed SMG MERLIN+VLA sizes. While we note that AGN do not dominate our sample, it is possible that several of our sources have non-negligible AGN due in part to their selection as radio galaxies. Due to limited FIR data, we use the FIR/radio correlation to derive and then compute extinction-free star formation rates from the FIR.
The star formation efficiencies (SFEs) of SFRGs are comparable within large uncertainties to those of SMGs and local ULIRGs, even though a few sources appear to have very high SFEs (like those in Chapman et al., 2008) or very low SFEs (like those in Daddi et al., 2008). Those with perceived very high SFEs are more likely AGN dominated than super efficient; their FIR luminosities as calculated from the radio are probably overestimated.
SFRGs have narrower CO line widths than the bright subsample of SMGs at the same redshifts (320 km s-1 and 530 km s-1), suggesting that SFRGs might have less disturbed dynamical environments. The line width distribution is potentially suggestive of different evolutionary stages or processes between SFRGs and SMGs; however, the observed difference with SMGs could be due to a S/N or luminosity bias. The former would mean that intrinsically broad lines would have underestimated FWHMs due to low S/N. The latter is due to the more thorough spectroscopic sampling of the SMG population. SMGs have higher spectroscopic completeness and also include many objects with AGN signatures in the rest-UV/optical. Any SFRGs which have similar AGN signatures were culled from the sample, thus eliminating some of the potentially brightest SFRGs (most of the bright SMGs which have been surveyed in CO contain optical AGN). While less luminous SMGs (at the same luminosities of SFRGs) exist, few have been observed in CO, thus it is difficult to rule out that CO luminosity might relate to the distribution in CO with line width.
Despite selection biases, we have explored the possible physical scenarios triggering warm-dust ULIRGs in contrast to the well studied cold-dust ULIRGs. SFRGs appear to bridge the gap between the properties of 1013 L⊙SMGs and 1012 L⊙. Quantitatively, their extended radio emissions suggest sizes consistent with SMGs, implying much larger dynamical masses than local ULIRGs. We show that SFRGs have the same AGN fraction as SMGs and are therefore unlikely to represent a ‘post-SMG’ AGN turn-on phase. Luminous SMGs have been characterised as an early infall stage during a major merger, and local ULIRGs are often described at late-type major mergers. Here, we suggest that SFRGs (and less luminous SMGs) span the range of states during peak merger interaction.
Acknowledgments
We thank the anonymous referee for detailed, helpful comments which helped improve this paper greatly. This work is based on observations carried out with the IRAM Plateau de Bure Interferometer. IRAM is supported by INSU/CNRS (France), MPG (Germany) and IGN (Spain). We acknowledge the use of GILDAS software (http://www.iram.fr/IRAMFR/GILDAS). This work is also based, in part, on observations by the University of Manchester at Jodrell Bank Observatory on behalf of STFC, and the VLA of the National Radio Astronomy Observatory, a facility of the National Science Foundation operated under cooperative agreement by Associated Universities, Inc. CMC thanks the Gates Cambridge Trust for support, IRS thanks STFC for support, and KC is supported by an STFC Postdoctoral Fellowship. Support for this work was provided by NASA through Hubble Fellowship grant HST-HF-51268.01-A awarded by the Space Telescope Science Institute, which is operated by the Association of Universities for Research in Astronomy, Inc., for NASA, under contract NAS 5-26555.
References
- Alexander et al. (2003) Alexander D. M., Bauer F. E., Brandt W. N., Schneider D. P., Hornschemeier A. E., Vignali C., Barger A. J., Broos P. S., Cowie L. L., Garmire G. P., Townsley L. K., Bautz M. W., Chartas G., Sargent W. L. W., 2003, AJ, 126, 539
- Alexander et al. (2005) Alexander D. M., Bauer F. E., Chapman S. C., Smail I., Blain A. W., Brandt W. N., Ivison R. J., 2005, ApJ, 632, 736
- Baugh et al. (2005) Baugh C. M., Lacey C. G., Frenk C. S., Granato G. L., Silva L., Bressan A., Benson A. J., Cole S., 2005, MNRAS, 356, 1191
- Biggs & Ivison (2006) Biggs A. D., Ivison R. J., 2006, MNRAS, 371, 963
- Biggs & Ivison (2008) Biggs A. D., Ivison R. J., 2008, MNRAS, 385, 893
- Blain et al. (2004) Blain A. W., Chapman S. C., Smail I., Ivison R., 2004, ApJ, 611, 725
- Blain et al. (2002) Blain A. W., Smail I., Ivison R. J., Kneib J., Frayer D. T., 2002, Phys. Rep., 369, 111
- Bolzonella et al. (2000) Bolzonella M., Miralles J., Pelló R., 2000, A&A, 363, 476
- Borys et al. (2003) Borys C., Chapman S., Halpern M., Scott D., 2003, MNRAS, 344, 385
- Borys et al. (2005) Borys C., Smail I., Chapman S. C., Blain A. W., Alexander D. M., Ivison R. J., 2005, ApJ, 635, 853
- Boselli et al. (2002) Boselli A., Lequeux J., Gavazzi G., 2002, A&A, 384, 33
- Bothwell et al. (2010) Bothwell M. S., Chapman S. C., Tacconi L., Smail I., Ivison R. J., Casey C. M., Bertoldi F., Beswick R., Biggs A., Blain A. W., Cox P., Genzel R., Greve T. R., Kennicutt R., Muxlow T., Neri R., Omont A., 2010, MNRAS, 405, 219
- Bouwens et al. (2009) Bouwens R. J., Illingworth G. D., Franx M., Chary R., Meurer G. R., Conselice C. J., Ford H., Giavalisco M., van Dokkum P., 2009, ApJ, 705, 936
- Brunner et al. (2008) Brunner H., Cappelluti N., Hasinger G., Barcons X., Fabian A. C., Mainieri V., Szokoly G., 2008, A&A, 479, 283
- Bruzual & Charlot (2003) Bruzual G., Charlot S., 2003, MNRAS, 344, 1000
- Bussmann et al. (2009) Bussmann R. S., Dey A., Borys C., Desai V., Jannuzi B. T., Le Floc’h E., Melbourne J., Sheth K., Soifer B. T., 2009, ApJ, 705, 184
- Calzetti et al. (1994) Calzetti D., Kinney A. L., Storchi-Bergmann T., 1994, ApJ, 429, 582
- Carilli et al. (2010) Carilli C. L., Daddi E., Riechers D., Walter F., Weiss A., Dannerbauer H., Morrison G. E., Wagg J., Davé R., Elbaz D., Stern D., Dickinson M., Krips M., Aravena M., 2010, ApJ, 714, 1407
- Casey et al. (2010) Casey C., Chapman S., Smail I., Alaghband-Zadeh S., Bothwell M., Swinbank A., 2010
- Casey et al. (2009a) Casey C. M., et al., 2009a, MNRAS, 399, 121
- Casey et al. (2009b) Casey C. M., et al., 2009b, MNRAS, 395, 1249
- Chapman et al. (2003) Chapman S. C., Barger A. J., Cowie L. L., Scott D., Borys C., Capak P., Fomalont E. B., Lewis G. F., Richards E. A., Steffen A. T., Wilson G., Yun M., 2003, ApJ, 585, 57
- Chapman et al. (2005) Chapman S. C., Blain A. W., Smail I., Ivison R. J., 2005, ApJ, 622, 772
- Chapman et al. (2008) Chapman S. C., Neri R., Bertoldi F., Smail I., Greve T. R., Trethewey D., Blain A. W., Cox P., Genzel R., Ivison R. J., Kovacs A., Omont A., Swinbank A. M., 2008, ApJ, 689, 889
- Chapman et al. (2004) Chapman S. C., Smail I., Blain A. W., Ivison R. J., 2004, ApJ, 614, 671
- Chapman et al. (2004) Chapman S. C., Smail I., Windhorst R., Muxlow T., Ivison R. J., 2004, ApJ, 611, 732
- Clements et al. (1996) Clements D. L., Sutherland W. J., McMahon R. G., Saunders W., 1996, MNRAS, 279, 477
- Condon (1992) Condon J. J., 1992, ARA&A, 30, 575
- Coppin et al. (2006) Coppin K., et al., 2006, MNRAS, 372, 1621
- Coppin et al. (2008) Coppin K. E. K., Swinbank A. M., Neri R., Cox P., Alexander D. M., Smail I., Page M. J., Stevens J. A., Knudsen K. K., Ivison R. J., Beelen A., Bertoldi F., Omont A., 2008, MNRAS, 389, 45
- Coppin et al. (2007) Coppin K. E. K., Swinbank A. M., Neri R., Cox P., Smail I., Ellis R. S., Geach J. E., Siana B., Teplitz H., Dye S., Kneib J., Edge A. C., Richard J., 2007, ApJ, 665, 936
- da Cunha et al. (2010) da Cunha E., Charmandaris V., Diaz-Santos T., Armus L., Marshall J. A., Elbaz D., 2010, ArXiv e-prints
- Daddi et al. (2007) Daddi E., Alexander D. M., Dickinson M., Gilli R., Renzini A., Elbaz D., Cimatti A., Chary R., Frayer D., Bauer F. E., Brandt W. N., Giavalisco M., Grogin N. A., Huynh M., Kurk J., Mignoli M., Morrison G., Pope A., Ravindranath S., 2007, ApJ, 670, 173
- Daddi et al. (2010) Daddi E., Bournaud F., Walter F., Dannerbauer H., Carilli C. L., Dickinson M., Elbaz D., Morrison G. E., Riechers D., Onodera M., Salmi F., Krips M., Stern D., 2010, ApJ, 713, 686
- Daddi et al. (2004) Daddi E., Cimatti A., Renzini A., Fontana A., Mignoli M., Pozzetti L., Tozzi P., Zamorani G., 2004, ApJ, 617, 746
- Daddi et al. (2008) Daddi E., Dannerbauer H., Elbaz D., Dickinson M., Morrison G., Stern D., Ravindranath S., 2008, ApJL, 673, L21
- Danielson et al. (2010) Danielson A. L. R., Swinbank A. M., Smail I., Cox P., Edge A. C., Weiss A., Harris A. I., Baker A. J., De Breuck C., Geach J. E., Ivison R. J., Krips M., Lundgren A., Longmore S., Neri R., Flaquer B. O., 2010, MNRAS, pp 1565–+
- Dannerbauer et al. (2009) Dannerbauer H., Daddi E., Riechers D. A., Walter F., Carilli C. L., Dickinson M., Elbaz D., Morrison G. E., 2009, ApJL, 698, L178
- Dasyra et al. (2006) Dasyra K. M., Tacconi L. J., Davies R. I., Genzel R., Lutz D., Naab T., Burkert A., Veilleux S., Sanders D. B., 2006, ApJ, 638, 745
- Davé et al. (2010) Davé R., Finlator K., Oppenheimer B. D., Fardal M., Katz N., Kereš D., Weinberg D. H., 2010, MNRAS, 404, 1355
- Dekel et al. (2009) Dekel A., Birnboim Y., Engel G., Freundlich J., Goerdt T., Mumcuoglu M., Neistein E., Pichon C., Teyssier R., Zinger E., 2009, Nature, 457, 451
- Dey et al. (2008) Dey A., Soifer B. T., Desai V., Brand K., Le Floc’h E., Brown M. J. I., Jannuzi B. T., Armus L., Bussmann S., Brodwin M., Bian C., Eisenhardt P., Higdon S. J., Weedman D., Willner S. P., 2008, ApJ, 677, 943
- Dib et al. (2006) Dib S., Bell E., Burkert A., 2006, ApJ, 638, 797
- Dowell et al. (2003) Dowell C. D., Allen C. A., Babu R. S., Freund M. M., Gardner M., Groseth J., Jhabvala M. D., Kovacs A., Lis D. C., Moseley Jr. S. H., Phillips T. G., Silverberg R. F., Voellmer G. M., Yoshida H., 2003, in T. G. Phillips & J. Zmuidzinas ed., Society of Photo-Optical Instrumentation Engineers (SPIE) Conference Series Vol. 4855 of Society of Photo-Optical Instrumentation Engineers (SPIE) Conference Series, SHARC II: a Caltech submillimeter observatory facility camera with 384 pixels. pp 73–87
- Downes & Solomon (1998) Downes D., Solomon P. M., 1998, ApJ, 507, 615
- Eales et al. (2000) Eales S., Lilly S., Webb T., Dunne L., Gear W., Clements D., Yun M., 2000, AJ, 120, 2244
- Elmegreen (1999) Elmegreen B. G., 1999, ApJ, 517, 103
- Engel et al. (2010) Engel H., et al., 2010, ApJ, 724, 233
- Erb et al. (2006) Erb D. K., Steidel C. C., Shapley A. E., Pettini M., Reddy N. A., Adelberger K. L., 2006, ApJ, 647, 128
- Fan et al. (2001) Fan X., et al., 2001, AJ, 121, 54
- Fixsen et al. (1999) Fixsen D. J., Bennett C. L., Mather J. C., 1999, ApJ, 526, 207
- Fomalont et al. (2006) Fomalont E. B., Kellermann K. I., Cowie L. L., Capak P., Barger A. J., Partridge R. B., Windhorst R. A., Richards E. A., 2006, ApJS, 167, 103
- Frayer et al. (1999) Frayer D. T., Ivison R. J., Scoville N. Z., Evans A. S., Yun M. S., Smail I., Barger A. J., Blain A. W., Kneib J., 1999, ApJL, 514, L13
- Gao & Solomon (2004) Gao Y., Solomon P. M., 2004, ApJ, 606, 271
- Genzel et al. (2003) Genzel R., Baker A. J., Tacconi L. J., Lutz D., Cox P., Guilloteau S., Omont A., 2003, ApJ, 584, 633
- Genzel et al. (2008) Genzel R., et al., 2008, ApJ, 687, 59
- Goto et al. (2010) Goto T., et al., 2010, A&A, 514, A6+
- Greve et al. (2005) Greve T. R., Bertoldi F., Smail I., Neri R., Chapman S. C., Blain A. W., Ivison R. J., Genzel R., Omont A., Cox P., Tacconi L., Kneib J., 2005, MNRAS, 359, 1165
- Greve et al. (2008) Greve T. R., Pope A., Scott D., Ivison R. J., Borys C., Conselice C. J., Bertoldi F., 2008, MNRAS, 389, 1489
- Hainline et al. (2006) Hainline L. J., Blain A. W., Greve T. R., Chapman S. C., Smail I., Ivison R. J., 2006, ApJ, 650, 614
- Hainline et al. (2009) Hainline L. J., Blain A. W., Smail I., Frayer D. T., Chapman S. C., Ivison R. J., Alexander D. M., 2009, ApJ, 699, 1610
- Helou et al. (1985) Helou G., Soifer B. T., Rowan-Robinson M., 1985, ApJL, 298, L7
- Hinshaw et al. (2009) Hinshaw G., et al., 2009, ApJS, 180, 225
- Ivison et al. (2007) Ivison R. J., Chapman S. C., Faber S. M., Smail I., Biggs A. D., Conselice C. J., Wilson G., Salim S., Huang J., Willner S. P., 2007, ApJL, 660, L77
- Ivison et al. (2010a) Ivison R. J., et al., 2010a, MNRAS, 402, 245
- Ivison et al. (2010b) Ivison R. J., et al., 2010b, A&A, 518, L31+
- Ivison et al. (2010c) Ivison R. J., et al., 2010c, ArXiv e-prints
- Ivison et al. (2002) Ivison R. J., Greve T. R., Smail I., Dunlop J. S., Roche N. D., Scott S. E., Page M. J., Stevens J. A., Almaini O., Blain A. W., Willott C. J., Fox M. J., Gilbank D. G., Serjeant S., Hughes D. H., 2002, MNRAS, 337, 1
- Kennicutt (1998) Kennicutt Jr. R. C., 1998, ApJ, 498, 541
- Kovács et al. (2006) Kovács A., Chapman S. C., Dowell C. D., Blain A. W., Ivison R. J., Smail I., Phillips T. G., 2006, ApJ, 650, 592
- Lawrence et al. (1989) Lawrence A., Rowan-Robinson M., Leech K., Jones D. H. P., Wall J. V., 1989, MNRAS, 240, 329
- Melnick & Mirabel (1990) Melnick J., Mirabel I. F., 1990, A&A, 231, L19
- Menéndez-Delmestre et al. (2009) Menéndez-Delmestre K., Blain A. W., Smail I., Alexander D. M., Chapman S. C., Armus L., Frayer D., Ivison R. J., Teplitz H., 2009, ApJ, 699, 667
- Miyazaki et al. (2002) Miyazaki S., Komiyama Y., Sekiguchi M., Okamura S., Doi M., Furusawa H., Hamabe M., Imi K., Kimura M., Nakata F., Okada N., Ouchi M., Shimasaku K., Yagi M., Yasuda N., 2002, PASJ, 54, 833
- Monaco (2004) Monaco P., 2004, MNRAS, 352, 181
- Morrison et al. (2008) Morrison G., Dickinson M., Owen F., Daddi E., Chary R., Bauer F., Mobasher B., MacDonald E., Koekemoer A., Pope A., 2008, in R.-R. Chary, H. I. Teplitz, & K. Sheth ed., Infrared Diagnostics of Galaxy Evolution Vol. 381 of Astronomical Society of the Pacific Conference Series, The GOODS-North Radio Galaxies: On the Origin of the Radio Emission. pp 376–+
- Mushotzky et al. (2000) Mushotzky R. F., Cowie L. L., Barger A. J., Arnaud K. A., 2000, Nature, 404, 459
- Muxlow et al. (2005) Muxlow T. W. B., Richards A. M. S., Garrington S. T., Wilkinson P. N., Anderson B., Richards E. A., Axon D. J., Fomalont E. B., Kellermann K. I., Partridge R. B., Windhorst R. A., 2005, MNRAS, 358, 1159
- Narayanan et al. (2009) Narayanan D., Cox T. J., Hayward C. C., Younger J. D., Hernquist L., 2009, MNRAS, 400, 1919
- Neri et al. (2003) Neri R., Genzel R., Ivison R. J., Bertoldi F., Blain A. W., Chapman S. C., Cox P., Greve T. R., Omont A., Frayer D. T., 2003, ApJL, 597, L113
- Noeske et al. (2007) Noeske K. G., et al., 2007, ApJL, 660, L43
- Pope et al. (2008) Pope A., Bussmann R. S., Dey A., Meger N., Alexander D. M., Brodwin M., Chary R., Dickinson M. E., Frayer D. T., Greve T. R., Huynh M., Lin L., Morrison G., Scott D., Yan C., 2008, ApJ, 689, 127
- Pope et al. (2006) Pope A., Scott D., Dickinson M., Chary R., Morrison G., Borys C., Sajina A., Alexander D. M., Daddi E., Frayer D., MacDonald E., Stern D., 2006, MNRAS, 370, 1185
- Reddy et al. (2006) Reddy N. A., Steidel C. C., Erb D. K., Shapley A. E., Pettini M., 2006, ApJ, 653, 1004
- Reddy et al. (2008) Reddy N. A., Steidel C. C., Pettini M., Adelberger K. L., Shapley A. E., Erb D. K., Dickinson M., 2008, ApJS, 175, 48
- Richards (2000) Richards E. A., 2000, ApJ, 533, 611
- Richards et al. (2006) Richards G. T., et al., 2006, AJ, 131, 2766
- Riechers et al. (2006) Riechers D. A., Walter F., Carilli C. L., Knudsen K. K., Lo K. Y., Benford D. J., Staguhn J. G., Hunter T. R., Bertoldi F., Henkel C., Menten K. M., Weiss A., Yun M. S., Scoville N. Z., 2006, ApJ, 650, 604
- Sanders & Mirabel (1996) Sanders D. B., Mirabel I. F., 1996, ARA&A, 34, 749
- Sanders et al. (1988) Sanders D. B., Soifer B. T., Elias J. H., Madore B. F., Matthews K., Neugebauer G., Scoville N. Z., 1988, ApJ, 325, 74
- Scoville et al. (1995) Scoville N. Z., Yun M. S., Brown R. L., Vanden Bout P. A., 1995, ApJL, 449, L109+
- Solomon et al. (1997) Solomon P. M., Downes D., Radford S. J. E., Barrett J. W., 1997, ApJ, 478, 144
- Solomon & Sage (1988) Solomon P. M., Sage L. J., 1988, ApJ, 334, 613
- Steidel et al. (2004) Steidel C. C., Shapley A. E., Pettini M., Adelberger K. L., Erb D. K., Reddy N. A., Hunt M. P., 2004, ApJ, 604, 534
- Swinbank et al. (2008) Swinbank A. M., Lacey C. G., Smail I., Baugh C. M., Frenk C. S., Blain A. W., Chapman S. C., Coppin K. E. K., Ivison R. J., Gonzalez J. E., Hainline L. J., 2008, MNRAS, 391, 420
- Tacconi et al. (2008) Tacconi L. J., et al., 2008, ApJ, 680, 246
- Tacconi et al. (2010) Tacconi L. J., et al., 2010, Nature, 463, 781
- Tacconi et al. (2006) Tacconi L. J., Neri R., Chapman S. C., Genzel R., Smail I., Ivison R. J., Bertoldi F., Blain A., Cox P., Greve T., Omont A., 2006, ApJ, 640, 228
- Thomasson (1986) Thomasson P., 1986, QJRAS, 27, 413
- Thompson et al. (2005) Thompson T. A., Quataert E., Murray N., 2005, ApJ, 630, 167
- Ueda et al. (2008) Ueda Y., Watson M. G., Stewart I. M., Akiyama M., Schwope A. D., Lamer G., Ebrero J., Carrera F. J., Sekiguchi K., Yamada T., Simpson C., Hasinger G., Mateos S., 2008, ApJS, 179, 124
- Veilleux et al. (2009) Veilleux S., Rupke D. S. N., Kim D., Genzel R., Sturm E., Lutz D., Contursi A., Schweitzer M., Tacconi L. J., Netzer H., Sternberg A., Mihos J. C., Baker A. J., Mazzarella J. M., Lord S., Sanders D. B., Stockton A., Joseph R. D., Barnes J. E., 2009, ApJS, 182, 628
- Weingartner & Draine (2001) Weingartner J. C., Draine B. T., 2001, ApJ, 548, 296
- Weiß et al. (2007) Weiß A., Downes D., Neri R., Walter F., Henkel C., Wilner D. J., Wagg J., Wiklind T., 2007, A&A, 467, 955
- Weiss et al. (2007) Weiss A., Downes D., Walter F., Henkel C., 2007, in A. J. Baker, J. Glenn, A. I. Harris, J. G. Mangum, & M. S. Yun ed., From Z-Machines to ALMA: (Sub)Millimeter Spectroscopy of Galaxies Vol. 375 of Astronomical Society of the Pacific Conference Series, CO Line SEDs of High-Redshift QSOs and Submm Galaxies. pp 25–+
- Wiebe et al. (2009) Wiebe D. V., et al., 2009, ApJ, 707, 1809
- Yun et al. (2001) Yun M. S., Reddy N. A., Condon J. J., 2001, ApJ, 554, 803