Peter Grassl111Corresponding author. Email: grassl@civil.gla.ac.uk, Department of Civil Engineering, University of Glasgow, G12 8LT Glasgow, United Kingdom. and Chris Pearce222Department of Civil Engineering, University of Glasgow, G12 8LT Glasgow, United Kingdom.
Accepted in Journal of Engineering Mechanics-ASCE
30th October 2009
CE Database subject headings: Concrete, Cracking, Thermal analysis, Plasticity
Abstract
Concrete subjected to combined compressive stresses and temperature loading exhibits compressive strains, which are considerably greater than for concrete subjected to compressive stresses alone. This phenomenon is called transient thermal creep or load induced thermal strain and is usually modeled by macroscopic phenomenological constitutive laws which have only limited predictive capabilities. In the present study a meso-scale modeling approach is proposed in which the macroscopically observed transient thermal creep results from the mismatch of thermal expansions of the meso-scale constituents. The meso-structure of concrete is idealized as a two-dimensional three phase material consisting of aggregates, matrix and interfacial transition zones (ITZ). The nonlinear material response of the phases are described by a damage-plasticity interface model. The meso-scale approach was applied to analyze compressed concrete specimens subjected to uniform temperature histories and the analysis results were compared to experimental results reported in the literature.
Introduction
The mechanical behaviour of concrete is significantly altered when exposed to high temperatures, whereby properties such as strength and stiffness are generally found to decrease with temperature and time dependent creep characteristics are found to be significantly enhanced. Experimental evidence also suggests that strength, stiffness and creep depend on the combined mechanical and thermal loading history.
When an unloaded concrete specimen is subjected to transient high temperatures it undergoes thermal expansion. When the same test is performed under sustained mechanical load, the total strains, minus the elastic strains, are significantly different from those observed in the unloaded case [Khoury, Grainger, and Sullivan 1985, Thelandersson 1987, Schneider 1988]. This difference in the strains is normally referred to as transient thermal creep or load induced thermal strain. It is worth noting that the use of the word ’creep’ is a subject for debate, since transient thermal creep is not time-dependent, as is the case for other forms of creep; for consistency with other work on this subject, the term ’creep’ will continue to be used in this paper.
Transient thermal creep is an irreversible thermo-mechanical strain, only observed on first heating and is considered a quasi-instantaneous response [Khoury, Grainger, and Sullivan 1985, Thelandersson 1987]. It is generally recognized that its presence provides an important relaxation of compressive stresses when concrete is heated beyond ∘C.
However, the irreversibility of transient thermal creep can lead to the build-up of potentially critical tensile strains in restrained concrete members during cooling [Nielsen, Pearce, and Bicanic 2002]. Recent experimental studies by Colina et al. [Colina and Sercombe 2004, Hassen and Colina 2006, Sabeur, Meftah, Colina, and Platret 2008] performed at very slow heating rates up to temperatures of ∘C have provided further confirmation of the existence of transient thermal creep as well as the principal characteristics outlined above. They also hypothesized that the phenomenon depends only on irrecoverable physical and chemical processes that take place due to increase of temperature. [Colina and Sercombe 2004] also identified that transient thermal creep is less in ordinary concrete (OC), which is characterized by higher permeability, compared to that of high performance concrete (HPC) with lower permeability. [Hassen and Colina 2006, Sabeur, Meftah, Colina, and Platret 2008] concluded that dehydration of the cement paste is one of the critical processes in the development of transient thermal creep.
There have been a number of efforts to phenomenologically model transient thermal creep strains during combined thermal and mechanical loading. Thelandersson [Thelandersson 1982] and Schneider [Schneider 1988] suggested uniaxial expressions for the transient thermal creep, with the former applying the theory of plasticity and extending the model to 3D. Khennane and Baker [Khennane and Baker 1992, Khennane and Baker 1993] also adopted the theory of plasticity and based their numerical implementation of transient thermal creep on the work of de Borst and Peeters [de Borst and Peeters 1989]. Thelandersson [Thelandersson 1987] proposed a general 3D model that has been adopted by a number of authors (e.g. [Nechnech, Meftah, and Reynouard 2002]), but it is frequently unclear how the critical transient thermal creep parameter has been determined. Nielsen et al. [Nielsen, Pearce, and Bicanic 2002] derived the transient thermal creep parameter from experimental data reported by Schneider [Schneider 1988] and Khoury et al. [Khoury, Grainger, and Sullivan 1985]. This model was subsequently implemented into a continuum Finite Element formulation by Pearce et al. [Pearce, Nielsen, and Bicanic 2002]. Gawin et al. [Gawin, Pesavento, and Schrefler 2004, Gawin, Pesavento, and Schrefler 2006] adopted a similar approach, although they related the transient thermal creep strains to a thermo-chemical damage parameter rather than temperature. Bažant and Chern [Bažant and Chern 1987] extended their original creep model to include the effect of temperature alterations, suggesting that both heating and cooling result in transient thermal creep. Thienel and Rostasy [Thienel and Rostasy 1996] proposed a general constitutive model for transient thermal strains based on their own experimental biaxial results. Youssef and Moftah [Youssef and Moftah 2007] have undertaken a comparison of a number of phenomenological models for transient thermal creep.
In general, the mechanics of concrete subjected to temperature loading are not well understood and the macroscopic phenomenological constitutive models which are based on existing experimental results cannot be relied upon to predict the structural response outside the range of these experiments. Furthermore, there is still dispute about the importance of moisture, drying shrinkage and differences in the thermal properties of the constituents of the meso-structure. The authors believe that a detailed study of the meso- and micro-structural behavior of concrete can help in resolving this matter by allowing the mechanisms which dominate the macroscopic response to be isolated. Recent promising research in this direction explored the macroscopic transient thermal creep of concrete via a two-phase meso-scale modeling approach which considered the thermal expansion and the thermal damage of the elastic properties [Willam, Rhee, and Shing 2004, Willam, Rhee, and Xi 2005, Grondin, Dumontet, Ben Hamida, Mounajed, and Boussa 2007].
In the present work, a different meso-scale description is adopted, in which the meso-structure is enhanced by an additional phase, which represents the interfacial transition zone (ITZ) between the aggregates and the matrix. The macroscopic transient thermal creep is described by the nonlinear mechanical response, which is caused by the mismatch of thermal expansion of the different phases. The aim of the present study is to show that this mismatch of expansion has an important influence on the macroscopically observed transient thermal creep.
The long term aim of the present research is to improve the understanding of the macroscopic response of concrete subjected to temperature loading by investigating the influence of different processes on the meso and micro-scale. The present manuscript is focused on the nonlinear response due to the mismatch of thermal expansion on the meso-scale. Further work will be required to investigate other influences, e.g. moisture, creep and relaxation on micro and meso-scale. The present study is only a first step towards an understanding of the mechanisms that cause transient thermal creep.
Meso-scale modeling of strongly heterogeneous materials like concrete is computationally very demanding. Continuum formulations for the description of fracture, especially at the interface between materials of significantly different stiffness, is difficult and can be accompanied by severe numerical problems. Therefore, a lattice approach is applied in the present study [Bolander and Saito 1998, Kawai 1977, Morikawa, Sawamota, and Kobayashi 1993]. The heterogeneity of the material is described by spatially varying material properties of the lattice elements with respect to their position within the meso-structure [Schlangen and van Mier 1992, Lilliu and van Mier 2003], which is composed of aggregates, matrix and ITZs. It is recognised that each of the three phases comprise a complex microstructure. However, in the present study the response of these phases is described by phenomenological constitutive models. Alternatively, for at least some of these phases, micromechanics approaches could be used [Budiansky and O’Connell 1976, Heukamp, Lemarchand, and Ulm 2005, Dormieux, Kondo, and Ulm 2006].
Modeling approach
The present approach to modeling the response of concrete subjected to combined thermal and mechanical loading is based on a meso-scale description. Aggregates, matrix and interfacial transition zones are modeled as separate phases with different material properties. A lattice approach is used to discretize the domain. For each lattice element, a nonlinear stress-strain relationship based on a combination of damage and plasticity is used. This damage-plasticity constitutive model was originally proposed for the modeling of concrete subjected to cyclic loading [Grassl and Rempling 2008] and is extended in the present study to describe the influence of thermal expansion.
Lattice framework
The domain is decomposed into polygons based on the Voronoi tessellation [Aurenhammer 1991]. The nodes for the Voronoi tessellation are placed sequentially in the domain, whereby the coordinates of each node are determined randomly. A minimum distance is enforced iteratively between the nodes. For each randomly placed node the distance to the existing nodes is checked. Only if the smallest distance between two nodes is greater than the prescribed minimum distance, is the node accepted [Zubelewicz and Bažant 1987].
For this iterative process, the relationship between the number of nodes for a chosen domain and the minimum distance determines the distribution of the distances between nodes. The number of nodes for a minimum distance and domain size is expressed in the form of a density
| (1) |
If the density of the nodes is small, the variation of Voronoi cell sizes is large. On the other hand, if the domain is saturated with nodes, i.e. maximum number of nodes for a specific domain and minimum distance, the Voronoi cells are of similar size. Bolander and Saito [Bolander and Saito 1998] determined numerically the density for a saturated node arrangement to be . The dual to the Voronoi tessellation is the Delaunay triangulation shown in Figure 1a. The edges of the Delaunay triangulation are the lattice elements, which describe the interaction between the nodes.
 |
 |
| (a) | (b) |
The use of an irregular lattice for the description of the fracture process of quasi-brittle materials is important, since the fracture patterns are strongly influenced by the alignment of the lattice [Jirásek and Bažant 1995, Schlangen and Garboczi 1996]. Related problems are known from continuum fracture approaches, where mesh alignment can have a strong influence on the fracture patterns obtained [Grassl and Jirásek 2004, Grassl and Rempling 2007, Jirásek and Grassl 2008].
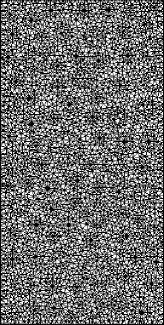
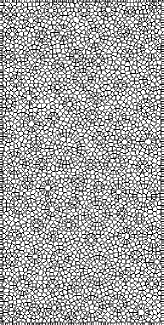
The meso-structure of concrete is discretized by placing lattice elements perpendicular to the interface between aggregates and the matrix. In Figure 1b, a schematic meso-structure and the corresponding discretization is shown.
The distribution of the aggregates is determined randomly using a cumulative distribution function [Carpinteri, Cornetti, and Puzzi 2004]. A standard pseudo-random number generator is used to generate probabilities from which the diameter is determined. This procedure is repeated until the chosen volume fraction of aggregates is obtained. In the present 2D idealisation, aggregates are idealized as cylindrical inclusions of diameter . The aggregates are placed sequentially by means of randomly generated coordinates within the area of the specimen. For each set of generated coordinates it is checked that no overlap with existing aggregates occurs. However, overlaps with boundaries are permitted.
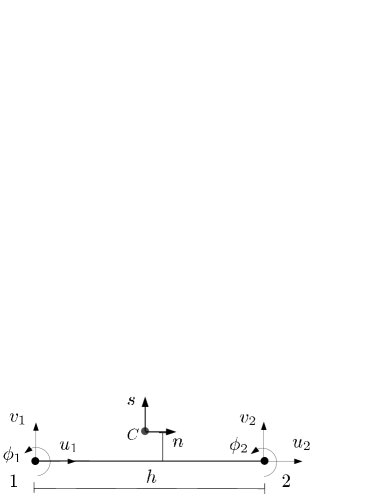
The lattice elements describe the elastic and inelastic response of concrete, i.e. both the elastic and inelastic displacements are described by the displacement jump between rigid bodies. Each rigid body possesses two translations and one rotation. In the local coordinate system ( and ), shown in Figure 2, the degrees of freedom of two rigid bodies sharing an interface describe the displacement discontinuities at the mid point of the interface, where the springs are located by the relation
| (2) |
where
| (3) |
 |
 |
| (a) | (b) |
In Equation (3), is related to the eccentricity of the mid-point with respect to the element axis and is the length of the element (Figure 2). If is on the left hand side of the element, is positive. Otherwise, is negative. The displacements at the point are transformed into strains . The strain is related to the stress by the constitutive model of the springs, which is described in the following section.
The stiffness matrix of a lattice element in the local coordinate system results in
| (4) |
where is the cross sectional area of the common interface of the two rigid bodies.
Constitutive model
In the present study the response of concrete is analyzed with an interface model, which was developed in [Grassl and Rempling 2008] for cyclic loading and extended here to include thermal loading. In the following, the modeling approach is briefly reviewed to introduce the parameters, which are investigated in the present study. The interface model relies on stress based elasto-plasticity. The strains are related to the stress as
| (5) |
where is the elastic stiffness, is the plastic strain. The mechanical strain is defined as
| (6) |
where the thermal strains are
| (7) |
The parameter is the temperature within the specimen and is the reference temperature. The thermal expansion coefficient is chosen as a function of the temperature:
| (8) |
where , and are model parameters.
The elastic stiffness is
| (9) |
where and are model parameters controlling both the Young’s modulus and Poisson’s ratio of the material [Griffiths and Mustoe 2001].
The small strain plasticity model consists of the yield surface, flow rule, evolution law for the hardening parameter and loading and unloading conditions. A detailed description of the components of the plasticity model is presented in [Grassl and Rempling 2008]. The initial yield surface is determined by the tensile strength , by the ratio of the shear and tensile strength, and the ratio of the compressive and tensile strength. The evolution of the yield surface during softening is controlled so that linear stress inelastic displacement laws for pure tension and compression are obtained, which are characterized by the fracture energies and . The eight model parameters , , , , , and can be determined from a tensile, shear and compressive test of the material phase. The constitutive response of the interface model is demonstrated by the stress-strain response for fluctuating normal strains in Figure 3. The normal strain is increased to point . Then the strain is reduced to point and again increased to point .

Structural analysis
The lattice modeling approach is applied to the meso-scale analysis of the macroscopic phenomenon of transient thermal creep. Experimental results performed by Thelandersson and reported in [Thelandersson 1987] show that there is no significant influence of the rate of temperature increase for rates of C/min and C/min. This indicates that the temperature loading in these experiments is slow enough to neglect the influence of the thermal capacity of the materials. Therefore, the thermal analysis was simplified by assuming a uniform temperature increase throughout the specimen, disregarding the thermal conductivity and capacity, which may differ significantly for the three phases and may play an important role for increased heating rates.
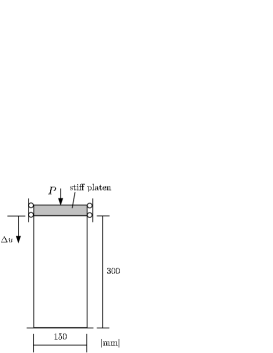
A concrete prism was idealized by a two-dimensional discretization under the assumption of plane stress. The height and width of the specimen was chosen as mm and mm, respectively. The mesh was generated with a vertex density of and a minimum distance of mm. The distribution of aggregates distribution was obtained with mm, mm and an aggregate volume fraction of . Aggregates of a diameter less than 10 mm are not modelled discretely. The geometry, loading setup and mesh is shown in Figure 4.
 |
 |
 |
 |
| (a) | (b) | (c) | (d) |
Three types of loading situations were investigated. Firstly, the concrete specimen was subjected to monotonic uniaxial compression at ambient temperature. Secondly, the specimen was heated while subject to various levels of constant uniaxial compressive stress. Thirdly, the specimen was subjected to uniform heating under uniaxial restraint. The results of the latter two loading scenarios were compared to experimental results obtained by Thelandersson and reported in [Thelandersson 1987].
Uniaxial compression
The uniaxial compression analysis was controlled by the top displacement . The average strain is determined as . The average stress is determined as /, where is the reaction force caused by the top displacement .
The model parameters for the mechanical part of the model are presented in Table 1.
| [GPa] | [MPa] | [J/m2] | [J/m2] | |||||
| Matrix | ||||||||
| ITZ | ||||||||
| Aggregates | - | - | - | - | - | - |
The parameters were chosen to obtain a macroscopic elastic stiffness of GPa, a compressive strength of MPa and an inelastic strain at peak of , which were reported in [Thelandersson 1982]. The stress-strain response is shown in Figure 5. The fracture patterns obtained at four stages of the analysis marked in Figure 5 are shown in Figure 6.

At an early stage within the pre-peak regime, the cracks are mainly restricted to the aggregate-matrix interface and are perpendicular to the loading direction (Figure 6a). Around the peak load (Figures 6b and c), the interfaces between aggregates and matrix become strongly damaged and cracks occur in the matrix phase, which are orientated parallel to the direction of the compressive stress. A similar direction of crack-propagation was observed in [Pichler, Hellmich, and Dormieux 2007] for the case of penny-shaped cracks embedded in an elastic matrix. At a later stage the cracks localize into a shear band (Figure 6d), while the surrounding material unloads.
 |
 |
 |
 |
| (a) | (b) | (c) | (d) |
The plasticity constitutive model limits the strength in tension, shear and compression (Figure 3). In the uniaxial compressive test, failure in the matrix is entirely caused by tensile/low shear stress states. However, the compressive strength in the ITZs is reached in the pre-peak regime of the macroscopic load-displacement curve.
Heating under various compressive loads
The second group of tests consists of two steps. First a uniaxial compression stress is applied. Then, this stress is kept constant and the temperature is increased from ∘C to ∘C, while the strain in the axial direction is recorded. These tests are carried out for four stress levels of and .
The thermal expansion coefficients for the matrix, interface and aggregates are presented in Table 2. The Matrix and ITZ phase initially expands and then contracts for higher temperatures [Khoury, Grainger, and Sullivan 1985], corresponding to dehydration of the phases.
| [] | [] | [] | |
| Matrix | |||
| ITZ | |||
| Aggregates |
All other parameters are the same as in the previous section. The thermal expansion coefficients of the three phases were determined from a fit of the model response to the experimental results for free expansion (). All other analyses are carried out with these parameters and no additional fits were performed. Thus, the analysis for , and are model predictions. The strain-temperature curves obtained with the meso-scale approach are compared to the experimental curves reported in [Thelandersson 1987] in Figure 7.

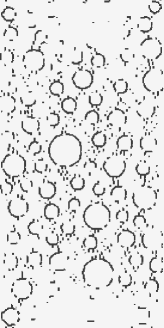
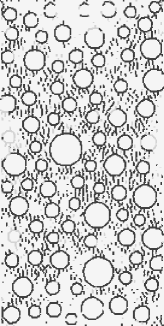
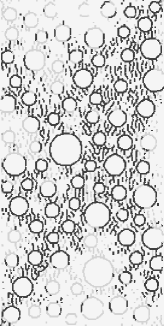
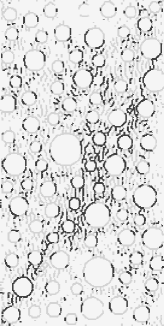
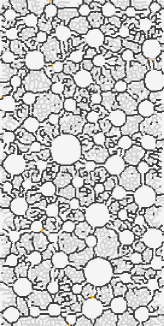
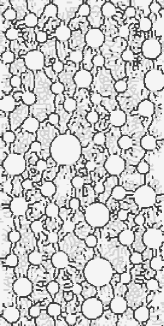
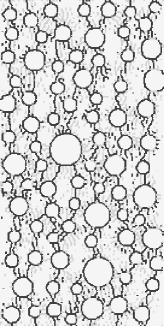
The fracture patterns for the four different loading cases at a late stage of analysis marked in Figure 7 are shown in Figure 8.
 |
 |
 |
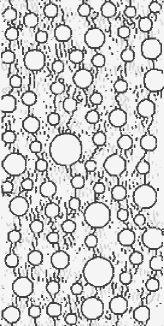 |
| (a) | (b) | (c) | (d) |
For the case of free expansion () cracks in the matrix propagate radially outwards from the aggregate inclusions due to the thermal incompatibility of the different phases. For the other analyses, the crack orientations are influenced by the applied compressive stresses. For a stress level of the majority of the damaged interfaces in the matrix phase are parallel to the loading direction.
Heating under uniaxial restraint
The specimen is restrained in the axial direction and the temperature is increased from the ambient temperature ∘C to ∘C. The same material properties as in the previous example were used. The normalized average stress obtained from the meso-scale analysis is plotted against temperature in Figure 9 and compared with the experimental results of Thelandersson reported in [Thelandersson 1987]. Initially, the compressive stresses increase with increasing temperature until approximately ∘C and then reduce with further temperature increase. It should be noted that the model parameters adopted are not fitted to match the experimental results. Nevertheless, the meso-scale modeling approach in this work qualitatively captures the response observed in the experiments.

 |
 |
| (a) | (b) |
Macroscopic thermal damage
Finally, the capabilities of the meso-scale approach are further illustrated by evaluating the stiffness at different stages of heating without any restraints. The temperature is increased and a small uniaxial stress increment is applied at different temperature levels to determine the stiffness of the material in the axial direction. The macroscopic stiffness is computed as
| (10) |
The stiffness obtained at ambient temperature is used as reference stiffness to compute the macroscopic thermal damage during heating as
| (11) |
The evolution of the macroscopic thermal damage during heating is presented in Figure 11.

Conclusions
This paper presents a three-phase meso-scale approach to modelling concrete subjected to thermo-mechanical loading. An elasto-plasticity model for the mortar and interfacial transition zones is adopted that is able to describe the fracture process of concrete in compression. The model is also capable of qualitatively describing the main characteristics of concrete subjected to combined thermo-mechanical loading and the results indicate that the mismatch of thermal expansion has a strong influence on the thermal transient creep. Moreover, the path-dependence of the thermo-mechanical loading is described qualitatively correctly by the model. It is worth reiterating that, unlike other approaches, no phenomenological thermal damage mechanism is introduced to model the experimentally observed results, although phenomenological models for mechanical damage and thermal expansion of the individual phases are required. The present study is only a first step in a longer research project and further studies are required to investigate the influences of moisture and basic creep on thermal transient creep and the results will be presented in future publications.
Acknowledgments
The simulations were performed with the object-oriented finite element package OOFEM [Patzák 1999, Patzák and Bittnar 2001] extended by the present authors. The mesh has been prepared with the mesh generator Triangle [Shewchuk 1996].
References
- Aurenhammer 1991 Aurenhammer, F. (1991). Voronoi diagrams - a survey of a fundamental geometric data structure. ACM Computing Surveys 23, 345–405.
- Bažant and Chern 1987 Bažant, Z. P. and Chern, J. C. (1987). Stress-induced thermal and shrinkage strains in concrete. Journal of Engineering Mechanics, ASCE 113, 1493–1511.
- Bolander and Saito 1998 Bolander, J. E. and Saito, S. (1998). Fracture analysis using spring networks with random geometry. Engineering Fracture Mechanics 61, 569–591.
- Budiansky and O’Connell 1976 Budiansky, B. and O’Connell, R. (1976). Elastic moduli of a cracked solid. International Journal of Solids and Structures 12(2), 81–97.
- Carpinteri, Cornetti, and Puzzi 2004 Carpinteri, A., Cornetti, P., and Puzzi, S. (2004). A stereological analysis of aggregate grading and size effect on concrete tensile strength. International Journal of Fracture 128, 233–242.
- Colina and Sercombe 2004 Colina, H. and Sercombe, J. (2004). Transient thermal creep of concrete in service conditions at temperatures up to 300 degrees C. Magazine of Concrete Research 56(10), 559–574.
- de Borst and Peeters 1989 de Borst, R. and Peeters, P. (1989). Analysis of concrete structures under thermal loading. Computer Methods in Applied Mechanics and Engineering 77, 293–310.
- Dormieux, Kondo, and Ulm 2006 Dormieux, L., Kondo, D., and Ulm, F. (2006). Microporomechanics. Wiley.
- Gawin, Pesavento, and Schrefler 2004 Gawin, D., Pesavento, F., and Schrefler, B. (2004). Modelling of deformations of high strength concrete at elevated temperatures. Materials and Structures 37(4), 218–236.
- Gawin, Pesavento, and Schrefler 2006 Gawin, D., Pesavento, F., and Schrefler, B. (2006). Modelling damage processes of concrete at high temperature with thermodynamics of multi-phase porous media. Journal of theoretical and applied mechanics 44(3), 505–532.
- Gawin, Pesavento, and Schrefler 2003 Gawin, D., Pesavento, F., and Schrefler, B. A. (2003). Modelling of hygro-thermal behaviour of concrete at high temperature with thermo-chemical and mechanical material degredation. Computer Methods in Applied Mechanics and Engineering 192, 1731–1771.
- Grassl and Jirásek 2004 Grassl, P. and Jirásek, M. (2004). On mesh bias of local damage models for concrete. In V. Li, C. K. Y. Leung, K. J. Willam, and S. L. Billington (Eds.), Fracture Mechanics of Concrete Structures, pp. 323–337.
- Grassl and Rempling 2007 Grassl, P. and Rempling, R. (2007). Influence of volumetric-deviatoric coupling on crack prediction in concrete fracture tests. Engineering Fracture Mechanics 74, 1683–1693.
- Grassl and Rempling 2008 Grassl, P. and Rempling, R. (2008). A damage-plasticity interface approach to the meso-scale modelling of concrete subjected to cyclic compressive loading. Engineering Fracture Mechanics 75, 4804–4818.
- Griffiths and Mustoe 2001 Griffiths, D. V. and Mustoe, G. G. W. (2001). Modelling of elastic continua using a grillage of structural elements based on discrete element concepts. International Journal for Numerical Methods in Engineering 50, 1759–1775.
- Grondin, Dumontet, Ben Hamida, Mounajed, and Boussa 2007 Grondin, F., Dumontet, H., Ben Hamida, A., Mounajed, G., and Boussa, H. (2007). Multi-scales modelling for the behaviour of damaged concrete. Cement and Concrete Research 37(10), 1453–1462.
- Hassen and Colina 2006 Hassen, S. and Colina, H. (2006). Transient thermal creep of concrete in accidental conditions at temperatures up to 400 degrees C. Magazine of Concrete Research 58(4), 201–208.
- Heukamp, Lemarchand, and Ulm 2005 Heukamp, F. H., Lemarchand, E., and Ulm, F. J. (2005). The effect of interfacial properties on the cohesion of highly filled composite materials. International Journal of Solids and Structures 42(1), 287–305.
- Jirásek and Bažant 1995 Jirásek, M. and Bažant, Z. P. (1995). Particle model for quasibrittle fracture and application to sea ice. Journal of Engineering Mechanics, ASCE 121, 1016–1025.
- Jirásek and Grassl 2008 Jirásek, M. and Grassl, P. (2008). Evaluation of directional mesh bias in concrete fracture simulations using continuum damage models. Engineering Fracture Mechanics 39, 1921–1943.
- Kawai 1977 Kawai, T. (1977). New element models in discrete structural analysis. Journal of Society of Naval Architecture in Japan 141, 187–193.
- Khennane and Baker 1992 Khennane, A. and Baker, G. (1992). Thermoplasticity model for concrete under transient temperature and biaxial stress. Proceedings of the Royal Society of London A 439, 59–80.
- Khennane and Baker 1993 Khennane, A. and Baker, G. (1993). Uniaxial model for concrete under variable temperature and stress. Journal of Engineering Mechanics 119, 1507–1525.
- Khoury, Grainger, and Sullivan 1985 Khoury, G., Grainger, B. N., and Sullivan, P. J. E. (1985). Transient thermal strain of concrete: literature review, conditions within specimen and behaviour of individual constituents. Magazine of Concrete Research 37, 131–144.
- Lilliu and van Mier 2003 Lilliu, G. and van Mier, J. G. M. (2003). 3d lattice type fracture model for concrete. Engineering Fracture Mechanics 70, 927–941.
- Morikawa, Sawamota, and Kobayashi 1993 Morikawa, O., Sawamota, Y., and Kobayashi, N. (1993). Local fracture analysis of a reinforced concrete slab by the discrete element method. In M. Press (Ed.), Proceedings of the 2nd International Conf. on Discrete element methods, pp. 275–286. held in Cambridge, MA, USA.
- Nechnech, Meftah, and Reynouard 2002 Nechnech, W., Meftah, F., and Reynouard, J. (2002). An elasto-plastic damage model for plain concrete subjected to high temperatures. Engineering Structures 24(5), 557–611.
- Nielsen, Pearce, and Bicanic 2002 Nielsen, C. V., Pearce, C. J., and Bicanic, N. (2002). Theoretical model of high temperature effects on uniaxial concrete member under elastic restraint. Magazine of Concrete Research 54, 239–249.
- Patzák 1999 Patzák, B. (1999). Object oriented finite element modeling. Acta Polytechnica 39, 99–113.
- Patzák and Bittnar 2001 Patzák, B. and Bittnar, Z. (2001). Design of object oriented finite element code. Advances in Engineering Software 32, 759–767.
- Pearce, Nielsen, and Bicanic 2002 Pearce, C., Nielsen, C., and Bicanic, N. (2002). Gradient enhanced thermo-mechanical damage model for concrete at high temperatures including transient thermal creep. Engineering Structures 24(5), 557–611.
- Pichler, Hellmich, and Dormieux 2007 Pichler, B., Hellmich, C., and Dormieux, L. (2007). Potentials and limitations of Griffith’s energy release rate criterion for mode I type microcracking in brittle materials. In Bifurcations, instabilities, degradation in geomechanics, Part III, Barcelona, pp. 245–275. Springer.
- Sabeur, Meftah, Colina, and Platret 2008 Sabeur, H., Meftah, F., Colina, H., and Platret, G. (2008). Correlation between transient creep of concrete and its dehydration. Magazine of Concrete Research 60(3), 157–163.
- Schlangen and Garboczi 1996 Schlangen, E. and Garboczi, E. J. (1996). New method for simulating fracture using an elastically uniform random geometry lattice. International Journal of Engineering Science 34(10), 1131–1144.
- Schlangen and van Mier 1992 Schlangen, E. and van Mier, J. G. M. (1992). Simple lattice model for numerical simulation of fracture of concrete materials and structures. Materials and Structures 25, 534–542.
- Schneider 1988 Schneider, U. (1988). Concrete at high temperatures-a general review. Fire Safety Journal 13, 55–68.
- Shewchuk 1996 Shewchuk, J. R. (1996, May). Triangle: Engineering a 2D Quality Mesh Generator and Delaunay Triangulator. In M. C. Lin and D. Manocha (Eds.), Applied Computational Geometry: Towards Geometric Engineering, Volume 1148 of Lecture Notes in Computer Science, pp. 203–222. Springer-Verlag. From the First ACM Workshop on Applied Computational Geometry.
- Thelandersson 1982 Thelandersson, S. (1982). On the multiaxial behaviour of concrete exposed to high temperature. Nuclear Engineering and Design 75, 271–282.
- Thelandersson 1987 Thelandersson, S. (1987). Modeling of combined thermal and mechanical action in concrete. Journal of Engineering Mechanics 113, 893–906.
- Thienel and Rostasy 1996 Thienel, K. C. and Rostasy, F. S. (1996). Transient creep of concrete under biaxial stress and high temperature. Cement and Concrete Research 26, 1409–1422.
- Willam, Rhee, and Shing 2004 Willam, K., Rhee, I., and Shing, B. (2004). Interface damage model for thermomechanical degradation of heterogeneous materials. Computer Methods in Applied Mechanics and Engineering 193(30-32), 3327–3350.
- Willam, Rhee, and Xi 2005 Willam, K., Rhee, I., and Xi, Y. (2005). Thermal Degradation of Heterogeneous Concrete Materials. Journal of Materials in Civil Engineering 17, 276.
- Youssef and Moftah 2007 Youssef, M. and Moftah, M. (2007). General stress–strain relationship for concrete at elevated temperatures. Engineering Structures 29(10), 2618–2634.
- Zubelewicz and Bažant 1987 Zubelewicz, A. and Bažant, Z. P. (1987). Interface modeling of fracture in aggregate composites. Journal of Engineering Mechanics, ASCE 113, 1619–1630.