Light-Induced Atomic Desorption for loading a Sodium Magneto-Optical Trap
Abstract
We report studies of photon-stimulated desorption (PSD), also known as light-induced atomic desorption (LIAD), of sodium atoms from a vacuum cell glass surface used for loading a magneto-optical trap (MOT). Fluorescence detection was used to record the trapped atom number and the desorption rate. We observed a steep wavelength dependence of the desorption process above photon energy, a result significant for estimations of sodium vapor density in the lunar atmosphere. Our data fit well to a simple model for the loading of the MOT dependent only on the sodium desorption rate and residual gas density. Up to Na atoms were confined under ultra-high vacuum conditions, creating promising loading conditions for a vapor cell based atomic Bose-Einstein condensate of sodium.
pacs:
34.50.Cx, 37.10.De, 37.10.Gh, 37.10.Vz, 68.43.Tj, 95.30.Dr, 96.12.Jt, 96.12.MaI Introduction
LIAD (light-induced atomic desorption) is a new tool for producing laser cooled samples of K, Rb and Cs anderson01 ; alexandrov02 ; atutov03 ; aubin05 ; klempt06 . Its primary appeal is the non-thermal nature of the desorption process abramova84 ; meucci94 , which allows for fast switching–the gaseous vapor can be immediately quenched upon shut-off of the light. Even in tiny quantities, residual vapor can dramatically reduce the efficiency of evaporative cooling to Bose-Einstein condensation (BEC), and LIAD has been shown to mitigate this problem shengwang04 . Other solutions to the background vapor problem involve loading from differentially pumped secondary sources such as a dual MOT or slow atomic beam. Typically these are more cumbersome approaches in comparison to a single vapor cell.
In this paper we report the use of LIAD to load a sodium MOT with up to atoms in a pyrex vacuum cell. Moreover, we demonstrate that such a MOT is compatible with vacuum limited lifetimes in the several second range. We present measurements of the wavelength dependence of the LIAD effect, showing that it increases dramatically in the blue to ultraviolet region of the spectrum, consistent with a photoelectric threshold.
Photon-stimulated desorption (PSD) studies of neutral sodium are particularly important for a better understanding of the lunar surface and atmospheric composition. Sunlight irradiating the silicates present on the moon’s surface creates a significant sodium and potassium vapor in the tenuous atmosphere, causing the moon to glow due to emission from the same vapor madey02 . Optically induced desorption studies have been performed on small sodium clusters trager93 , Sapphire bonch90 and SiO2 yakshinskiy99 surfaces, as well as thin organic films atutov03 ; meucci94 ; gozzini93 ; atutov99 ; marinelli06 . Our measurements on atomic sodium are the first to use a MOT to probe PSD, and they may open up the possibility of using laser cooling techniques for chemical identification of lunar samples.
Apart from extraterrestrial applications, we believe our results will contribute to the widening use of vapor cell technology for producing better controlled Na MOTs in the range of tens of millions of atoms wippel01 ; Muhammad08 . Indeed, a recent preprint reports a vapor cell based sodium BEC by rapid evaporation in a dipole trap, demonstrating that Zeeman slower technology is not required mimoun09 . The sodium atom has many favorable properties for Bose-Einstein condensation, including a large ratio of elastic to inelastic scattering rates Moerdijk96 . Its light mass contributes to large quantum mechanical effects, including the Bose-Einstein phase transition temperature, the separation of matter wave interference maxima, Josephson tunneling probability and atomic recoil shift pita03book . These phenomena are all of fundamental importance in addition to their significance for building practical atom optical devices.
II Experiment
We used light from a single mode dye laser (Coherent 899, locked to near the hyperfine components of the D2 line of sodium at 589 nm by saturation spectroscopy) to make a standard retro-reflected three beam magneto-optical trap metc99 . Prior to entry into the vacuum chamber the trap laser beam passes through a electro-optic modulator (New Focus model 4461), which introduces about sidebands on the repumping transition. Typically, of total laser power was used from trapping, split into three independent beams of diameter (laser power and beam diameters chosen to optimize the MOT), and traveling along the X,Y and Z directions. A pair of quadrupole coils created the magnetic field gradient of 20 gauss/cm (at ) along the vertical direction.
The vacuum chamber comprises a Pyrex cell of dimensions 45 45 150 attached to one face of a stainless steel 2 3/4” ConFlat cube (MDC). The cube is also attached to a 20 l/s ion pump and titanium sublimation pump, and could be evacuated through an all-metal seal valve. The titanium sublimation section was added to achieve UHV conditions (pressure below the lower limit of the vacuum gauge, ) and the experiments with HV (pressure ) were done without this additional pump. The overall dimensions of the chamber were 50 55 52 , rendering it light and easily removed for modifications or maintenance.
The sodium source was a set of alkali dispensers from SAES (SAES Alkamax metal dispensers, model NA/NF/1.5/12 FT 10+10, active length , threshold current ). Copper wires extending from a vacuum feedthrough were used to run current to the dispensers as well as to secure them about inside the cell. The actual distance between the MOT and the dispenser could be varied from to by simply translating the vacuum chamber relative to the MOT center. No significant variation of the number of trapped atoms was observed, and therefore during the experiments this distance was fixed around . For the HV experiments, one dispenser was fired at to during experimental runs to fill the cell with sodium. The MOT coil current was used to turn the trap on and off. For UHV, we first fired the same dispenser at no more than for 30 minutes to coat the cell walls and waited for a few hours until the pressure recovered. In this case, a loading sequence was initiated by turning on the LIAD light a few seconds before the coil current was on in order to allow the LED to thermally equilibrate. In both cases, fluorescence from the MOT was recorded by a calibrated photodetector whose output current is proportional to the atom number. The photocurrent was recorded on an oscilloscope and comprised all of the data recorded and presented here. The calibration between photodetector current and atom number can be written as metc99
| (1) |
where is the laser-intensity dependent scattering rate. is the saturation parameter with for Na. was the detuning and is the natural linewidth. The other parameters are the responsivity of the Si photodector at , and the solid angle covered by the photodetector.
With the exception of Figure 5, all data was taken by irradiating the cell walls more or less uniformly using a commercial blue LED (Optotech OT16-5100-RB, , and measured maximum output power).
III Data Analysis
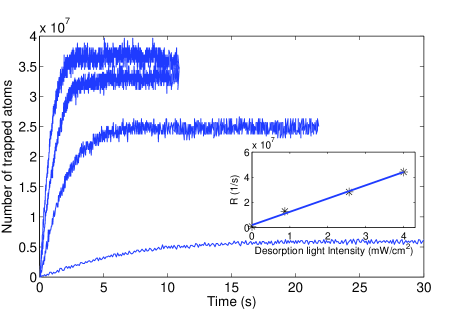
A typical set of loading curves is shown in Figure 1 and demonstrates the photon stimulated desorption of sodium from the cell walls. At 0 the MOT current is turned on. Subsequently, the number of trapped atoms increases and reaches a steady state whose value depends monotonically upon the LIAD intensity. These curves can be analyzed in terms of a simple rate equation model for the number of trapped sodium atoms monr90
| (2) |
where is the MOT loading rate, and are the trap loss rates due to two-body collisions between the captured atoms with fast untrapped Na atoms and with background gases, respectively. We have neglected intra-trap light-assisted collisions which appear as an additional quadratic term in the sodium density and did not play any significant role under our experimental conditions. The exponential solution to Eq. 2 for is , where is the total trap loss rate. Each loading curve was fit to this functional form to extract and . The initial loading rate is then determined as the product of the two extracted parameters .
As elucidated by monr90 , for a vapor cell MOT both the capture rate and the loss rate are proportional to the density of sodium and therefore to each other. Thus we can parameterize for some . From this the extracted fitting parameters take on specific functional forms
| (3) |
and
| (4) |
In Figure 2, we test the validity of the above equations by plotting the experimentally determined value of and versus , which was varied by changing the intensity of the LIAD using the blue LED. In Fig.2(a), the data clearly shows a linear relationship between and whose slope yields , and whose intercept yields . Moreover, the steady state atom number fits well to Eqn. (4) with the same value of and within statistical uncertainty.
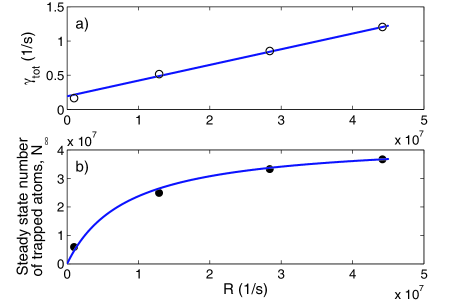
The parameter represents an upper bound for the atom number in the MOT. In the limit where sodium collisions dominate the MOT loss rates, becomes independent of vapor pressure and depends only on the ratio of thermal to capture velocities for the atom, the volume enclosed by the trapping beams and upon other optical parameters (laser intensity, detunings and repumping sideband strength). In this situation, further increasing by turning up the light intensity used for LIAD will only shorten the time taken to reach steady state, not increasing the maximum trapped atom number. In Figure 1 one can clearly see that for high LIAD intensity , which appears to be saturating near . The inset shows, however, that the loading rate continues to increase linearly with LIAD intensity up to at least . The maximum measured was almost 50 times larger than in the absence of LIAD, while the steady state atom number was a little less than 10 times larger.
III.1 The Role of Background Gas

To further confirm the model of monr90 and clarify the role of background gas collisions, it is useful to normalize the steady state atom number to its maximum value . If we define a dimensionless variable it can be expressed via Eqn. (4) as
| (5) |
is proportional to the density of sodium which can be varied by changing the LIAD intensity or the dispenser current. Therefore, runs from 0, when no sodium is present (in the background vapor), to 1, when collisions with Na completely dominate the MOT losses. The crossover between these two regimes occurs when , the background gas collision rate. We changed the vacuum regime in order to study the dependence of this parameter on the MOT loading dynamics.
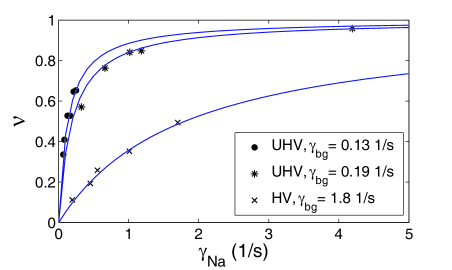
For both high vacuum (HV) and ultra-high vacuum (UHV) conditions, loading curves were acquired and analyzed in a manner similar to Figure 1. Thus was computed and both and could be determined experimentally. The result is plotted in Figure 3. We observed a dramatic dependence of the measured quantities on the vacuum conditions. The data sets all obey the same functional form given by Eqn. (5), but the crossover point occurs for much lower , i.e., sodium vapor density, for UHV when compared to HV.
From a fit to Eqn. (3) we can extract the values of the background gas collision rate. Under HV conditions where the pressure was , we obtained . Under UHV conditions (pressure below ), the background gas collision rate was found to vary depending on the time elapsed since the last firing of the dispenser. The UHV curve with was taken a few hours after the firing whereas the curve with was taken a few months after the last firing. The ratio ()HV/()UHV 10. By contrast, the vacuum gauge measured a pressure ratio of about 600. This is not an uncommon feature of UHV systems: due to mounting constraints the vacuum gauge had to be installed closer to the pumps where the pressure is typically lower than at any other location in the vacuum chamber, including the atom trap. In fact, the data in Figure 2(a) is more reliable to measure the lifetime of the trapped atoms than the pressure gauge readings.
The MOT saturates at fairly low sodium vapor density in the UHV regime, and it is typically larger and brighter. Under UHV conditions beyond the crossover point, increasing the vapor density by a factor of 5 increased the MOT atom number by only 14%. This observation demonstrates that very low Na background vapor density is needed to completely fill the MOT at an appreciable atom number of . Moreover, the UHV MOT did not require the dispenser to be fired over the course of many months, when running it no more than three to four times a week aubin05 .
The collisional loss rates in the range to , inferred from the data in Fig.3, suggest that the LIAD loaded MOT should be compatible with evaporative cooling to BEC. We have also measured the time constant directly by observing the MOT dynamics. The result is plotted in Fig.4, where we recorded the time evolution of the atom number before, during and after the LED was switched off. In that data set, the MOT atom number decayed from a peak of around to an asymptotic value of about atoms with a time constant of .
In the absence of LIAD, a small background Na partial pressure exists, allowing for a small MOT to be filled before . When the LED is turned on it creates a transient Na vapor pressure of much higher density that is responsible for the spike in the trapped atom number. Upon shutting off the LED the extra vapor becomes quickly extinguished by being adsorbed onto the cell walls. Collisions with this background sodium vapor as well as residual (non-sodium) vapor are the cause of the observed 10 second decay time.
III.2 Mechanism of desorption
According to Yakshinskiiy and Madey yakshinskiy99 , the photo-desorption of neutral sodium is a charge transfer process for Na+ ions bound to the silica (SiO2) surface. An electron can be excited from SiO2 by photon bombardment. Above a threshold energy this electron transfers to the unfilled Na 3s level. The neutral Na atom then finds itself on a repulsive potential causing it to quickly dissociate from the surface. Previous work demonstrated a steep dependence of the neutral sodium yield on photon energy in the range of a few eV using a mercury arc lamp. However, the large error bars caused by the broad wavelength spectrum of the mercury lamp precluded a more precise determination of the wavelength dependence in the region of the threshold. Fig.1 of reference yakshinskiy99 shows an error bar spanning the range of approximately for the lowest energy filter setting. No additional information is available within or below that energy range as the experiment could not detect any appreciable signal. For a more precise determination of the desorption due to solar radiation incident on planetary bodies such as the Moon, it is the photon flux from the visible and ultraviolet radiation that plays the most important role. Therefore there is a clear need to examine this region in greater detail.
To address this issue we recorded the MOT loading curves using eight independent LEDs whose wavelengths ranged from to . A black paper mask was custom built to fit over a small part of the Pyrex vacuum cell with a by aperture on both front and back surfaces. This approach allowed us to precisely define and control the area exposed to the LIAD photons. Before the runs, the LEDs were individually adjusted to provide of light irradiance through the mask aperture. This was experimentally found to optimize the LIAD signal to noise ratio over the range of wavelengths used. Since the spatial properties of each LED were slightly different, we carefully measured their individual intensity profile within the exposed area and applied an area average correction factor to the data. The photon energies and energy uncertainties are provided by the manufacturer’s specifications sheets leds1 ; leds2 .
To acquire the data, each run consisted of two full MOT loading curves, similar to those in Fig.1, taken in two steps. In the first step, the LED was kept off and the MOT was fully loaded from the background sodium vapor for a period of about . The MOT current was then immediately turned off and the LED was turned on and allowed to equilibrate thermally for about . In the next step the MOT was reloaded with the LED on for . Thus, in the first step, the MOT was loaded from the background Na vapor alone, while in the second step both background vapor and photo-desorbed atoms were present. The final result was then computed as the difference between the rates measured with LEDs on and off, yielding the net loading rate due to photo-desorption.
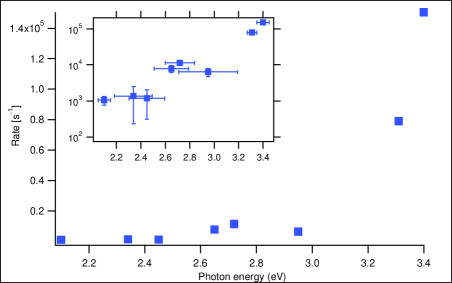
The results are shown in Figure 5, where one can clearly see that the desorption rates become significant only for photon energies above (). For longer wavelengths we are unable to detect any significant LIAD effect, consistent with a threshold phenomenon. In the absence of a theoretical model we have refrained from fitting our data to any functional form. Nevertheless, we are able to detect a significant sodium desorption in the range to , a region below the detection threshold of previous work yakshinskiy99 . Part of the improvement lies in the use of LEDs rather than a Hg lamp, which has narrowed the spectral bandwidth associated with each data point by an order of magnitude on average. More significantly, however, our atom trapping technique is very sensitive to small numbers of desorbed atoms. For example, the majority of the data we presented in Figures 1-4 were taken using light at (), very close to the threshold observed for the LIAD effect on sodium. Therefore, our data on Pyrex complement the studies on pure SiO2 surfaces yakshinskiy99 ; yakshinskiy03 , and there could be variations in the material surface properties that may affect the PSD as well.
The MOT loading rate depends upon both the photo-desorption cross-section, as well as the MOT capture efficiency. If the desorbed atoms re-thermalize with the cell walls before they enter the MOT laser beams, as we believe to be the case for our experimental scenario, the latter should be independent of the wavelength of the desorbing light. In this limit the loading rate of Figure 5 becomes a relative measure of the photo-desorption cross-section. However, it is important to note that the photo-desorption process does not necessarily need to produce a Maxwell-Boltzmann distribution of velocities, and the MOT capture efficiency need not be wavelength independent, as is often assumed to be the case.
Larger photon energies would increase the desorption rate dramatically, an advantage when producing large MOTs very quickly; however, shorter wavelengths will be significantly attenuated through the Pyrex walls. Future work could explore the difference between glass and quartz, although it is questionable whether the latter will be as useful for producing larger MOTs shengwang04 . We also plan to examine porous materials more closely resembling the lunar surface.
IV Conclusion
We have demonstrated that LIAD can be used effectively for fast loading of a sodium vapor-cell based magneto-optical trap, allowing for rapid control over the alkali background vapor pressure inside the cell. The same desorption process plays an important role in planetary science, albeit at drastically different temperatures from a laboratory BEC experiment. Studies by the surface science community have increasingly begun to quantify radiation-induced chemical changes yakshinskiy99 ; yakshinskiy03 ; dominguez04 . The high sensitivity (potentially single atom) of magneto-optical traps may be a powerful tool for surface science.
C.R. thank Thomas Orlando for useful discussions. This work was supported by the U.S. Department of Energy, the Army Research Office and the National Science Foundation.
References
- (1) B. P. Anderson and M. A. Kasevich, Phys. Rev. A 63, 023404 (Jan 2001)
- (2) E. B. Alexandrov, M. V. Balabas, D. Budker, D. English, D. F. Kimball, C. H. Li, and V. V. Yashchuk, Physical Review A 66, 042903 (2002)
- (3) S. N. Atutov, R. Calabrese, V. Guidi, B. Mai, A. G. Rudavets, E. Scansani, L. Tomassetti, V. Biancalana, A. Burchianti, C. Marinelli, E. Mariotti, L. Moi, and S. Veronesi, Physical Review A 67, 053401 (2003)
- (4) S. Aubin, M. H. T. Extavour, S. Myrskog, L. J. LeBlanc, J. Estève, S. Singh, P. Scrutton, D. McKay, R. McKenzie, I. D. Leroux, A. Stummer, and J. H. Thywissen, Journal of Low Temperature Physics 140, 377 (2005)
- (5) C. Klempt, T. van Zoest, T. Henninger, O. Topic, E. Rasel, W. Ertmer, and J. Arlt, Physical Review A (Atomic, Molecular, and Optical Physics) 73, 013410 (2006)
- (6) I. Abramova, A. Aleksandrov, A. M. Bonch-Bruevich, and V. V. Khromov, Soviet Physics - JETP Letters 39, 203 (1984)
- (7) M. Meucci, E. Mariotti, P. Bicchi, C. Marinelli, and L. Moi, EPL (Europhysics Letters) 25, 639 (1994)
- (8) S. Du, M. B. Squires, Y. Imai, L. Czaia, R. A. Saravanan, V. Bright, J. Reichel, T. W. Hänsch, and D. Z. Anderson, Phys. Rev. A 70, 053606 (Nov 2004)
- (9) T. E. Madey, R. E. Johnson, and T. M. Orlando, Surface Science 500, 838 (2002)
- (10) W. Hoheisel, M. Vollmer, and F. Träger, Phys. Rev. B 48, 17463 (Dec 1993)
- (11) A. M. Bonch-Bruevich, T. A. Vartanyan, A. V. Gorlanov, N. M. Yu, S. G. Przhibel’skii, and V. V. Khromov, Soviet Physics - JETP 70, 604 (1990)
- (12) B. V. Yakshinskiy and T. E. Madey, Nature 400, 642 (1999)
- (13) A. Gozzini, F. Mango, J. Xu, G. Alzetta, F. Maccarrone, and R. Bernheim, Il Nuovo Cimento D 15, 709 (1993)
- (14) S. N. Atutov, V. Biancalana, P. Bicchi, C. Marinelli, E. Mariotti, M. Meucci, A. Nagel, K. A. Nasyrov, S. Rachini, and L. Moi, Phys. Rev. A 60, 4693 (Dec 1999)
- (15) C. Marinelli, A. Burchianti, A. Bogi, F. D. Valle, G. Bevilacqua, E. Mariotti, S. Veronesi, and L. Moi, Eur. Phys. J. D 37, 319 (2006)
- (16) V. Wippel, C. Binder, W. Huber, L. Windholz, M. Allegrini, F. Fuso, and E. Arimondo, Eur. Phys. J. D 17, 285 (2001)
- (17) R. Muhammad, J. Ramirez-Serrano, K. M. F. Magalhães, R. Paiva, R. Shiozaki, J. Weiner, and V. S. Bagnato, Optics Communications 281, 4926 (2008)
- (18) E. Mimoun, L. De Sarlo, D. Jacob, J. Dalibard, and F. Gerbier, “Fast production of ultracold sodium gases using light-induced desorption and optical trapping,” (2009), http://www.citebase.org/abstract?id=oai:arXiv.org:0911.5656
- (19) A. J. Moerdijk and B. J. Verhaar, Physical Review A 53, R19 (1996)
- (20) L. Pitaevskii and S. Stringari, Bose-Einstein condensation, International Series of Monographs on Physics (Clarendon Press, Oxford, 2003)
- (21) H. J. Metcalf and P. v. d. Straten, Laser Cooling and Trapping (Springer, New York, 1999)
- (22) C. Monroe, W. Swann, H. Robinson, and C. Wieman, Physical Review Letters 65, 1571 (1990)
- (23) The LEDs ranging from 590nm to 455nm LEDs are from Philips, Lumileds, Luxeon K2 series, http://www.philipslumileds.com/pdfs/DS51.pdf
- (24) The UV range LEDs, 365nm and 375nm, are from Optotech, Shark series, http://www.optotech.com/data_sheets/OTLH-0280-UV-10.pdf
- (25) B. V. Yakshinskiy and T. E. Madey, Surface Science 528, 54 (2003)
- (26) D. Domínguez-Ariza, N. Lopez, F. Illas, G. Pacchioni, and T. E. Madey, Phys. Rev. B 69, 075405 (Feb 2004)