X-ray emission characteristics of two WR binaries : V444 Cyg and CD Cru
Abstract
We present X-ray analysis of two Wolf-Rayet (WR) binaries: V444 Cyg and CD Cru using the data from observations with XMM-Newton. The X-ray light curves show the phase locked variability in both binaries, where the flux increased by a factor of in the case of V444 Cyg and in the case of CD Cru from minimum to maximum. The maximum luminosities in the 0.3–7.5 keV energy band were found to be and erg s-1 for V444 Cyg and CD Cru, respectively. X-ray spectra of these stars confirmed large extinction and revealed hot plasma with prominent emission line features of highly ionized Ne, Mg, Si, S, Ar, Ca and Fe, and are found to be consistent with a two-temperature plasma model. The cooler plasma at a temperature of 0.6 keV was found to be constant at all phases of both binaries, and could be due to a distribution of small-scale shocks in radiation-driven outflows. The hot components in these binaries were found to be phase dependent. They varied from 1.85 to 9.61 keV for V444 Cyg and from 1.63 to 4.27 keV for CD Cru. The absorption of the hard component varied with orbital phase and found to be maximum during primary eclipse of V444 Cyg. The high plasma temperature and variability with orbital phase suggest that the hard-component emission is caused by a colliding wind shock between the binary components.
keywords:
stars:Wolf-Rayet – stars:binary – stars:massive – stars:individual(V444 Cyg, CD Cru) – stars:X-rays1 Introduction
WR stars are known to produce strong stellar winds driven by their strong radiation field. The stellar winds can reach velocities up to 1000-3000 km s-1 with the mass loss rates of M⊙ yr-1 depanding upon mass and age (Rauw 2008). These winds not only affect their evolution, but also have a tremendous impact on their surroundings (Rauw 2008). Most of the O-type and early B-type single stars are reasonably bright ( erg s-1) and are soft (kT keV) X-ray sources. The X-ray luminosity of these sources are found to scale with the bolometric luminosity as (Berghfer et al. 1997, Sana et al. 2006) and is generally thought to be produced due to the shocks, with velocity jumps up to a few hundred km s-1, generated throughout the stellar wind due to dynamic instabilities (Lucy & White 1980; Owocki & Cohen 1999; Kudritzki & Puls 2000). This ’wind-shock’ scenario has now become the ’standard’ model to explain the X-ray emission from single early-type stars (Rauw 2008 and references therein). But several massive stars in the Orion Trapezium cluster (Stelzer et al. 2005), M17 cluster (Broos et al. 2007) and Carina Nebula (Leutenegger & Kahn 2003) require an additional hard X-ray component to explain their X-ray spectra. This additional hot component is inconsistent with the standard model which produces only a soft X-rays. In order to explain the hard X-ray component, Babel & Montmerle (1997) put forward a magnetically confined wind-shock model. According to this model, the stellar wind is confined by the large-scale magnetic field into the equatorial region and the two streams from the upper and lower hemispheres collide with it to heat the plasma to temperatures much higher than typically expected for single stars from the standard wind-shock model.However, the magnetically confined wind-shock model explains hard X-ray on only a small number of single early-type stars, e.g., Ori C (Gagn et al. 2005) .
| Parameters | V444 Cyg | CD Cru | ||
|---|---|---|---|---|
| Refa | Refa | |||
| Other Names | HD 193576; WR 139 | HD 311884 ; WR 47 | ||
| Spectral Type | O6 III-V + WN5 | 1 | O5 V + WN6 | 1 |
| Mass () | 25 + 10 | 2 | 57 + 48 | 10 |
| V (mag) | 7.94 | 3 | 10.89 | 11 |
| Distance (pc) | 1900 | 3 | 3000 | 12 |
| (mag) | 2.48 | 3 | 3.56 | 12 |
| Orbital Period (days) | 4.21 | 2 | 6.24 | 13 |
| Binary separation () | 38 | 2 | 68 | 10 |
| inclination (∘) | 78 | 4 | 70 | 10 |
| eccentricity | 0.03 | 5 | 0 | 14 |
| () | 0.06 + 0.60 | 6,4 | 0.10 + 3.00 | 15,10 |
| () | 2540 + 1785 | 7,8 | 3000 + 2460 | 15,8 |
| 39.24 + 38.56 | 9 | 39.53 + 38.69 | 9 | |
| Radius () | 10 + 3 | 5 | 57 + 48 | 10 |
| Cluster Membership | Berkeley 86 | 3 | Hogg 15 | 11 |
a References: 1. van der Hucht et al. (1981) 2. Mnch (1950) 3. Massey, Johnson & De Gioio-Eastwood (1995) 4. Kurosawa, Hillier & Pittard (2002) 5. Cherepashchuk, Eaton & Khaliullin (1984) 6. Marchenko et al. (1994) 7. Underhill & Fahey (1987) 8. Nugis & Lamers (2000) 9. Landolt-Brnstein (1982) 10. Moffat et al. (1990) 11. Moffat (1974) 12. Sagar, Munari & Boer (2001) 13. Niemela, Massey, Conti (1980) 14. Cherepashchuk & Karetnikov (2003) 15. Repolust, Puls & Herrero (2004) (typical value for the spectral-type)
Stellar binary systems with early type (WR or OB) components are found to be more luminous in X-ray than what is expected from the individual components separately (De Becker 2007). This excess X-ray luminosity is thought to originate from the wind-wind interaction zone where post-shock temperature is believed to reach up to a few to several tens of million Kelvin (MK), contributing mainly to the harder energy ( keV) X-ray emissions. The post-shock temperature is expected to be higher in long period ( a few weeks) binaries as the stellar winds collide close to their terminal velocities. In short period ( a few days) binaries, the wind collision occurs while winds are still accelerating (De Becker 2007). Though, in both the cases, models predict phase-locked variations in the X-ray domain (Luo, McCray & Mac Low 1990; Usov 1992; Antokhin, Owocki & Brown 2004). These variations are produced either due to the varying circumstellar optical depth along the line of sight towards the shock as the stars revolve around each other or by varying the orbital separation in eccentric binaries, which changes the intrinsic strength of the collision (Rauw 2008; Naz et al. 2007). On the contrary, there are examples of a number of massive star binaries (O+O) which show a weak enhancement in the X-ray emission over the single massive stars, but present no variability in the X-ray flux (Albacete Colombo, Mndez & Morrell, 2003). Antokhin (2007) showed that, in general, the X-ray properties of single and binary early-type stars are not very different.
In this paper, we investigated the X-ray emission characteristics for a two short-period WR binaries, namely V444 Cyg and CD Cru using high signal-to-noise (S/N) ratio XMM-Newton observations. For both objects, the X-ray data from XMM-Newton is analysed for the first time, while for CD Cru, we analyze the X-ray emission for the first time. Both the stars are collected from a systematic study carried out on young galactic clusters using the XMM-Newton archival data. The choice of these stars associated with young clusters provide us a good knowledge of the distance and the reddening parameter. Details of the complete study will be presented elsewhere. The relevant parameters of the sample are listed in Table 1 and a description on the individual objects are given below.
V444 Cyg (WR 139) is an O6 III-V + WN5 eclipsing binary system associated with the cluster Berkeley 86 (van der Hucht 2001) situated at an estimated distance of 1.9 kpc with E(B-V)0.8 mag (Massey, Johnson & Degioia-Eastwood 1995). The orbital period and an eccentricity of the binary system are estimated to be 4.21 days (d) and 0.03, respectively, (Khaliullin, Khaliullina & Cherepashchuk 1984). It has been observed in multi-wavelengths with well determined physical parameters. A fairly soft (kT = 0.5 keV) thermal X-ray spectrum was reported using Einstein observations (Moffat et al. 1982). The flux was found to vary by a factor of 2 with a minimum at phase zero, which implies that the WN5 star is in front of the O6 star. Pollock (1987) reported an absorption-corrected flux of erg s-1 in the 0.4-4 keV range. In ROSAT observations, Corcoran et al. (1996) reported a minimum absorption-corrected X-ray luminosity of erg s-1 at the primary eclipse and erg s-1 at the secondary eclipse in the 0.4–4.5 keV range. The ASCA observations at three phases in the energy band of 0.7–10 keV were analyzed by Maeda et al. (1999). They found the presence of two-temperature (0.6 and 2.0 keV) plasma, with soft component (0.2–4 keV) luminosity of erg s-1. The high temperature plasma (kT 2 keV) and the variability with the orbital phase suggest that the hard component emission is caused due to the shocks originated from the collision of winds from WN5 and O6 stars (Maeda et al. 1999).
CD Cru (WR 47) is an O5 V + WN6 binary system reported as a member of the cluster Hogg 15 (van der Hucht 2001). Throughout this study, we adopted a distance of 3 kpc of Hogg 15 (see Piatti et al. 2002 ;Sagar, Munari & Boer 2001). The orbital period of this binary system is 6.24 d with zero eccentricity (Niemela, Massey & Conti 1980). No previous X-ray observations of the system are reported in the literature.
Our paper is organised in the following manner: in Section 2 and 3, we give a detailed description of X-ray data reduction and analysis, respectively. In Section 4, we present a discussion on the X-ray properties of the sources. Finally, we summarize and draw our conclusions in Section 5.
| Object Name | Observation | Exposure | Start time | EPIC filter | Offset from | Orbital |
| ID | Time (sec) | UT(hh:mm:ss) | Target (arcmin) | Phase | ||
| V444 Cyg | 0206240201 | 10032 | 19 May 2004 12:35:42 | Thick | 0.001 | 0.13 (0.12–0.14) |
| 0206240301 | 11914 | 27 May 2004 12:01:39 | Thick | 1.120 | 0.03 (0.01–0.04) | |
| 0206240401 | 11915 | 29 May 2004 12:01:49 | Thick | 1.162 | 0.51 (0.50–0.51) | |
| 0206240501 | 11918 | 06 June 2004 11:36:30 | Thick | 1.111 | 0.39 (0.38–0.41) | |
| 0206240701 | 11911 | 14 June 2004 10:58:29 | Thick | 1.133 | 0.29 (0.27–0.30) | |
| 0206240801 | 19921 | 27 Oct 2004 23:47:44 | Thick | 1.093 | 0.47 (0.45–0.50) | |
| CD Cru | 0109480101 | 53046 | 03 July 2002 15:51:56 | Thick | 2.812 | 0.78 (0.73–0.83) |
| 0109480201 | 48015 | 26 Aug 2002 21:55:14 | Thick | 3.848 | 0.47 (0.43–0.51) | |
| 0109480401 | 53040 | 21 Jan 2003 01:07:38 | Thick | 4.969 | 0.05 (0.01–0.09) |
2 X-ray Observations and Data Reduction
The log of the X-ray observations is given in Table 2. We made use of the archival data obtained with the XMM-Newton observatory which consists of three co-aligned X-ray telescopes observed simultaneously and covered 30′ 30′ region of the sky. The X-ray photons were recorded with the European Photon Imaging Camera (EPIC), which forms images on three CCD-based detectors: the PN (Strder et al. 2001), and the twin MOS1 and MOS2 (Turner et al. 2001) with an angular resolution of 6′′ (FWHM). During the observations, all the three EPIC detectors were active in full frame mode together with the Thick filter. For V444 Cyg, six separate observations were taken with exposure time ranging from 10 to 20 ks. These observations are spread over the half cycle of binary system. However, for the star CD Cru, three separate observations were taken covering almost full binary cycle.
2.1 EPIC data reduction
We reduced the X-ray data using standard XMM-Newton Science Analysis System software (SAS version 7.0.0) with updated calibration files (Ehle et al. 2004). Event files for the MOS and the PN detectors were generated using the tasks emchain and epchain, respectively. These tasks allow calibration of the energy and the astrometry of the events registered in each CCD chip and to combine them in a single data file. We restricted our analysis to the energy band 0.3–7.5 keV, as the data below 0.3 keV are mostly unrelated to bonafide X-rays, and above 7.5 keV is mostly dominated by the background counts. Event list files were extracted using the SAS task evselect. Data from the three cameras were individually screened for the time intervals with high background when the total count rates (for single events of energy above 10 keV) in the instruments exceed 0.35 and 1.0 for the MOS and PN detectors, respectively. The observations with observation ID 0206240401 for the source V444 Cyg were heavily affected by the high background events, and the data in MOS detectors were not useful. Only half of the observation time (5 ks) of PN was found useful.
Light curves and spectra were extracted using a circular region with the source as the center in the energy range 0.3–7.5 keV of the EPIC detectors. The X-ray sources in the cluster were often found to be largely contaminated due to the emission from the neighboring sources. For this reason, the radii of extraction regions were varied between 20′′ and 30′′ depending upon the position of the sources in the detector and their angular separation between the neighboring X-ray sources. The background has been estimated from a number of empty regions close to the X-ray source in the same CCD of the detector. X-ray spectra of the sources were generated using SAS task especget, which also computes the photon redistribution as well as the ancillary matrix. For each source, the background spectrum was obtained from regions devoid of any sources chosen according to the source location. Finally, the spectra were re-binned to have at least 20 counts per spectral bin for both the sources in all the observations.
2.2 RGS data reduction
The Reflection Grating Spectrometers (RGS) are mounted on two of the three XMM-Newton X-ray telescopes and were operated in spectroscopy mode during the observations. We followed the standard procedure as outlined in the XMM-Newton handbook to generate the RGS spectra of the sources. The raw data were processed with the task rgsproc at the position of the sources. The other bright sources, found in the same field observed by RGS, have been excluded from background estimation. In addition, we have filtered the event list for high background level events. For star V444 Cyg, the data obtained in observations with observation ID 0206240401 were contaminated with high background events in RGS detector, therefore the data was not useful. For CD Cru, the two observations ID 0109480101 and 0109480201 were not useful as they are heavily contaminated by a brighter source HD 110432 and affected by high background episodes, respectively.
3 Analysis and Results
3.1 X-ray light curves
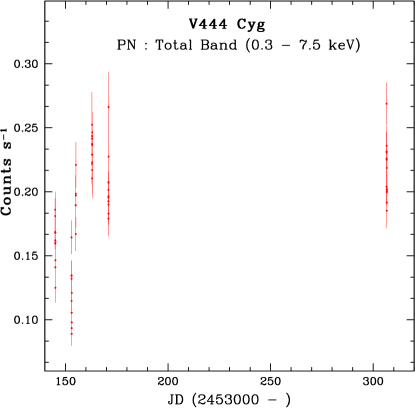
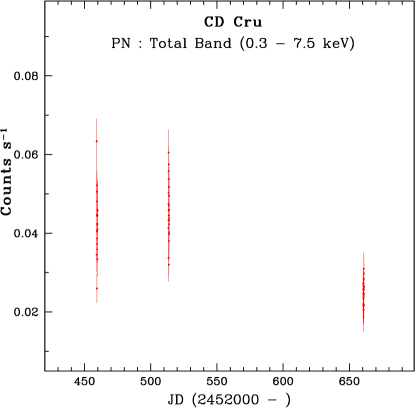
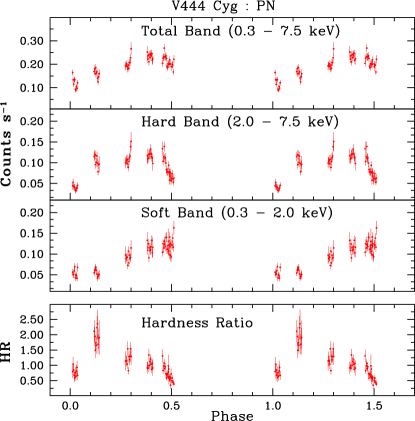
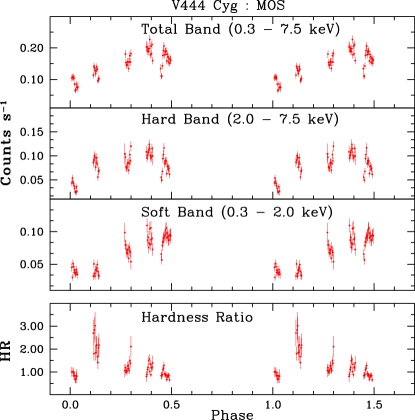
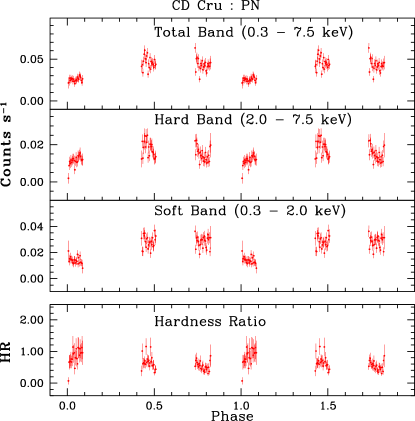
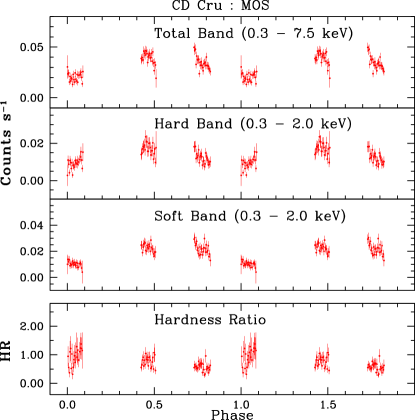
The background subtracted X-ray light curves of the WR-binaries V444 Cyg and CD Cru, as observed with PN detector are shown in Fig. 1(a) and 1(b), respectively. The light curves are in the 0.3–7.5 keV (total) energy band show the variability which suggests colliding wind shocks. Further, we performed the test to measure the significance of the deviations from the mean count rate in order to quantify the constancy of the data over the time-scale of observations. We found the variability in the light curves with a confidence level of greater than 99.999% for both binaries. In order to investigate the variability in the different energy bands, the light curve of these binaries obtained with the MOS and PN data are generated into two energy bands namely the soft (0.3–2.0 keV) and the hard (2.0–7.5 keV). The hardness ratio (HR) is defined by the ratio of hard to soft band count rates. The total, hard and soft band intensity curves, and the HR curve as a function of the orbital phase are shown in the subpanels running from top to bottom in Fig. 2a (PN) and 2b (MOS) for the WR binary V444 Cyg. Similar plots of intensity and HR for the star CD Cru are shown in Fig. 3. The phases of the observations are reckoned using the ephemeris HJD = 2441164.337+4.213E for V444 Cyg (Underhill, Grieve & Louth 1990) and HJD = 2443918.4000+6.2399E for CD Cru (Moffat et al. 1990, Niemela, Massey & Conti 1980). Here, the phase 0.0 indicates the primary eclipse and the phase 0.5 indicates the secondary eclipse. The light curves in the individual bands show the phase locked variability for both binaries. For V444 Cyg, the count rates in total energy band were minimum at phase 0.0 and maximum at the phase 0.45. After the phase 0.45, the count rates were decreased upto the phase 0.5. The count rates are increased by a factor of being minimum at phase 0.0 in the total energy band. In the soft band, the count rates were minimum at phase 0.0 and maximum during the phase 0.45-0.5. However, in the hard band light curve two minima at phase 0.0 and 0.5 were seen clearly. During the phases from 0.13 to 0.45 (i.e. outside the eclipse) the count rates in the hard band were constant. The HR curve can reveal the information about the spectral variations. The HR curve shows that the emitted X-ray is harder just after phase 0.0 being maximum at phase 0.13, and afterward decreased till the phase 0.5. In the case of CD Cru, the nature of the variability was found to be similar to that seen in V444 Cyg. In soft band, the count rates were found to be constant during the phases 0.47 and 0.78 (i.e. outside the eclipse). However, the count rates are decreased rapidly after the phase 0.47 in the hard band. A small variation was also observed in the HR curve of the CD Cru. It was maximum at the phase 0.0 and minimum during the phase 0.47.
3.2 X-ray spectra and spectral fits
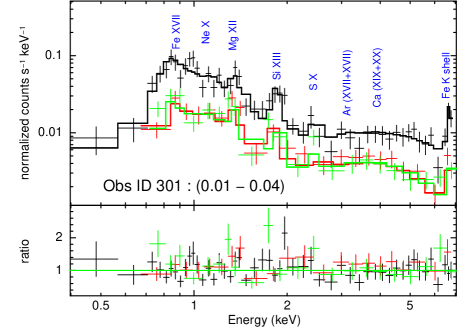
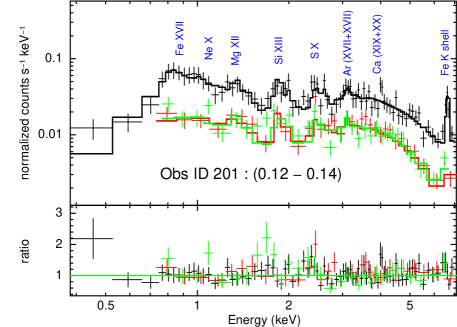
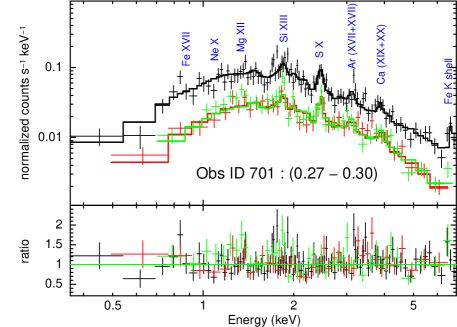
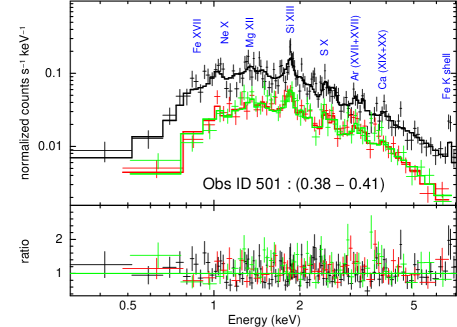
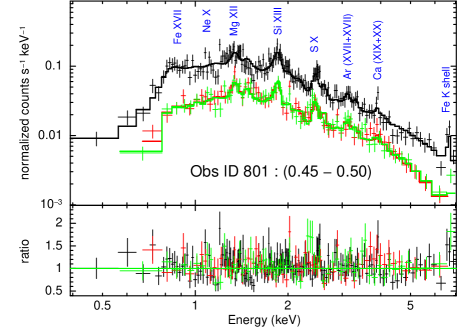
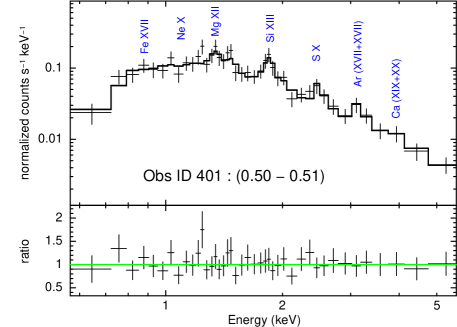
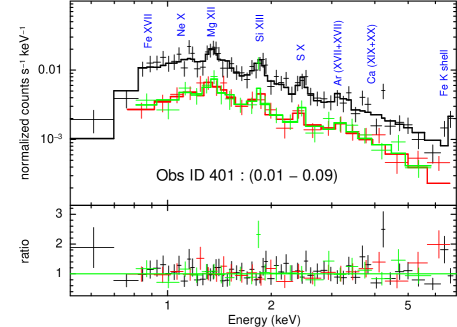
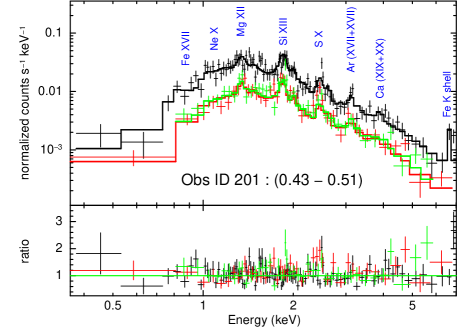
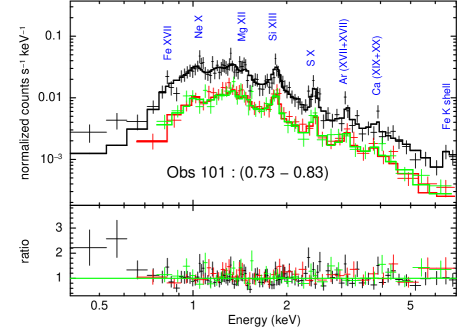
The EPIC spectra of WR binaries in different phases are shown in Figs. 4 and 5 for V444 Cyg and CD Cru, respectively. Below 1 keV, the spectra were found to be affected by the high extinction as previously observed with ASCA for V444 Cyg (Maeda et al. 1999). Strong emission lines are seen in the MOS and PN spectra of both WR binaries. The most prominent lines found in the spectra along with their laboratory energies are the following: Fe XVII (0.8 keV), Ne X (1.02 keV), Mg XII (1.47 keV), Si XIII (1.853 keV), S XV (2.45 keV), Ar XVII (3.12 keV), Ca XIX+XX (3.9 keV) and Fe XXV (6.63 keV).
In order to trace the spectral parameters at different binary phases, we performed spectral analysis of each data set using simultaneous fitting of EPIC data by two models, (a) plane-parallel shock model (vpshock; Borkowski, Lyerly & Reynolds 2001), and (b) models of Astrophysical Plasma Emission Code (apec; Smith et al. 2001), as implemented in the XSPEC version 12.3.0. A – minimization gave the best fitted model to the data. The presence of interstellar material along the line-of-sight and the local circumstellar material around the stars can modify the X-ray emission from massive stars. We corrected for the local absorption in the line-of-sight to the source using the photoelectric absorption cross sections according to Baluciska-Church & McCammon (1992) and modeled as phabs (photoelectric absorption screens) with two absorption components, and . The was estimated using the relation, (Vuong et al. 2003), where , assuming a normal interstellar reddening law towards the direction of the cluster. We used the values of nearly 2.48 mag and 3.56 mag derived for the cluster Berkeley 86 (Massey, Johnson & Degioia-Eastwood 1995) and Hogg 15 (Sagar, Munari & Boer 2001), respectively. The estimated values of towards V444 Cyg and CD Cru are found to be and , respectively. The was estimated by making a fit to the observed spectra by varying the local environment for the soft () and the hard () energy components in terms of and , respectively. Because the WN stars are at evolved stages, the abundances of He, C, N, O, Ne, Mg, Si, S, Ar, Ca, and Fe were allowed to vary during the fitting procedure to account for the observed line emission. The solar abundances were adopted from Lodders (2003).
First, we fitted vpshock plasma model to derive their spectral features. The constant temperature vpshock plasma model was considered without incorporating mass-loss and orbital parameters of WR stars. However, the model does account for non-equilibrium ionization effects and assumes an equal electron and ion temperature. The best fit vpshock models to the data for the WR stars are given in Table 3 and Table 4 for V444 Cyg and CD Cru, respectively.
X-ray emitting plasma may not be isothermal and the observed X-ray spectrum may be a superposition of a cool stellar component and a hot colliding wind shock plasma, as a number of emission lines in the spectra can be formed over a range of temperatures. The cooler component is believed to arise from the instabilities in radiation-driven outflows. However, using the X-ray imaging data of XMM-Newton it is not possible to resolve the X-ray emission from colliding wind region and individual stars separately. Therefore, secondly, we fitted two temperature (2T) plasma model ”vapec” to characterize such components. The form of 2T plasma model was phabs(phabs*vapec+phabs*vapec). In terms of the 2T plasma model provides better goodness-of-fit for both the sources over the vpshock model. The results for the 2T plasma model along with the data are displayed in Fig. 4 and Fig. 5 for V444 Cyg and CD Cru, respectively. The best-fit parameters are given in Table 3 and Table 4 for V444 Cyg and CD Cru, respectively.
| V444 Cyg | ||||||||||||
|---|---|---|---|---|---|---|---|---|---|---|---|---|
| Obs ID | 0206240201 | 0206240301 | 0206240401 | 0206240501 | 0206240701 | 0206240801 | ||||||
| Phase | (0.12–0.14) | (0.01–0.04) | (0.50–0.51) | (0.38–0.41) | (0.27–0.30) | (0.45–0.50) | ||||||
| Model | vpshock | 2Tvapec | vpshock | 2Tvapec | vpshock | 2Tvapec | vpshock | 2Tvapec | vpshock | 2Tvapec | vpshock | 2Tvapec |
| 0.75 | 0.280 | |||||||||||
| 12.20 | ||||||||||||
| 79.80 | 79.90 | |||||||||||
| 0.23 | 0.18 | |||||||||||
| 0.19 | 0.17 | 288.07 | ||||||||||
| 36.44 | ||||||||||||
| He | 763.00 | 518.90 | ||||||||||
| C | 9998.91 | 0.00 | ||||||||||
| N | 650.45 | 0.00 | ||||||||||
| O | 191.35 | 2.13 | ||||||||||
| Ne | 68.34 | 33.83 | ||||||||||
| Mg | 0.00 | 76.34 | ||||||||||
| Si | 0.00 | 142.88 | ||||||||||
| S | 999.97 | 199.06 | ||||||||||
| Ar | 6.02 | 6.02 | ||||||||||
| Ca | 9991.50 | 2994.71 | ||||||||||
| Fe | 92.50 | 196.91 | ||||||||||
| 2.77(130) | 1.07 (127) | 2.38(79) | 1.28 (77) | 1.10 (27) | 0.77 (25) | 1.47 (200) | 1.38 (198) | 1.13 (168) | 1.08 (166) | 1.12(277) | 0.98 (275) | |
| 32.691 | 32.485 | 32.589 | 32.764 | 32.726 | 32.732 | |||||||
| 31.739 | 31.746 | 32.170 | 32.104 | 31.999 | 32.177 | |||||||
| 32.639 | 32.398 | 32.380 | 32.657 | 32.636 | 32.591 | |||||||
Note: Here , where is degrees of freedom. Errors are with 90% confidence based on .
and are in the units of .
and are in the units of keV.
is in the units of .
and are in the units of .
luminosity in band 0.3–7.5 keV, luminosity in band 0.3–2.0 keV
and luminosity in band 2.0–7.5 keV are in the units of .
| CD Cru | ||||||
|---|---|---|---|---|---|---|
| Obs ID | 0109480101 | 0109480201 | 0109480401 | |||
| Phase | (0.73–0.83) | (0.43–0.51) | (0.01–0.09) | |||
| Model | vpshock | 2Tvapec | vpshock | 2Tvapec | vpshock | 2Tvapec |
| 270.41 | ||||||
| 45.68 | ||||||
| He | ||||||
| C | ||||||
| N | ||||||
| O | ||||||
| Ne | ||||||
| Mg | ||||||
| Si | ||||||
| S | ||||||
| Ar | ||||||
| Ca | ||||||
| Fe | ||||||
| 1.06(164) | 1.01 (162) | 1.44(173) | 1.32 (171) | 0.98(89) | 0.95 (87) | |
| 0.23 | 0.23 | 0.26 | 0.26 | 0.19 | 0.19 | |
| 32.391 | 32.451 | 32.309 | ||||
| 31.941 | 31.959 | 31.687 | ||||
| 32.200 | 32.282 | 32.190 | ||||
Note: Here , where is degrees of freedom. Errors are with 90% confidence based on .
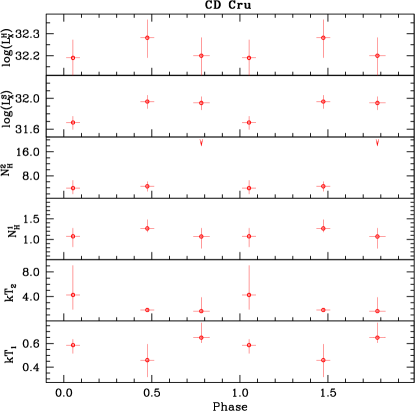
3.3 Evolution of spectral parameters
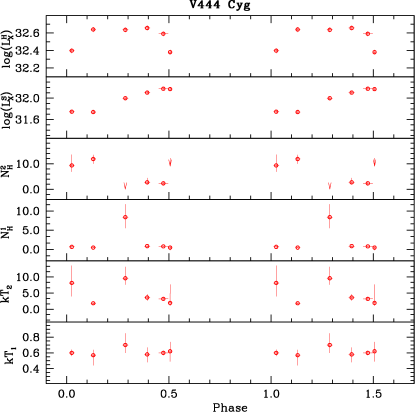
The spectral analysis at different phases of the WR binaries provides the dependence of the best fit values of parameters on orbital phase. The variation of the soft () and hard () band X-ray luminosities, column densities corresponding to the cool () and hot () temperature components, and cool(kT1) and hot (kT2) temperatures as a function of orbital phases of V444 Cyg and CD Cru are shown in Fig. 6(a) and 6(b), respectively. In the case of V444 Cyg, the was found to be minimum during the primary and secondary eclipses and maximum outside the eclipse. It was constant during the phase 0.13 to 0.47. However, the was found to be minimum during the primary eclipse only. At the phase of 0.5 the was found to be maximum. Both and were found to be minimum during the phase 0.0 and maximum at phase 0.5 in the WR binary CD Cru. The cool component () was found to be constant with a mean value of 0.610.05 keV and 0.570.10 keV for V444 Cyg and CD Cru, respectively. The hard energy component () was varied from a minimum value of 1.88 keV to a maximum value of 9.61 keV for V444 Cyg. It was maximum at primary eclipse and at the phase of 0.29, and minimum during the secondary eclipse and at the phase of 0.13. For CD Cru, varies from a minimum value 1.63 keV during outside the eclipse to a maximum value of 4.27 keV at primary eclipse. For the star V444 Cyg, was maximum at phase 0.29, otherwise it was constant at all phases. However, was found to be constant throughout the orbital phase with a mean value of 1.140.11 for CD Cru. For V444 Cyg, was increased from phase 0.0 to its maximum value at phase 0.13. Afterward it was decreased and became almost constant from phase 0.29 to phase 0.47. For CD Cru, was minimum at phase 0.0 and maximum at phase 0.78.
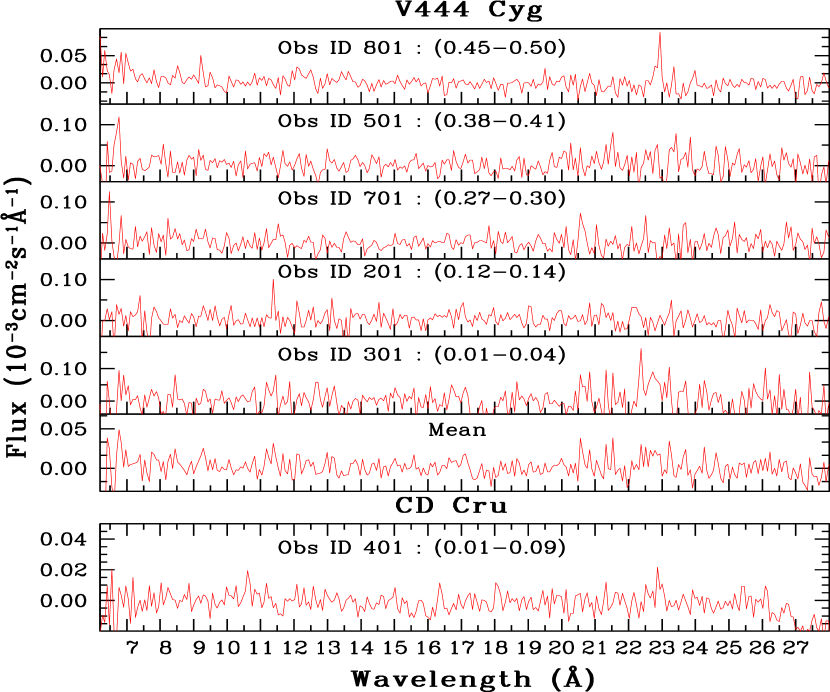
3.4 RGS spectra
We combined the first and second order spectra of detector RGS1 and RGS2 to inspect the main spectral lines. We obtained the RGS fluxed spectra using task rgsfluxer and is shown in Fig. 7 for different phases for both the binaries. We identified the prominent emission lines for V444 Cyg at wavelengths Mg XII (6.50 Å; 6.74 Å), Mg XI (9.23 Å), Fe XVIII (11.40 Å) and Ca XVI (22.61 Å, 21.43 Å, 22.30 Å). Individual lines show intensity variations from spectrum to spectrum. Unfortunately, our observations are at the limit of detectability with the data available with poor count statistics. Therefore, the signal-to-noise ratio of individual lines are not sufficient to perform a detailed quantitative analysis of the RGS line spectrum for any of the massive stars.
4 Discussion
We have analyzed the X-ray emission properties of two WR binaries with strong stellar winds. We discuss below the implications of the X-ray results.
4.1 Phase-locked X-ray variability
The X-ray temporal and spectral analyses of WR binaries V444 Cyg and CD Cru showed a phase-locked phenomenon. The phase resolved X-ray spectroscopic observations show that the soft energy component and the corresponding were also found to be nearly constant throughout the binary phases of both stars. The was found to be minimum during the primary eclipse only. These results lead to the radiative wind shock origin of soft energy component. In the case of CD Cru, the modulation of well matches with the optical light curve reported by Moffat et al. (1990). Lamontagne et al. (1996) have reported a similar shape of optical photometric light curves for 13 WR binaries including CD Cru and they said that it could be due to the ”atmospheric eclipse”. The X-ray flux in the hard energy band was found to be minimum at both primary and secondary eclipse for both stars. This implies that the hard energy component could be due to the presence of wind-wind collision zone which is located somewhere in between the O-type and WR star, and therefore, minimum when either of the star in the binary system is eclipsed. A similar behavior of X-ray light curves was seen in the EINSTEIN, ROSAT and ASCA observations of V444 Cyg (Moffat et al. 1982; Corcoran et al. 1996 ; Maeda et al. 1999). The hot temperature () and the corresponding were also varied with orbital phases of both binaries. The eccentricity of both binary systems is almost zero, therefore, the variation in the temperature corresponding to the hard energy component could be the result of variation in , i.e., varying optical depth (see §1). This further supports the wind-wind collision phenomenon in these binaries.
4.2 X-ray Temperatures of Plasma
The X-ray spectra of WR binaries are well defined by two temperature plasmas. The values of in the total energy band are found to be -6.6 and -7.2 in for V444 Cyg and CD Cru, respectively, which are similar to those for other WR (WN) stars observed from XMM-Newton and CHANDRA (Gdel & Naz 2009). The temperature of the cool component of WR binaries are comparable to other WR binaries e.g., 0.56–0.67 keV for WR1 (Ignace, Oskinova & Brown 2003) and 0.7–0.8 keV for WR 147 (Skinner et al. 2007). However, the temperatures corresponding to hot energy component o f these WR binaries are slightly more than some of the similar binaries. The possible mechanisms for generation of X-rays are discussed below.
4.2.1 Instabilities driven radiative wind shocks
The wind-shock model predicts the intrinsic instability of the line driving mechanism. The standard model estimates the shock velocities by the relation (Lucy 1982; Luo, McCray & Maclow 1990). The temperatures of the cool energy components are found to be almost similar ( 0.6 keV) for both the binary systems (see Table 3 and Table 4). Adopting the mean particle weight 1.16 (Skinner et al. 2007) for WN stars and 0.62 for O-type stars (Cassinelli et al. 2008), we derived the ”average” value of shock velocities 515 for WN stars and 704 for O-type stars corresponding to the cool component. These values are about a factor of 2 larger than those predicted by radiative shock model of Lucy (1982). However, the advance version of the wind shock model by Owocki et al. (1988) predicts X-ray emission up to 1 keV. Moreover, the temperatures of the cool energy component and are not varying with orbital phase. Therefore, it appears that the cool energy component from V444 Cyg and CD Cru could be generated by either of the binary components and may be explained by instabilities in radiation-driven wind shocks.
4.2.2 Magnetically Confined Wind Shock
Babel & Montmerle (1997) have suggested that the presence of magnetic fields confine the wind, which may be an important ingredient for the production of X-ray emission (Babel & Montmerle 1997). The degree of confinement of wind by the magnetic field is derived in terms of a confinement parameter , where is the surface equatorial magnetic field strength (ud-Doula & Owocki 2002). For a confined wind model . Using the values of stellar radius () and stellar mass loss rate () as given in Table 1 for V444 Cyg binary components, the minimum magnetic field required to confine the wind is derived to be 0.14 kG for the primary and 1.25 kG for the secondary. Similarly, for CD Cru, we derived minimum magnetic field of 0.16 kG and 1.96 kG for the primary and the secondary components, respectively. Based on the formula given by Babel & Montmerle (1997) and using above estimated values of B, the X-ray luminosity are estimated to be erg s-1 and erg s-1 for primary and the secondary components of V444 Cyg, and erg s-1 and erg s-1 for primary and the secondary components of CD Cru. Such a high X-ray luminosity has not been observed from any of the WR binaries. However, smaller fields can exist and the confinement may be limited to just above the magnetic equatorial plane.
4.2.3 Colliding wind shock model
| Object | log( ) | log() | log() | ||||
| Name | Phase | ||||||
| V444 Cyg | 0.01–0.04 | 5.496 | 0.416 | ||||
| 0.12–0.14 | 0.282 | 0.021 | |||||
| 0.27–0.30 | 7.623 | 0.577 | |||||
| 0.38–0.41 | 1.094 | 0.083 | |||||
| 0.45–0.50 | 0.856 | 0.065 | |||||
| 0.50–0.51 | 0.320 | 0.024 | |||||
| CD Cru | 0.01–0.09 | 0.990 | 0.047 | ||||
| 0.43–0.51 | 0.178 | 0.008 | |||||
| 0.73–0.83 | 0.144 | 0.007 |
Assuming that shock velocities have reached to the terminal velocities, the standard model predicts a maximum temperature for the shocked region from winds of massive stars by the relation (Luo, McCray & Maclow 1990). The nominal wind parameters of massive stars (see Table 1) and the mean particle weight for the WN stars and for the O-type stars give the maximum temperature generated by the individual components of binaries. The derived values are 7.80 keV + 7.21 keV for V444 Cyg (O6+WN5) and 10.88 keV + 13.69 keV for CD Cru (O5+WN6). The maximum observed temperature at phase 0.29 corresponding to hot component is found to be similar to that of maximum possible values in the case of V444 Cyg. However, in CD Cru maximum observed temperature is lesser than that of maximum possible values.
The phase locked variability of the hard energy component shows that the observed hot X-ray temperatures in massive binaries could originate from the collision of stellar winds. The distances from the stars where these winds meet are derived using the relations (De Becker 2007; Stevens, Blondin & Pollock 1992),
| (1) |
where and D are the distance to the collision zone from the primary and the separation between the binary components, respectively. The wind momentum ratio is expressed as,
| (2) |
where and are mass loss rates of primary and secondary components, respectively, and and are terminal velocities of primary and secondary components, respectively. Using the above relations, we derived wind momentum ratios of 7.03 and 24.60 for the stars V444 Cyg and CD Cru , respectively. Distances to the collision zone from the primary are estimated to be 0.27 and 0.17 times of their corresponding binary separation (D) for V444 Cyg and CD Cru, respectively. Therefore, the collision zone exists to be very close to the primary O-type star in case of both the binaries. Further, the collision wind zone will produce a bow shock around the O-type star , the shock volume and the emission measure are dominated by the WR winds, therefore, X-ray emitting plasma also shows non-solar abundances.
The gas in a colliding wind region could be either adiabatic or radiative and depends upon the value of cooling parameter (), which is defined as the ratio of the cooling time () of the shocked gas to the escape time () from the intershock region (Stevens, Blondin & Pollock 1992).
| (3) |
where is the pre-shock velocity in the unit of 103 , is the distance from stellar center to the shock in the unit of 107 km and is the mass loss rate in the unit of . Using the parameters given in Table 1 and the values from above estimation, we derived cooling parameters and for primary and secondary components, respectively. The estimated values of and are given Table 5. The winds from WR stars are found to be clearly radiative () for both the binaries. The intrinsic luminosity can be estimated for each component of the binary using the following relation (Pittard & Stevens 2002) :
| (4) |
where accounts for a geometrical and inefficiency factors and v is the wind speed at contact surface (i.e. pre-shock velocities derived from observed temperatures). The values of (0.403 for V444 Cyg ; 0.564 for CD Cru) and (0.033 for V444 Cyg ; 0.0042 for CD Cru) for primary and secondary stars, respectively, are taken from Pittard & Stevens (2002). The estimated values of intrinsic luminosities of each component and the total intrinsic luminosities of binary systems are given in Table 5. These values are nearly 3 orders of magnitude higher than those of the observed values. A similar results have been found for other WR binaries, e.g., HD 159176 (De Becker et al. 2004); WR 147 (Skinner et al. 2007). De Becker et al. (2004) suggested that the disagreement between observed and theoretical predictions could possibly be explained by (a) the kinetic power of the collision should be considered as an upper limit on the X-ray luminosity, (b) higher value of the parameter should be considered, (c) diffusive mixing between hot and cool material is likely to exist due to the instability of the shock front, and (d) orbital effects should also be included to study such systems. The observed and theoretically predicted values of X-ray luminosities are shown in Fig. 8. This model also predicts the phase-locked variations which can be seen in Fig. 6. Therefore, it appears that the hard energy component is most likely associated with wind collision zone.

4.2.4 Non-thermal emission
There is no strong justification for invoking non-thermal origin of X-ray emission since the observed X-ray emission at higher energies can be fitted satisfactorily with a thermal model (see Fig. 4 and Fig. 5). However, the present data is limited up to 10 keV and it is difficult to eliminate the contribution of non-thermal components from the spectra which is dominated by the presence of the strong thermal emission, and the non-thermal emission is overwhelmed by the thermal emission (De Becker 2007). Therefore, we can state that the spectra of massive stars in the present sample are fairly well explained by two-temperature plasma models.
5 Summary
We have analysed X-ray temporal and spectral properties of two WR binaries V444 Cyg and CD Cru observed with high sensitivity EPIC instruments on board the XMM-Newton satellite. The X-ray light curves in the soft and the hard energy band show the phase locked variability. Both primary and secondary minima were seen in the hard band X-ray light curves of both binaries. However, in the soft X-ray light curve only primary minimum was seen. This implies that the hard energy component could be originating from the wind-wind collision zone. The X-ray spectra of both WR binaries show strong absorption below 1 keV and a clear evidence of high temperature plasma, manifested by a visible Fe emission-line complex. The study of X-ray spectra reveals cool as well as hot temperature plasma components of binary stars which are fitted consistently with two-temperature plasma models. The cooler plasma component was found to be constant at all phases with mean value of 0.6 keV for both binaries. The presence of cooler component could be due to the distribution of small-scale shocks in the radiation-driven outflows from either the primary or the secondary star in the binary systems. The temperature of hot plasma component and the corresponding column density were found to be variable during the orbital cycle of both binaries. The variation in temperature of hot plasma could be due to the varying circumstellar optical depth along the line of sight towards the shock as star revolves around each other. The maximum value of hot plasma was found to be lower than the hottest plasma possible in the binary systems as predicted by colliding wind theory for short-period binaries. However, the predicted values of X-ray luminosities are orders of magnitude more than those of the observed values and can not be accounted in terms of observational errors.
acknowledgments
We thank referee Dr. Marc Gagn for his useful suggestions. We would like to thank Dr. Maheshwar Gopinathan for the critical reading of the manuscript. This publication makes use of data products from XMM-Newton archives using the high energy astrophysics science archive research center which is established at Goddard by NASA. We acknowledge XMM-Newton Help Desk for their remarkable support in X-ray data analysis. This research has also made use of data Simbad and VizieR catalogue access tool, CDS, Strasbourg, France.
References
- (1) Albacete Colombo J. F., Mndez M., Morrell N. I., 2003, MNRAS, 346, 704
- (2) Antokhin I. I., Owocki S. P., Brown J. C., 2004, ApJ, 611, 434
- (3) Antokhin I. I., 2007, Astronomical and Astrophysical Transactions, vol. 26, Issue 1, p.59
- (4) Babel J., Montmerle T., 1997, A&A, 323, 121
- (5) Baluciska-Church M., McCammon D., 1992, ApJ, 400, 699
- (6) Berghfer T. W., Schmitt J. H. M. M., Danner, R., Cassinelli J. P., 1997, A&A, 322, 167
- (7) Borkowski K. J., Lyerly W. J., Reynolds S. P., 2001, ApJ, 548, 820
- (8) Broos P. S., Feigelson E. D., Townsley L. K., Getman K. V., Wang J., Garmire G. P., Jiang Z., Tsuboi Y., 2007, ApJ, 169, 353
- (9) Cassinelli J. P., Ignace R., Waldron W. L., Cho J., Murphy N. A., Lazarian A., 2008, ApJ, 683, 1052
- (10) Cherepashchuk A. M., Eaton J. A., Khaliullin Kh. F., 1984, ApJ, 281, 774
- (11) Cherepashchuk A. M., Karetnikov V. G., 2003, Astronomy Reports, Volume 47, 38
- (12) Corcoran M. F., Stevens I. R., Pollock A. M. T., Swank J. H., Shore S. N., Rawley G. L., 1996, ApJ, 464, 434
- (13) De Becker M., Rauw G., Pittard J. M., Antokhin I. I., Stevens I. R., Gosset E., Owocki S. P., 2004, A&A, 416, 221
- (14) De Becker M., 2007, A&ARv, 14, 171
- (15) Ehle M. et al., 2004, User’s Guide to XMM-Newton Science Analysis System.
- (16) Gagn M., Oksala M. E., Cohen D. H., Tonnesen S. K., ud-Doula A., Owocki S. P., Townsend R. H. D., MacFarlane J. J., 2005, ApJ, 628, 986
- (17) Gdel M., Naz Y., 2009, A&A Review, in press, (astro-ph/0904.3078).
- (18) Ignace R., Oskinova L. M., Brown J. C., 2003, A&A, 408, 353
- (19) Khaliullin Kh. F., Khaliullina A. I., Cherepashchuk A. M., 1984, Soviet Astron. Lett., 10, 250 ; also published as AJ, 18, 229
- (20) Kudritzki R -P, Puls J., 2000, ARA&A, 38, 613
- (21) Kurosawa R., Hillier D. J., Pittard, J. M., 2002, A&A, 388, 957
- (22) Landolt-Brnstein, 1982, Numerical Data and Functional Relationship in Science and Technology, New series, Group VI, Vol. 2b, Scaifers K. & Voigt H. H. (eds.) Springer - Verlog, Berlin
- (23) Lamontagne R., Moffat A. F. J., Drissen L., Robert C., Matthews J. M., 1996, AJ, 112, 2227
- (24) Leutenegger M. A., Kahn S. M., 2003, ApJ, 585, 1015
- (25) Lodders K., 2003, ApJ, 591, 1220
- (26) Lucy L. B., White R. L., 1980, ApJ, 241, 300
- (27) Luo D., McCray R., Mac Low M., 1990, ApJ, 362, 267
- (28) Maeda Y., Koyama K., Yokogawa J., Skinner S., 1999, ApJ, 510, 967
- (29) Marchenko S. V., Moffat A. F. J., Eenens P. R. J., Cardona O., Echevarria J., Hervieux Y., 1997, ApJ, 485, 86
- (30) Massey P., Johnson K. E., Degioia-Eastwood, K., 1995, ApJ, 454, 151
- (31) Mnch G., 1950, ApJ, 112, 266
- (32) Moffat A. F. J., 1974, A&A, 34, 29
- (33) Moffat A. F. J., Firmani C., McLean I. S., Seggewiss W., 1982, IAU Symposium, 99, Wolf-Rayet stars: Observations, physics, evolution, n ed. C. W. H. de Loore and A. J. Willis (Dordrecht: Reidel) p. 577
- (34) Moffat A. F. J et al., 1990, ApJ, 350, 767
- (35) Naz Y., Corcoran M. F., Koenigsberger G., Moffat A. F. J., 2007, ApJ, 658, 25
- (36) Niemela V. S., Massey P., Conti P. S., 1980, ApJ, 241, 1050
- (37) Nugis T., Lamers H. J. G. L. M., 2000, A&A, 360, 227
- (38) Owocki S. P., Castor J. I., Rybicki G. B., 1988, ApJ, 335, 914O
- (39) Owocki S. P., Cohen D. H., 1999, ApJ, 520, 833
- (40) Piatti A. E., Bica E., Santos J. F. C., Jr., Clari J. J., 2002, A&A, 387, 108
- (41) Pittard J. M., Stevens I. R., 2002, A&A, 388, 20
- (42) Pollock A. M. T., 1987, AJ, 320, 283
- (43) Rauw G., 2008, in Benaglia P., Bosch G. L., Cappa C. E., eds, Massive Stars: Fundamental Parameters and Circumstellar Interactions, 33, p.59
- (44) Repolust T., Puls J., Herrero A., 2004, A&A, 415, 349
- (45) Sagar Ram, Munari U., de Boer K. S., 2001, MNRAS, 327, 23
- (46) Sana H., Rauw G., Naz Y., Gosset E., Vreux J.-M., 2006, MNRAS, 372, 661
- (47) Skinner S. L., Zhekov S. A., Gdel M., Schmutz W., 2007, MNRAS, 378, 1491
- (48) Smith R. K., Brickhouse N. S., Liedahl D. A., Raymond J. C., 2001, ApJ, 595, 365
- (49) Stelzer B., Flaccomio E., Montmerle T., Micela G., Sciortino S., Favata F., Preibisch T., Feigelson E. D., 2005, ApJ, 160, 557
- (50) Stevens I. R., Blondin J. M., Pollock A. M. T., 1992, ApJ, 386, 265
- (51) Strder L. et al. 2001, A&A, 365, 18
- (52) Turner M. J. L. et al. 2001, A&A, 365, 27
- (53) ud-Doula A., Owocki S. P., 2002, ApJ, 576, 413
- (54) Underhill A. B., Fahey R. P., 1987, ApJ, 313, 358
- (55) Underhill A. B., Grieve G. R., Louth H., 1990, PASP, 102, 749
- (56) Usov V. V., 1992, ApJ, 389, 635
- (57) van der Hucht K. A., Conti P. S., Lundstrom I., Stenholm B., 1981, Space Sci. Rev., 28, 227
- (58) van der Hucht K. A., 2001, New Astronomy Reviews, 45, 135
- (59) Vuong M. H., Montmerle T., Grosso N., Feigelson E. D., Verstraete L., Ozawa H., 2003, A&A, 408, 581