A Physical Explanation on Solar Microwave Zebra Pattern with the Current-carrying Plasma Loop Model
Abstract
Microwave zebra pattern structure is an intriguing fine structure on the dynamic spectra of solar type IV radio burst. Up to now, there isn’t a perfect physical model for the origin of the solar microwave zebra pattern. Recently, Ledenev, Yan and Fu (2006) put forward an interference mechanism to explain the features of microwave zebra patterns in solar continuum events. This model needs a structure with a multitude of discrete narrow-band sources of small size. Based on the model of current-carrying plasma loop and the theory of tearing mode instability, we proposed that the above structure does exist and may provide the main conditions for the interference mechanism. With this model, we may explain the frequency upper limit, the formation of the parallel and equidistant stripes, the superfine structure and intermediate frequency drift rate of the zebra stripes. If this explanation is valid, the zebra pattern structures can reveal some information of the motion and the inner structures of the coronal plasma loops.
Keywords Solar microwave emission, Zebra pattern structure, electric current loop, flare
1 Introduction
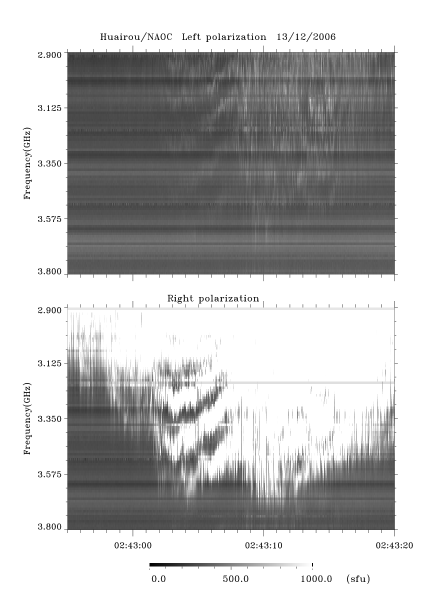
During much of solar flares, it is very frequently found that a kind of intriguing fine structure pattern superposed on the solar radio broadband spectrum of type IV bursts, and behaved as a series of almost parallel and equidistant stripes in the dynamic spectrum. Such structure is called zebra pattern. Most often, zebra patterns are observed in meter and decimeter frequency range, and with up to 10 and more stripes (Slottje, 1972). It is seldom to observe zebra patterns in microwave frequency range in the early observations, and even if we found them, there always only 3 or 4 stripes in a zebra pattern structure (Ning et al, 2000; Ledenev, Yan and Fu, 2001). However, in recent microwave observations, some remarkable zebra patterns are also found with up to 30 stripes in the frequency range of 2.60 – 3.80 GHz (Chernov et al, 2005). Fig. 1 is an example of zebra pattern occurred in the frequency of 2.90 – 3.80 GHz observed at Chinese Solar Broadband Radiospectrometer (SBRS/Huairou) in 02:42:55 – 02:43:20 UT, 13 Dec. 2006 in the famous flare event, with strong right polarization, 5 stripes, and the duration is about 10 seconds, cognizably. Up to now, the upper limit frequency of Zebra pattern structure is below 6 GHz, and the corresponding wavelength is about 5 cm (Altyntsev et al, 2005). The duration of zebra pattern event is from several to a few decades of seconds. It is uncommon to last for more than 30 seconds.
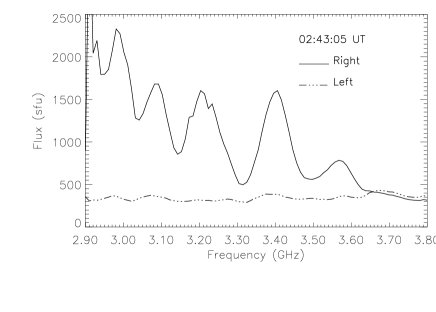
If we fix the time and plot the profile of the emission flux with respect to frequency in the Zebra pattern structure, we may find that the flux profile behaves periodic feature, and the period is the frequency gap between two stripes. Fig. 2 gives an example profile of the emission flux at 02:43:05 UT, 13 Dec. 2006 of the Zebra pattern showing in Fig.1. There are 5 peaks in this profile, and each represents one stripe.
The another main feature of Zebra pattern structure is the intermediate frequency drift against the continuum emission of type IV radio outbursts (Slottje, 1972; Mollwo, 1983; etc). Fig. 1 shows that frequency drift rate is about 55 MHz/s during 02:42:59 – 02:43:03 UT, and -45 MHz/s during 02:43:03 – 02:43:10 UT around the frequency of 3.50 GHz, negatively or positively.
Chernov et al (2003, 2008) have found that the Zebra pattern stripes in the microwave range often have some superfine structures, consisting of separate spike-like pulses with millisecond duration. Chen and Yan (2007) also found that Zebra stripes consist of periodically narrow band pulsating superfine structures, and the period is about 30 milliseconds. Because of the saturation around the center of the Zebra stripes associated with the flare event occurred in 13 Dec. 2006 (see in Fig. 1), we could not distinguish the obvious superfine structures in this event. However, from the limb parts of the Zebra stripes, we may also find some evidences of the quasi-periodic narrow band pulsating superfine structures. Fig. 3 shows the quasi-periodic narrow band pulsating superfine structures of the Zebra stripe in a segment of 02:43:02.8 – 02:43:03.8 UT at frequency of 3.65 GHz, near the limb of the fourth stripe (numbered from low frequency to high frequency). And the period of the pulsating superfine structures is about 30 – 35 milliseconds.

Generally, people think that the microwave Zebra pattern may provide some useful information about the kernel of the flaring regions. It is necessary for any model of zebra pattern to explain the following features: (1) the upper limit of frequency of Zebra pattern, (2) almost parallel and equidistant stripes, (3) superfine structures, (4) intermediate frequency drift rate. In order to interpret the formation of Zebra pattern, a great number of theoretical models were proposed. These models can be classified simply into two groups:
(1) Isogenous models, which proposed that all the stripes in a Zebra pattern are generated from a single emission source, and the emission mechanism is a kind of nonlinear coupling between two Bernstein modes, or Bernstein mode and some electrostatic upper hybrid mode waves. The frequency gap between two stripes is very close to the frequency of electron cyclotron emission (Rosenberg, 1972; Chiuderi et al, 1973; Zaitsev and Stepanov, 1983).
(2) Heterogenous models, which proposed that all the stripes in a Zebra pattern are generated from different emission source regions, and different source region are located at different positions in the magnetic flux tube. In each source region, some resonant conditions are satisfied, and the emission mechanism is probably the coupling between whistler wave and electrostatic upper hybrid mode wave which triggered by some plasma micro-instabilities. The frequency gap between two stripes is greatly different to the frequency of electron cyclotron emission (Kuijpers, 1975; Fomichev and Fainshtein, 1981; Mollwo, 1983; Ledenev, Yan, and Fu, 2001; Chernov et al, 2005; Altyntsev et al, 2005).
However, up to now, there is no perfect theoretical model which can explain Zebra pattern satisfactorily. Recently, Ledenev, Yan, and Fu (2006) proposed that Zebra pattern is possibly formed from some interference mechanism in the propagating processes. They assumed that there are some inhomogeneous layers with small size in solar coronal plasma, and such structure will change the radio waves into direct and reflected rays. When the direct and reflected rays meet at the position of observer, interference will take place and form Zebra pattern structure.
When the dimensional size of an emission source region is smaller than the minimum wavelength of emission spectrum, the source region can be treated as a point source. At the same time, when the emission spectrum is continuum, then it is possible to form an interference pattern. The dimensional size of the source region is much smaller than the characteristic size of plasma density gradient, and can be regarded as a point source. However, the dimensional size of the source region is always much larger than the emission wavelength. The interference condition requires that the source region has a narrow, zonal inhomogeneous interior structure to keep some definite phasic difference between the direct and the reflected rays. At the same time, in order to generate definite interference strength, the number of the point sources should be abounded. Then, is there plenty of such abounded point sources in the solar flaring region? What mechanism can generate such structures?
In fact, the abounded point sources are necessary not only in the interference model of Ledenev, Yan, and Fu (2006), but also in other zebra pattern models. For example, the model of LaBelle et al (2003), in which assumed that the emission is generated from the double plasma resonant layer in coronal loop. The presence of localized density irregularities within the type IV source region leads to trapping of the upper hybrid Z-mode waves in density enhancements, transforms into electromagnetic waves by the electron-cyclotron maser mechanism, and forms the zebra pattern. In such case, the localized density irregularity is a necessary condition, and a number of point sources can meet this condition naturally.
Briefly, the structure with abounded point sources is an important condition for the formation of zebra pattern. Based on the analysis of current-carrying plasma loop model and the related resistive tearing-mode instability, this work proposed that the tearing mode magnetic islands in the current-carrying plasma loop can form a reasonable structure to generate the interference mechanism and produce the Zebra patterns. We introduce the formation of the tearing-mode magnetic islands in current-carrying plasma loop in section 2. Then in section 3, we present a detailed explanation of the interferential rays and the formationtions of Zebra patterns. At the final, some summaries and discussions are given in section 4.
2 Current-carrying Plasma Model and Magnetic Island
There are much of evidences showing that the solar flaring region is always composed with many magnetic flux tubes, and the magnetic flux tubes are always current-carrying plasma loops (Alfven & Carlqvist, 1967; Melrose, 1991, 1995; Ashbourn & Woods, 2004; Tan, 2007; etc). In such loops, the magnetic field can be decomposed into three components: (1) longitudinal component generated from the convection motion of photosphere or sub-photosphere, (2) poloidal component induced by the electric current flowing along the plasma loop, and (3) the radial component which is a disturbed quantity. At the equilibrium state, . Usually, we may define a safety factor to describe the equilibrium property of the current-carrying plasma loops: , is the distance to the axis of the loop (generalized to the section radius ), is the loop radius. When , and and are positive integers, then it defines a rational surface, and represent the poloidal and toroidal mode number, respectively, defines the position of the rational surface. Different and define different rational surfaces. A series of rational surfaces form a coaxial nested configuration (see the Fig.1 and Fig.2 of Tan and Huang, 2006). Between two rational surfaces there are countless irrational surfaces where the safety factor couldn’t be expressed as a ratio of two positive integers.
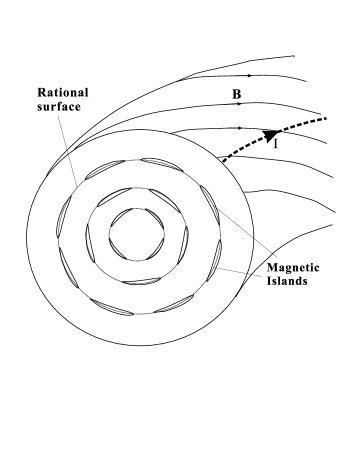
In the above current-carrying plasma loops, the magnetic field lines are helical along the longitudinal direction. There will do exist magnetic shearing between the neighboring rational surfaces with different radius. When the plasma has finite resistivity, the magnetic shear will easily trigger the resistive tearing-mode instability and its evolution (Furth, Rutherford and Selberg, 1973; Specer, 1977; Tan & Huang, 2006). While such process occurs, the magnetic reconnection will take place between the neighboring rational surfaces, and the regular rational surfaces will evolve into a series of magnetic islands. These magnetic islands are distributed spirally along the longitudinal rational surface (left panel in Fig. 4), and behaves like a series of convex mirrors in the three-dimensional space (right panel in Fig. 4). In the inner of the magnetic island, the plasma density increases from the limb to its core, continuously. From the global view, a multiple of magnetic islands distributed like a crystal lattice in the plasma loop.
According to the nonlinear tearing-mode equations, we may obtain the width of the magnetic island: , here , is mainly dominated by the longitudinal electric current , is the disturbed radial magnetic field. Assume that the distribution of the current density in the cross section is in the form of pinch regime (Bennett, 1934): , the total current is , . Then we may obtain the poloidal magnetic field as:
| (1) |
Substitute the above relation into the expression of the magnetic island width:
| (2) |
Here, is generalized radial parameter with respect to the section radius . From Equation (2), we know that the magnetic island width is mainly dominated by the rational surface radius (), total current (), and the disturbed radial magnetic field (). If we suppose: Gs, A, m, when (at the surface of the loop), m; when , m.
According to the theory of resistive tearing-mode instability, the magnetic reconnection is mainly generated from the vicinity of the separatrix and will produce an induced electric field paralleled to the magnetic field (Apicer, 1977; Kuijpers et al, 1981; etc.). With this induced electric field the particles can be accelerated near this place and drive the plasma emission to radiate (Drake et al, 2006; Karlicky and Barta, 2007). Then, what is the size of the emission source? From the dynamic analysis of the nonlinear tearing-mode, we cam obtain the width of the separatrix which is in the same order as the thickness of the magnetic island:
| (3) |
Here, is the growth rate of the tearing-mode instability, plasma resistivity, and plasma density. We need to note that the above result is deduced from the assumption of , and the corresponding plasma density is also concentrate to the axis of the current-carrying plasma loop with decreasing along the section-radius. We may approximately assume that . Then we may let Gs, m-3, eV, and find that the thickness of the magnetic island is about cm at the loop surface , and cm near the center of the loop. Furthermore, when we change the values of the plasma parameter and magnetic field strength, we find that the value is always kept in order of decimeter, and the corresponding frequency is GHz.
3 Formation of interferential rays and explanation of Zebra pattern
3.1 Interference Process
The great number of tearing-mode magnetic islands form a crystal lattice-like structure in the plasma loops. Around each X-point, there will be an induced electric field, the electrons will be accelerated around such place (Drake et al, 2006; Karlicky and Barta, 2007). And the energetic electrons will produce some plasma turbulence, and generate plasma emission (Dulk, 1985) near the magnetic islands. From the above analysis, we may obtain the conclusion that the width of the magnetic islands is about several kilometers which is longer than the wavelengths of metric, decimetric, and centimeter waves, and at the same time the thickness of the magnetic island is about several centimeters which is shorter than the wavelengths from metric to centimeter waves. So the microwave emission source can be considered as a point source. It is narrow-band emission. When the emission propagates from the place near the inner island to the outward, it may meet the outer islands and decompose into two rays, one is the direct ray, and the other is reflected ray through the island. There will have a phase difference between the two rays when they come to the observer. Then they will interfere with each other and form an interference structure. According to the work of Ledenev et al (2006), such interference structure will behave as the Zebra pattern structure. Because of the assumption of pinch regime, the plasma density decreases from the inner to the outer of the loop. As a result, the frequency of the plasma emission also decreases from the inner part to the outer of the loop. So, the emission can escape from the loop, and propagate to the observer.
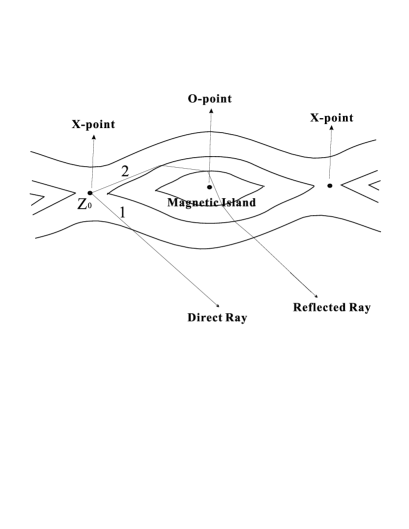
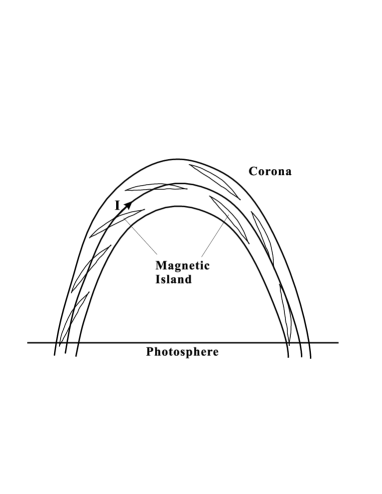
Fig. 5 presents the trajectories of the direct and reflected rays formed from the tearing-mode magnetic islands, both of beam 1 and beam 2 come from . Beam 1 is a direct ray which does not pass through the magnetic island, while beam 2 is a reflected rays which enters the region of magnetic island, undergoes a series of refractions and comes out from the other side of the magnetic island. There will be a phase difference between beam 1 and beam 2 after they run through the island. They will interfere with each other and form a Zebra-like patterns when they meet and be observed by the ground-based radio telescopes.
3.2 Explanation of the Zebra pattern
(1) The upper limitation of frequency of Zebra pattern
From equation (3), we find that when Gs, m-3, eV, the thickness of the magnetic island is in the range of cm. Even if we change the values of the parameters, we always get cm. If the above interference model is valid, then it is reasonable that zebra patterns only occur in the radio emission with frequency lower than 6 GHz, and doesn’t emerge from the observations of millimeter wave or infrared emission, because the wavelength of the latter is much shorter than the thickness of the magnetic islands, the source region couldn’t be regarded as a point source.
(2) the formation of the Zebra stripes
Generally, the microwave emission frequency is mainly related to the magnetic field strength, temperature and plasma density in the source region. Because the size of the magnetic island is very small, the variation of the magnetic filed strength and temperature around the magnetic island in the current-carrying plasma loop is not obvious, we may neglect its effect on the microwave emission frequency. Then the main factor affected to the frequency is the plasma density in the source region. If the emission mechanism of the Zebra pattern structure is mainly the plasma mechanism, the relation between the frequency (unit in Hz) and the plasma density (unit in m-3) is , is the plasma frequency, and the harmonic number. Consisting with the assumption of the distribution of the current density in the cross section, we may also assume that the distribution of the plasma density is in the form of . Then the plasma density decreases from the center of the loop to loop surface. The emission frequency will also decrease from the center of the loop to the loop surface. However, from the above analysis, we know that the Zebra pattern emission is mainly generated from the region around the magnetic islands, which is not distributed continuously, but localized along the rational surface. As a consequence, the emission frequency is not continuous. When the emission is come from the island region with higher density, the frequency is higher. When it comes from the region between two rational surfaces with lower density, then the frequency is lower, and the spectrum presents stripe structures. One stripe represents the emission produced from one rational surface, and different stripes come from different rational surfaces. Fig.2 shows that the Zebra pattern emission flux behaves periodic feature, the period is the frequency gap between two stripes which reflects the difference of the plasma densities between two rational surfaces. If this deduction is valid, we may investigate the inner structure feature of the coronal plasma loop by studying Zebra pattern structures.
(3) the superfine structure of the Zebra stripes
In the work of Chen and Yan (2007), they explained the superfine quasi-periodic structure by using relaxation oscillations, which modulate the electron cyclotron maser emission that forms the Zebra stripes during the processes of wave-particle interaction generated by loss-cone instability of trapped electrons under double plasma resonance (DPR) conditions (Winglee and Dulk, 1986).
However, in the Zebra pattern interference model, the emission is supposed as plasma mechanism with narrow band, the relaxation oscillation is not the suitable mechanism for the superfine structures. From the work of Tan et al (2007) and Tan (2008), we know that the current-carrying plasma loop can drive the tearing-mode oscillations and modulate the microwave emission to form quasi-periodic pulsations with low down to about 30 millisecond periods. Then, it is reasonable to explain that the tearing-mode oscillation of the current-carrying plasma loop can also modulate the emission of the Zebra pattern stripes and form the superfine structures with some millisecond quasi-periodic pulsating features.
(4) the frequency drift
From the above analysis we know that the frequency of Zebra pattern emission is closely related to the plasma density of the current-carrying plasma loop, then all the variations of the plasma density will change the emission frequency and result in a frequency drifting rate. As the order of frequency drifting rate of Zebra pattern is similar to that of the global frequency drifting rate of microwave pulsating structures (Tan et al, 2007), and in that work the global frequency drifting rate of microwave pulsating structures was explained as the motion of the current-carrying plasma loop with respect to the ambient coronal plasmas. Similarly, we may also suppose that the frequency drift rate of the zebra stripes reflects the motion of the current-carrying plasma loop. When the loop moves upwards, then the plasma density decreases generally with time, and the emission frequency will drift from higher to lower, the drifting rate is negative; if the loop moves downwards (for example, shrinkage), the plasma density increases with time, and the emission frequency will drift from lower to higher, the drifting rate is positive.
Based on the assumption of plasma emission mechanism, we have , then the frequency drifting rate can be estimated as:
| (4) |
Here, is the barometric scale height. is the moving velocity of the plasma loop. In most cases km. From the introduction of the example of Fig.1, we know that frequency drift rate of the Zebra stripes is about 55 MHz/s during 02:42:59 – 02:43:03 UT, and -45 MHz/s during 02:43:03 – 02:43:10 UT around the frequency of 3.50 GHz. Substitute these values into equation 4, we may find that the moving velocity of the plasma loop is about 315 km/s downwards during 02:42:59 – 02:43:03 UT and 257 km/s upwards during 02:43:03 – 02:43:10 UT. Here, we simply neglect the effects of the geometrical projections.
At the same time, it is necessary to note that the moving velocity of the plasma loop is proportional to the barometric scale height: . In the flaring region, the magnetic configuration becomes very complex, and the barometric scale height will become smaller than the general cases. Then from Equation (4), we find that the real moving velocity of the plasma loop may become smaller than above estimated values.
With the above assumption of magnetic field and the plasma density, we may get the Alfven velocity is about km/s, which is much faster than the velocity of the current-carrying plasma loops estimated above. So we believe that the motion of the current-carrying plasma loops is only a kind of global motion of which is very slow, and its driver may not be the magnetic interaction. Possibly, it should be related with the convection motion below the atmospheric plasmas.
(5) duration of the Zebra pattern
The previous observations show that the durations of Zebra pattern is in the range of from several seconds to one or two decades seconds. It is most uncommon to distinguish a Zebra pattern with over 30 seconds of duration. From our above analysis, the Zebra pattern structures is possibly formed by a interference mechanism from a great number of tearing-mode magnetic islands. Then the duration of the Zebra pattern structures will approximate to the duration of the resistive tearing-mode instability: (Tan and Huang, 2006; Tan, 2008). By substituting the above parameters, we may get: s. However, it is only when the plasma loop is at the best state, the duration can last for such a long-term. Actually, as the flaring region is very complex, and there will exist many kinds of interferences between the different loops, the Zebra pattern coming from one plasma loop is most frangible by the emission from other loops. So the real duration will be always shorter than the estimated values.
4 Summary and Discussion
From the above analysis and estimations, we obtained the following conclusions: the interference model can give a reasonable explanation of the radio emission with Zebra pattern structures, and the current-carrying plasma loop model can provide all the necessary conditions for the interference model, and can be applied to explain the other features, such as the the superfine structure, the upper frequency limit, the intermediate frequency drifting rate of the zebra stripes, and the durations. If this model is really valid, the zebra pattern can provide an useful tool for studying the current-carrying plasma systems in the solar flaring region. From the scrutinizing of the microwave Zebra pattern structures, we may get much of information about the motion and the inner structure feature of the plasma loop, and can reconstruct the space configuration of the emission source region, because it is believed that they are closely related to the flare primary-energy releasing processes. However, there are much of works need to do theoretically and observationally.
On the other hand, the large numbers of magnetic islands inside the plasma loops can provide much more opportunities to accelerate the large numbers of energetic particles in flare events. According to the previous works (Miller et al, 1997; Vlahos, Isliker & Leperti, 2004; etc), the number of accelerated electrons with energy above 20 keV is roughly electrons in a flare event, and in some X-class flares the number can be reached to electrons . The current-carrying plasma loop model indicates that the particle accelerations may occur not only in the cusp configuration above the coronal loop, but also can take place inside the whole loop. With this model, because the total volume of magnetic islands is much lager than that of the current sheet near the cusp configuration above the loop, and the plasma is denser in the loops, there are much more electrons which can be accelerated by the induced electric field generated from the tearing magnetic reconnections. As for the number of magnetic islands associated with the accelerated electrons, we may give a roughly estimation: the width of the magnetic island is about 2 km, thickness about 5 cm, length can be assumed as 1% of the loop’s length (assumed as about km). Then the volume of one island is in the order of cm3. The plasma density could be assumed cm-3. Then the number of accelerated electrons around one island is about . In order to meet the number of electrons s-1 accelerated in big flares, the number of islands should be . If we suppose the number of flux tubes in the flaring region is about 10 – 100, then there are about magnetic islands in one plasma loop. We may find that the volume of all islands is only a small fraction ( 0.1%) in the flaring region. In fact, it was a big problem to explain the number of electrons s-1 accelerated in some X-class flares perfectly. However, in this work, it is not our main task to investigate the particle acceleration, the above discussion is only a roughly estimation.
Excited by these energetic particles accelerated around the tearing-mode magnetic islands in the current-carrying plasma loops, a series of fine structures will be formed in the microwave spectrograms. In fact, by using this model, we explained the fast quasi-periodic pulsations occurred in the famous flare event of 13 Dec. 2006 (Tan et al, 2007). This work is an another attempt. However, it needs to study in more detailed.
Acknowledgements
The author would like to thank the anonymous referee very much for the helpful and valuable comments on this paper. This work was supported by NSFC Grant No. 10733020, 10873021, CAS-NSFC Key Project (Grant No. 10778605), and the National Basic Research Program of the MOST (Grant No. 2006CB806301).
References
- Altyntsev (2005) Altyntsev A. T., Kuznetsov A. A., Meshalkina N.S., Rudenko G. V., Yan Y., 2005, Astron. Astrophys. 431, 1037
- Alfven (1967) Alfven H. and Carlqvist P., 1967, Solar Phys. 1, 220
- Ashbourn (2004) Ashbourn J.M.A. and Woods L.C., 2004, Astrophys. J. 602, 1021
- Bennett (1934) Bennett W.H., 1934, Phys. Rev. 45, 90
- Chen (2007) Chen B., Yan Y.H., 2007, Solar Phys. 246, 431
- Chernov (2003) Chernov G.P., Yan Y.H., Fu Q.J., 2003, Astron. Astrophys. 406, 1071
- Chernov (2005) Chernov G.P., Yan Y.H., Fu Q.J., and Tan C.M., 2005, Astron. Astrophys.437, 1047
- Chernov (2008) Chernov G.P., Yan Y.H., Fu Q.J., Tan C.M., and Wang S.J., 2008, Solar Phys. 250, 115
- Chiuderi (1973) Chiuderi C., Giachetti R., and Rosenberg H., 1973, Solar Phys. 33, 25
- Drake (2006) Drake J. F., Swisdak M., Che H., and Shay M.A., 2006, Nature 443, 553
- Dulk (1985) Dulk G. A., 1985, Ann. Rev. Astron. Astrophys. 23, 169
- Fomichev (1981) Fomichev V. V. and Fainshtein S. M., 1981, Solar Phys. 71, 1071
- Furth (1973) Furth H.P., Rutherford P.H., and Selberg H., 1973, Phys. Fluids 16, 1054
- Karlicky (2007) Karlicky M., and Barta M., 2007, Astron. Astrophys.464, 735
- Kuijpers (1975) Kuijpers J., 1975, Astron. Astrophys. 40, 405
- Kuijpers (1981) Kuijpers J., van der Post, and Slottje C., 1981, Astron. Astrophys. 103, 331
- LaBelle (2003) LaBelle J., Treumann R. A., Yoon P.H., and Karlichy, 2003, Astrophys. J.593, 1195
- Ledenev (2001) Ledenev V. G., Yan Y, and Fu Q, 2001 Chin. J. Astron. Astrophys. 1, 475
- Ledenev (2006) Ledenev V. G., Yan Y., and Fu Q., 2006,Solar Phys. 233, 129
- Melrose (1991) Melrose D. B., 1991, Astrophys. J. 381, 306
- Melrose (1995) Melrose D. B., 1995, Astrophys. J. 451, 391
- Miller et al (1997) Miller J. A., Cargill P.J., Emslie A.G., Holman G.D., Dennis B.R., LaRosa T.N., Winglee R.M., Benka S.G., and Tsuneta S., 1997, J. Geophys. Res. 102, 14631
- Mollwo (1983) Mollwo L., 1983,Solar Phys. 83, 305
- Ning (2000) Ning, Z., Yan Y., Fu Q., and Lu Q., 2000, Astron. Astrophys. 364, 793
- Rosenberg (1972) Rosenberg H., 1972,Sol. Phys. 51, 188
- Spicer (1977) Spicer D.S., 1977,Sol. Phys. 53, 305
- Slottje (1972) Slottje C, 1972, Solar Phys. 25, 210
- Tan & Huang (2006) Tan B.L., and Huang G.L., 2006, Astron. Astrophys. 453, 321
- Tan (2007) Tan B.L., 2007, Adv. Space Res. 39, 1826
- Tan et al (2007) Tan B.L.,Yan Y.H., Tan C.M., and Liu Y.Y., 2007, Astrophys. J. 671, 964
- Tan (2008) Tan B.L., 2008, Solar Phys. 253, 117
- Vlahos (2004) Vlahos L., Isliker H. and Lepreti F., 2004, Astrophys. J. 608, 540
- Winglee (1986) Winglee R.M., and Dulk G.A., 1986, Astrophys. J. 307, 808
- Zaitsev (1983) Zaitsev V. V. and Stepanov A. V., 1983, Sol. Phys. 88, 297
- Zheleznyakov (1975) Zheleznyakov V.V. and Zlotnik E. YA, 1975, Solar Phys. 44, 461