Deep multi-frequency radio imaging in the Lockman Hole: II. The spectral index of submillimetre galaxies
Abstract
We have employed the Giant Metre-wave Radio Telescope (GMRT) and the Very Large Array (VLA) to map the Lockman Hole. At 610 and 1,400 MHz, we reach noise levels of 15 and 6 Jy beam-1, respectively, with well-matched resolutions (5 arcsec). At this depth we obtained reliable detections for about half of the known submm galaxies (SMGs) in the field. For radio-identified SMGs, which are typically at , we measure a mean radio spectral index of (where ) and standard deviation of , between approximate rest-frame frequencies of 1.8 and 4.2 GHz. The slope of their continuum emission is indistinguishable from that of local star-forming galaxies and suggests that extended optically-thin synchrotron emission dominates the radio output of SMGs. Cooling effects by synchrotron emission and Inverse Compton (IC) scattering off the cosmic microwave background (CMB) do not seem to affect their radio spectral energy distributions (SEDs). For those SMGs judged by Spitzer mid-infrared (-IR) colours and spectroscopy to host obscured active galactic nuclei (AGN), we find a clear deviation from the rest of the sample – they typically have steeper radio spectral indices . These findings suggest these mid-IR-/AGN-selected SMGs may have an intrinsically different injection mechanism for relativistic particles, or they might reside in denser environments. This work provides a reliable spectral template for the estimation of far-IR/radio photometric redshifts, and will enable accurate statistical -corrections for the large samples of SMGs expected with SCUBA-2 and Herschel.
keywords:
galaxies: high-redshift — Galaxies, galaxies: active, starburst — Galaxies, radio continuum — Sources as a function of wavelength, submillimetre1 Introduction
SMGs were discovered in the late 1990s (Smail et al., 1997) using the Submillimetre (submm) Common-User Bolometer Array (SCUBA – Holland et al., 1999) on the 15-m James Clerk Maxwell Telescope (JCMT). SCUBA had been designed to exploit the so-called “negative -correction” in the submm waveband, allowing the detection of very distant dusty galaxies almost unbiased in redshift up to . The discovery of these massive, rapidly star-forming galaxies (star-formation rate – SFR ), each potentially capable of creating a massive elliptical galaxy within 1 Gyr, has provided a powerful motivation for improving models of galaxy formation and evolution (e.g. Swinbank et al. 2008). SMGs are believed by many to be the parent population of present-day elliptical galaxies and contribute () for approximately 20 per cent of the cosmic IR background (CIRB) at m (Eales et al. 1999). Understanding the nature of these galaxies has been extremely challenging, a situation influenced by the poor resolution of submm images and the resulting confusion at noise levels required to detect significant numbers of SMGs, and also by their intrinsically high redshifts (mean for radio-detected SMGs – Chapman et al. 2005) and dusty nature which make optical detections difficult – radio and IR detections have been usually employed to address these issues (e.g. Ivison et al. 2007).
Radio imaging has played a key role in characterising SMGs (e.g. Ivison et al., 2002) providing a high-resolution proxy for the rest-frame far-IR emission via the far-IR/radio correlation (Helou et al., 1985; Appleton et al., 2004; Ibar et al., 2008). The radio waveband is a relatively unexplored part of the SED where current studies have adopted a canonical power-law form, , based on local star-forming galaxies with or (Condon, 1992), and a relatively small dispersion, . However, Hunt & Maiolino (2005) questioned this assumption for SMGs, arguing that the adoption of is not based on any relevant observational evidence. Flatter radio SEDs – typical of blue compact dwarf galaxies or some powerful ultraluminous IR galaxies (ULIRGs, e.g. Arp 220, with ; Smith et al. 1998) – were preferred in Hunt & Maiolino’s photometric redshift analyses of SMGs. Indeed, Clemens et al. (2008) recently measured a mean spectral index of between 1.4 and 4.8 GHz for a sample of local ULIRGs (the local ‘cousins’ of SMGs), although this steepens to and between 4.8–8.4 and 8.4–22.5 GHz, respectively. The presence of dominant, compact, flat-spectrum, synchrotron-self-absorbed AGN cores in the SMG population cannot be ruled out either.
Kovács et al. (2006) employed 350-m observations of 15 radio-detected SMGs with known redshifts to constrain their characteristic temperatures. In doing so, they claimed to see the first signs of a deviation from the far-IR/radio correlation exhibited locally, (where is the total dust luminosity and is the rest-frame radio luminosity), the ubiquity of which has surprised astronomers for decades. Kovács et al. suggested that SMGs are over-luminous at radio frequencies with respect to the far-IR, finding a mean . Modelling by Swinbank et al. (2008) suggested that this value is not a result of sample selection but of real evolution of the far-IR/radio correlation. Kovács et al. noted, however, that correcting the radio spectral indices by 0.35 would move SMGs back onto the far-IR/radio correlation (see §4).
Theoretically, at the redshifts typical of SMGs we expect to observe steeper radio spectral indices due to the shift of the frequency break produced by ageing effects (e.g. Carilli & Yun 1999), and/or IC scattering off the CMB – going as (e.g. Klamer et al. 2006). Indeed, bright radio samples selected on the basis of their steep () spectral indices – so-called ultra-steep-spectrum (USS) sources – have been found to contain a large number of high-redshift galaxies (e.g. De Breuck et al., 2000). Given their high redshifts, their large masses and their probable relation to galaxy formation in proto-clusters, we might expect to find similarities in radio spectral indices between SMGs and USS sources. We note, however, that there are major differences between these populations: radio-identified SMGs are much fainter than typical USS radio galaxies and star formation (rather than AGN) clearly provides the majority of their power (Frayer et al., 1998). The fraction of SMGs with obvious AGN is relatively small, although Compton-thick AGN may contribute significantly to the bolometric emission in some cases. Different approaches have been used to measure the actual AGN contribution; spectroscopic/photometric mid-IR diagnostics (e.g. Menéndez-Delmestre et al., 2009), high resolution radio imaging (e.g. Biggs & Ivison 2008), X-ray detections/stacking (e.g. Alexander et al. 2003), and deviations from the FIR/radio correlation (e.g. Kovács et al. 2006).
We thus have strong motives for exploring the radio spectral index of SMGs: to provide an independent description of their radio SEDs, to enable more accurate radio -corrections, to better test whether the far-IR/radio correlation evolves, and to find possible new AGN diagnostics. Here, we report deep, dual-frequency, matched-resolution radio observations in the Lockman Hole that were designed to address these issues.
2 Multi-wavelength observations in the Lockman Hole
2.1 Parent catalogue of submm galaxies
As one of the SCUBA Half Degree Extragalactic Survey (SHADES) fields, 485 arcmin2 of the Lockman Hole was observed with SCUBA on JCMT at 850 m, producing images with a fwhm beamsize of 14.8 arcsec. In this work, we use the catalogue provided by Coppin et al. (2006), comprising 57 sources detected with a signal-to-noise ratio, in more than one independent reduction of the data. The sample includes only sources with a low probability (5 per cent) that the true, deboosted flux density is lower than zero (i.e. that the source is entirely spurious).
The Lockman Hole was also observed using the Astronomical Thermal Emission Camera (AzTEC – Wilson et al., 2008) on JCMT at 1,100 m (Austermann et al., 2009). This survey covers a large area: 1,115 arcmin2, to an r.m.s. of 0.9–1.3 mJy beam-1 (18 arcsec fwhm). In this work, we use the Austermann et al. sample of 51 sources with and , i.e. the same definition used by Coppin et al..
The MAx-Planck Millimeter BOlometer array (MAMBO-117 Kreysa et al., 1999) on the Instituto de Radioastronomia Milimétrica (IRAM) 30-m telescope has also been used to image the Lockman Hole. Greve et al. (2004) acquired data at 1,200 m, covering 197 arcmin2 down to an r.m.s. of 0.6 mJy beam-1 (11 arcsec, fwhm). We use the Greve et al. catalogue which contains 23 sources with .
The combination of AzTEC, SCUBA and MAMBO imaging makes the Lockman Hole the largest area of sky mapped at 850, 1,100 and 1,200 m. Combining the three samples results in an overall sample of 111 SMGs (20 of which were detected in more than one sample) which we have adopted for cross-matching with our radio catalogues. We opted not to use the Bolocam catalogue by Laurent et al. (2005) because of the confusion resulting from the large beam (31 arcsec fwhm).
2.1.1 AGN in the sample
Spectroscopic analyses using Spitzer’s IR Spectrograph (IRS – Houck et al., 2004) to identify the mid-IR power source in SMGs (e.g. Pope et al., 2008; Menéndez-Delmestre et al., 2009) have confirmed earlier indications that they are usually powered by extreme star formation rather than by AGN activity. Indeed, based on composite median template of a sample of 24 radio-identified SMGs, Menéndez-Delmestre et al. find a typical AGN contribution of per cent to the bolometric mid-IR emission.
However, some of the AzTEC and SCUBA sources in the SHADES fields were selected for IRS observations using colour criteria designed to preferentially select highly obscured AGN (Coppin et al., in preparation). A sample of six such sources was targeted in the Lockman Hole, from which four have a dominant (50-per-cent) AGN contribution to their mid-IR spectra. We use this sub-sample to find possible deviations in the behaviour of radio spectral indices (see §3).
2.2 GMRT and VLA imaging
We have obtained deep radio observations in the Lockman Hole using the GMRT111GMRT is run by the National Centre for Radio Astrophysics of the Tata Institute of Fundamental Research. and the National Radio Astronomy Observatory’s (NRAO) VLA222NRAO is operated by Associated Universities Inc., under a cooperative agreement with the National Science Fundation., operated at 610 and 1,400 MHz, respectively. The two image mosaics have r.m.s. noise levels in the central regions of 15 and 6 Jy beam-1 and synthesised beams (fwhm) of and arcsec2, respectively (see a full description in Ibar et al. 2009).
In this work, we investigate the radio spectral indices of the SMG sample described in §2.1, exploiting our Lockman Hole radio data down to a peak-to-noise ratio, – where peak and noise refer to the maximum value of a 2-D Gaussian fit and the local r.m.s., respectively. Given the resolution of our radio imaging (4–7 arcsec, fwhm) and the typical kpc scale of SMGs (e.g. Biggs & Ivison, 2008), we have considered the SMG counterparts to be unresolved. We have extracted flux densities with the source size in the sad Gaussian fitting routine within the Astronomical Image Processing System333see http://www.aips.nrao.edu/cook.html for a description of tasks. () set to the size of the synthesised beam (dowidth = 1), which results in a less uncertain integrated flux density estimate because of the lower number of free parameters in the Gaussian fit. Monte Carlo simulations based on fake Gaussians injected in a residual map (with no 5- peaks) using immod and extracted using sad show a clear improvement (1.2 less scatter in the out:in flux density ratios at ) by fixing the synthesised beam in this way. Fewer outliers are seen as well.
There is an important caveat concerning the use of these faint, low-PNR sources: a very large fraction of the sources detected at faint flux densities are due to the background noise. To determine the prevalence of spurious sources in the samples, we inspected the number of 3- sources extracted from the inverted residual map. The cumulative number of negative sources, , increased rapidly toward faint flux densities, overwhelming the number counts of the ’positive’ sources at Jy and Jy. This indicates that an extrapolation of the number counts to Jy (Jy), based on sources with higher flux densities, will thus underestimate the number of extracted sources in the field. This is relevant as we need to know the probability of random associations between SMGs and faint radio sources.
2.3 Radio identifications
Associating SMGs with radio counterparts has usually been accomplished using probabilistic arguments (e.g. Ivison et al. 2007). We have chosen to cross-match the parent SMG catalogue with our radio maps (§2.2) using a selection criterion, meaning that the probability of a spurious association is less than 5 per cent (Downes et al. 1986). This probability has two dependencies – the radius within which we search for radio counterparts and the cumulative radio source number count distribution per surface unit, . The search radius was chosen to be 3 the uncertainty in the submm position (in Right Ascension or Declination), as estimated using Eq. B22 of Ivison et al. (2007), i.e. dependent on the submm SNR, with 12.0, 14.4 and 8.8 arcsec for SCUBA, AzTEC and MAMBO detections; we expect 1 per cent of the true counterparts to lie outside our search area. For the number count dependency, we used all 3- radio detections to find the true probability of random association. Nevertheless, if the source was detected at both radio wavelengths (unlikely to be noise) we used a negative-subtracted cumulative radio source number count distribution instead, , in order to give a better proxy for the number of real sources. We note, however, that the power of this -identification procedure is lessened for very large submm beams and/or low SNRs because the purely statistical approach is unable to discriminate against unrelated radio-bright sources (preferentially radio-loud AGN) at large separations.
We adopted a conservative approach, eliminating from the analysis all SMGs with more than two radio sources that could affect the measurement of the radio spectral index, thus biasing our sample against close mergers. A final inspection by eye was used to eliminate sources with confused associations. The final sample comprised 44 SMGs (from a total of 111) with single and reliable radio counterparts in at least one radio waveband (41 and 37 detections by the VLA and GMRT, respectively).
3 The radio spectral index of SMGs
3.1 Observations
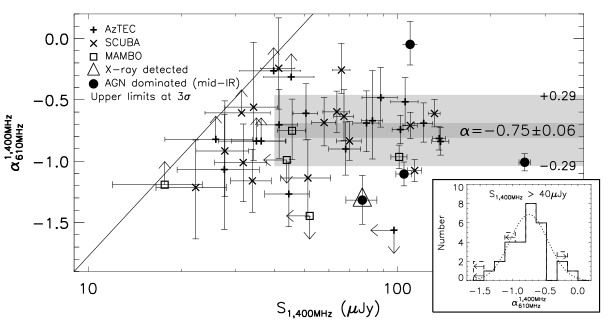
In Fig. 1, we show the radio spectral indices of the 44 radio-selected SMGs as a function of flux density at 1,400 MHz. The vast majority of these sources were detected at low flux densities, Jy, close to the detection limits of even the deepest radio imaging.
The study of the radio spectral index has a clear bias introduced by the detection threshold in each map. The solid black line in Fig. 1 shows the restriction for detecting flat-spectrum sources at faint 1,400-MHz radio fluxes, based on a minimum - source at Jy in the deepest region of the 610 MHz image (note that noise varies within a factor of 2 with position in the maps). In order to reduce the effect of this bias, we have restricted the statistical analysis to those sources with Jy only (see shaded area in Fig. 1). From this sub-sample, 28 were detected at both radio wavelengths, while one and three were detected only by the VLA and GMRT, respectively. We find – for those SMGs detected at both radio frequencies – a bootstrapped median radio spectral index of , a mean of and standard deviation of . In the data, there is no clear correlation between , radio and submm flux densities, suggesting the radio spectral indices of the radio-identified SMGs shown in this work may provide a good template for SMGs below the current submm confusion limit.
By looking at the sample of four AGNs selected via mid-IR spectroscopic analysis (§2.1.1; Coppin et al., in preparation), we find all of them have a reliable measurement (§2.3). Although a small sample, restricted to bright mid-IR fluxes, their radio properties clearly deviate from those of the other SMGs (filled black circles in Fig. 1). One is a flat-spectrum source, , while the other three present steep radio spectra, .
The different nature of these sources is also evidenced by the detection of the steepest radio source (mid-IR AGN-dominated) in X-rays (Brunner et al. 2008) showing clear evidence of a highly obscured AGN – in agreement with Coppin et al.’s criteria – we note this is the only SMG with a clear X-ray detection. Flat radio spectra are also related to blazar or powerful compact AGNs and are usually interpreted as the synchrotron self-absorbed base of a “young” expanding jet that fuels larger scale radio emission lobes.
4 Discussion
The observed radio spectral indices for SMGs, at approximately rest-frame 1.8 – 4.2 GHz for , are similar to either those found in local star-forming galaxies (Condon 1992) and to the bulk of the sub-mJy radio sources found by Ibar et al. (2009). The flux density range at which the vast majority of the SMGs are found, Jy, suggests they may compose a significant fraction of the radio population responsible for the flattening of the Euclidean radio number counts.
Assuming the physics of the synchrotron emission does not evolve as a function of redshift, these results suggest that non-thermal optically thin synchrotron emission dominates in the majority of SMGs. This suggests magnetic fields are large enough to retain cosmic rays (see Thompson et al. 2006) and contradicts the idea that flatter radio SEDs – such as those thermally dominated galaxies (Hunt & Maiolino, 2005) or in synchrotron self-absorbed sources – are more appropriate SEDs for these massive star-forming galaxies. Indeed, the lack of flat spectrum sources suggests that their emission is mostly dominated by extended rather than compact radio structures, in agreement with previous SMG high-resolution radio observations (Chapman et al. 2004; Biggs & Ivison 2008) and the low mid-IR extinctions found by Menéndez-Delmestre et al. (2009).
The lack of evidence for spectral steepening with respect to local star-forming galaxies suggests that -correction effects in curved SEDs and IC scattering enhanced by a denser CMB radiation field at high redshift (Klamer et al. 2006; Miley & De Breuck 2008) do not have a strong influence on the observed radio spectral index of these high-redshift galaxies. The possibility of intrinsic redshift evolution to flatter radio spectra, where curved SEDs (due to synchrotron and IC cooling) steepen them back to the observed values, cannot be ruled out.
The steeper radio spectral indices found for the mid-IR AGN-dominated sources are intriguing. Recent studies of USS samples (also at high redshift and mostly AGN) using multi-frequency radio observations have found no spectral curvature at higher frequencies in these samples. The power-law behaviour suggests steep radio spectra in high-redshift AGN are intrinsic, or a product of environment (Bryant et al., 2009). The former relates to a different mechanism for the injection of the initial electron energy distribution (e.g. Jaffe & Perola, 1973; Carilli & Yun, 1999) which determine the reservoir of high-energy particles – we expect to observe steeper radio spectra if there is no continuous injection or re-acceleration of relativistic particles across the galaxy. On the other hand, if the source is embedded in a dense medium, some of the energy of the particles would be released into the environment and stronger magnetic fields may increase the cooling rate (Thompson et al. 2006), i.e. the radio SED would become steeper.
Based on the fact that we do not observe steeper radio spectral indices in the bulk of the SMGs, these findings may suggest that the synchrotron emission in AGN is fundamentally different to the emission seen in massive star-forming galaxies. If we assume the vs redshift correlation found in brighter radio samples (De Breuck et al. 2000), it is possible that the synchrotron radiation emitted by nuclear activity evolves differently as a function of cosmic time than that emitted due to star formation. Nevertheless, there are major differences between USS and SMGs as pointed out in §1.
We have checked the possibility for an overestimation of the radio luminosities in the sample analysed by Kovács et al. (2006). From the 9 SMGs in the Lockman Hole (Table 1 from their paper), 5 of them have got a reliable estimate of radio spectral index, (bootstrapped median). Based on these detections, it seems that their sample is not particularly affected by peculiar radio -corrections that may explain the observed deviation from the local far-IR/radio correlation.
A future analysis – using radio observations from the LOw Frequency ARray (LOFAR) and Expanded VLA to cover a wide range of frequency, for samples with well-constrained redshifts – will allow us to give a much better description of the synchrotron emission processes in massive star-forming galaxies and radio faint AGN. An independent assessment can also be obtained using high-resolution radio observations in order to determine the physical extent, morphology, luminosity and brightness temperature of their emitting regions.
5 Conclusions
We have analysed the radio spectral indices, , based on well-matched observations with GMRT at 610 MHz and the VLA at 1,400 MHz, of a sample of SMGs selected in the Lockman Hole using the AzTEC, SCUBA, and MAMBO cameras.
We have created a sample of 44 SMGs (from a total of 111 unique SMGs) which have secure radio identifications and reliable estimates of radio spectral index. We report how deep GMRT observations have resulted in a detection rate similar to that usually accomplished with the VLA. We find a mean value of (see Fig. 1), suggesting the majority of SMGs are dominated by optically thin synchrotron emission from extended radio structures; star-forming regions and/or AGN lobes. The distribution of spectral indices for SMGs is indistinguishable from that of local star-forming galaxies. This supports the idea that SMGs are dominated by processes typical of dusty star-forming galaxies rather than those seen in AGN. If we assume that there is no intrinsic redshift evolution for the synchrotron emission mechanism, we find that ageing effects and IC scattering off the CMB does not seem to largely affect – steepen – the bulk of the observed radio spectral indices. We do not observe any dependency of the radio spectral index on the submm/radio flux density ratio, or on submm or radio flux densities, which suggests the radio spectral properties found in this work should also be representative of the SMGs below the current confusion limits.
We have found that the radio spectral indices of SMGs with an AGN-dominated mid-IR spectrum deviate from the bulk of the sample. They typically have either steeper radio spectral indices, – similar to USS sources found in bright radio samples – or flat spectra. These findings suggest a different mechanism responsible for the synchrotron emission in these sources: either related to the injection mechanism of relativistic plasma, or a product of the environment. Their deviation to steeper spectral indices could be an evidence for a different cosmic radio evolution with respect to massive star-forming galaxies. Besides of the small sample of sources, radio spectral index thus represents a useful selection criterion for identifying AGN in high-redshift SMGs.
Looking to the future, these results can be used for statistical analyses of the large SMG samples anticipated from SCUBA-2 and from Herschel. Our parameterisation of the radio SED of SMGs will allow reliable -corrections for flux densities in the 1-GHz regime, and will alleviate degeneracies faced by long-wavelength photometric redshift techniques.
Acknowledgements
This paper was supported by a Gemini research studentship. We thank the staff of the GMRT for making these observations possible. EI, RJI, PNB, KEKC, IRS and JSD acknowledge support from UK Science and Technology Research Council.
References
- Alexander et al. (2003) Alexander D. M. et al., 2003, AJ, 125, 383
- Appleton et al. (2004) Appleton P. N. et al., 2004, ApJS, 154, 147
- Austermann et al. (2009) Austermann J. E. et al., 2009, ArXiv e-prints
- Biggs & Ivison (2008) Biggs A. D., Ivison R. J., 2008, MNRAS, 385, 893
- Brunner et al. (2008) Brunner H., Cappelluti N., Hasinger G., Barcons X., Fabian A. C., Mainieri V., Szokoly G., 2008, A&A, 479, 283
- Bryant et al. (2009) Bryant J. J., Johnston H. M., Broderick J. W., Hunstead R. W., De Breuck C., Gaensler B. M., 2009, MNRAS, 395, 1099
- Carilli & Yun (1999) Carilli C. L., Yun M. S., 1999, ApJ, 513, L13
- Chapman et al. (2005) Chapman S. C., Blain A. W., Smail I., Ivison R. J., 2005, ApJ, 622, 772
- Chapman et al. (2004) Chapman S. C., Smail I., Windhorst R., Muxlow T., Ivison R. J., 2004, ApJ, 611, 732
- Clemens et al. (2008) Clemens M. S., Vega O., Bressan A., Granato G. L., Silva L., Panuzzo P., 2008, A&A, 477, 95
- Condon (1992) Condon J. J., 1992, ARA&A, 30, 575
- Coppin et al. (2006) Coppin K. et al., 2006, MNRAS, 372, 1621
- De Breuck et al. (2000) De Breuck C., van Breugel W., Röttgering H. J. A., Miley G., 2000, AAPS, 143, 303
- Downes et al. (1986) Downes A. J. B., Peacock J. A., Savage A., Carrie D. R., 1986, MNRAS, 218, 31
- Eales et al. (1999) Eales S., Lilly S., Gear W., Dunne L., Bond J. R., Hammer F., Le Fèvre O., Crampton D., 1999, ApJ, 515, 518
- Frayer et al. (1998) Frayer D. T., Ivison R. J., Scoville N. Z., Yun M., Evans A. S., Smail I., Blain A. W., Kneib J.-P., 1998, ApJ, 506, L7
- Greve et al. (2004) Greve T. R., Ivison R. J., Bertoldi F., Stevens J. A., Dunlop J. S., Lutz D., Carilli C. L., 2004, MNRAS, 354, 779
- Helou et al. (1985) Helou G., Soifer B. T., Rowan-Robinson M., 1985, ApJ, 298, L7
- Holland et al. (1999) Holland W. S. et al., 1999, MNRAS, 303, 659
- Houck et al. (2004) Houck J. R. et al., 2004, in Presented at the Society of Photo-Optical Instrumentation Engineers (SPIE) Conference, Vol. 5487, Mather J. C., ed, Society of Photo-Optical Instrumentation Engineers (SPIE) Conference Series, p. 62
- Hunt & Maiolino (2005) Hunt L. K., Maiolino R., 2005, ApJ, 626, L15
- Ibar et al. (2008) Ibar E. et al., 2008, MNRAS, 386, 953
- Ibar et al. (2009) Ibar E., Ivison R. J., Biggs A. D., Lal D. V., Best P. N., Green D. A., 2009, MNRAS, 397, 281
- Ivison et al. (2007) Ivison R. J. et al., 2007, MNRAS, 380, 199
- Ivison et al. (2002) Ivison R. J. et al., 2002, MNRAS, 337, 1
- Jaffe & Perola (1973) Jaffe W. J., Perola G. C., 1973, A&A, 26, 423
- Klamer et al. (2006) Klamer I. J., Ekers R. D., Bryant J. J., Hunstead R. W., Sadler E. M., De Breuck C., 2006, MNRAS, 371, 852
- Kovács et al. (2006) Kovács A., Chapman S. C., Dowell C. D., Blain A. W., Ivison R. J., Smail I., Phillips T. G., 2006, ApJ, 650, 592
- Kreysa et al. (1999) Kreysa E. et al., 1999, Infrared Physics and Technology, 40, 191
- Laurent et al. (2005) Laurent G. T. et al., 2005, ApJ, 623, 742
- Menéndez-Delmestre et al. (2009) Menéndez-Delmestre K. et al., 2009, ApJ, 699, 667
- Miley & De Breuck (2008) Miley G., De Breuck C., 2008, AApR, 15, 67
- Pope et al. (2008) Pope A. et al., 2008, ApJ, 689, 127
- Smail et al. (1997) Smail I., Ivison R. J., Blain A. W., 1997, ApJ, 490, L5
- Smith et al. (1998) Smith H. E., Lonsdale C. J., Lonsdale C. J., 1998, ApJ, 492, 137
- Swinbank et al. (2008) Swinbank A. M. et al., 2008, MNRAS, 391, 420
- Thompson et al. (2006) Thompson T. A., Quataert E., Waxman E., Murray N., Martin C. L., 2006, ApJ, 645, 186
- Wilson et al. (2008) Wilson G. W. et al., 2008, MNRAS, 386, 807