Gas Mass Fractions and Star Formation in Blue-Sequence E/S0 Galaxies
Abstract
Recent work has identified a population of low-redshift E/S0 galaxies that lie on the blue sequence in color vs. stellar mass parameter space, where spiral galaxies typically reside. While high-mass blue-sequence E/S0s often resemble young merger or interaction remnants likely to fade to the red sequence, we focus on blue-sequence E/S0s with lower stellar masses ( a few ), which are characterized by fairly regular morphologies and low-density field environments where fresh gas infall is possible. This population may provide an evolutionary link between early-type galaxies and spirals through disk regrowth. Focusing on atomic gas reservoirs, we present new GBT HI data for 27 E/S0s on both sequences as well as a complete tabulation of archival HI data for other galaxies in the Nearby Field Galaxy Survey. Normalized to stellar mass, the atomic gas masses for 12 of the 14 blue-sequence E/S0s range from 0.1 to 1.0, demonstrating that morphological transformation is possible if the detected gas can be converted into stars. These gas-to-stellar mass ratios are comparable to those of spiral and irregular galaxies and have a similar dependence on stellar mass. Assuming that the HI is accessible for star formation, we find that many of our blue-sequence E/S0s can increase in stellar mass by 10–60% in 3 Gyr in both of two limiting scenarios, exponentially declining star formation (i.e., closed box) and constant star formation (i.e., allowing gas infall). In a constant star formation scenario, about half of the blue-sequence E/S0s require fresh gas infall on a timescale of 3 Gyr to avoid exhausting their atomic gas reservoirs and evolving to the red sequence. We present evidence that star formation in these galaxies is bursty and likely involves externally triggered gas inflows. Our analysis suggests that most blue-sequence E/S0s are indeed capable of substantial stellar disk growth on relatively short timescales.
Subject headings:
galaxies: elliptical and lenticular, cD — galaxies: evolution1. Introduction
Current models of galaxy formation and evolution favor hierarchical growth of galaxies from smaller systems (e.g., White & Frenk 1991; Somerville & Primack 1999; Bower et al. 2006). Within the paradigm of hierarchical galaxy formation, galaxies evolve along the Hubble sequence, transforming back and forth between E/S0 and spiral/irregular morphology through a series of quiescent and violent periods.
Recognition that galaxies can transform from late to early type dates back at least to Toomre & Toomre (1972), who proposed that elliptical galaxies can form from mergers of similar mass late-type galaxies. Recent simulations find that while similar mass (1:1–3:1) mergers of disk galaxies result in classical ellipticals, unequal mass (4.5:1–10:1) or gas-rich mergers of galaxies result in S0s and hybrid galaxies with properties of both early and late types (Bekki, 1998; Naab et al., 2006; Bournaud et al., 2005). Substantial observational evidence confirms that early-type galaxies can form through major mergers (e.g., Schweizer & Seitzer 1992; van Dokkum 2005). In agreement with the simulations, Emsellem et al. (2007) argue that larger, slow-rotating elliptical galaxies form from dry major mergers while fainter, fast-rotating ellipticals and S0s seem to form from minor mergers or very gas-rich major mergers.
Can galaxies evolve in the other direction, from early to late type? Simulations suggest that galaxy evolution in this direction involves the regrowth of stellar disks (Steinmetz & Navarro, 2002; Governato et al., 2007). Morphological transformation from early to late type requires that several conditions be met, which recent studies have found satisfied in some early-type galaxies.
First, the transformation from early- to late-type requires a substantial reservoir of cold gas — the raw material for disk regrowth. Historically, early-type galaxies were thought to be gas-poor (Faber & Gallagher, 1976; Knapp et al., 1978). Subsequent surveys, however, found that the ratio of gas mass to blue luminosity () in early-type galaxies ranges from upper limits of to measured for large atomic gas reservoirs similar to those of spiral galaxies (Hawarden et al., 1981; Knapp et al., 1985; Wardle & Knapp, 1986; Sadler et al., 2000; Oosterloo et al., 2002). The 70% HI detection rate by Morganti et al. (2006) suggests that atomic gas reservoirs are actually relatively common in field early-type galaxies. Recent surveys also find a significant amount of molecular gas (–) in 28–78% of early-type galaxies, depending on the survey (Lees et al., 1991; Knapp & Rupen, 1996; Welch & Sage, 2003; Sage et al., 2007; Combes et al., 2007). The large range in cold gas content hints that there may be distinct sub-populations of early-type galaxies — the conventional red and dead early types, and a population that is still accreting gas and forming stars.
In addition to the presence of cold gas, the distribution of the gas is important in assessing the potential for disk regrowth. The existence of giant HI disks and rings (Morganti et al., 1997; Serra et al., 2007), as predicted by simulations of mergers between gas-rich galaxies (Barnes, 2002), makes it possible for stellar disks to form from already-present gas disks. The HI structures around some early-types galaxies are known to have regular velocity fields, with a continuity between ionized and neutral gas (van Gorkom et al., 1986; Schweizer et al., 1989; Schiminovich et al., 1995; Morganti et al., 2006). Hibbard & van Gorkom (1996) find a rotationally supported HI disk in the elliptical galaxy NGC 520, which, if star formation is triggered in the disk, may generate a late-type galaxy. Kiloparsec-scale disks of regularly rotating molecular gas have also been found in the center of some early-type galaxies (Young, 2002, 2005; Young et al., 2008; Crocker et al., 2008). All these observations suggest that the gas disks around some, possibly most early-type galaxies have reached an equilibrium arrangement suitable for disk growth.
While the presence of cold gas disks in an equilibrium configuration is necessary for stellar disk growth, it does not imply that star formation is actually occurring. A key question is whether E/S0 galaxies with such disks are currently evolving morphologically, and whether such galaxies constitute a significant fraction of the early-type galaxy population. To answer these questions, one must be able to distinguish between old, gas-poor early-type galaxies and those undergoing morphological transformation via disk regrowth.
Kannappan, Guie, & Baker (2009, hereafter KGB) recently identified a population of E/S0s that reside alongside spiral galaxies on the blue sequence in color vs. stellar mass parameter space. They argue that among these “blue-sequence E/S0s,” a subset with low-to-intermediate masses may represent the missing link — i.e., galaxies that are actively (re)growing stellar disks and plausibly transitioning from early to late type. KGB find that these blue-sequence E/S0s fall between spirals and red-sequence E/S0s in scaling relations (stellar mass vs. radius and vs. velocity dispersion ), implying that blue-sequence E/S0s might form a transitional population between the two groups. Compared to conventional red-sequence E/S0s, blue-sequence E/S0s consistently have bluer outer disks, and often bluer centers as well — suggesting on-going star formation in both disks and disky bulges. Further supporting this disk-building picture, KGB find evidence for kinematically distinct disks (i.e., counterrotating or polar) in a notable sub-population of blue-sequence E/S0s.
Unlike red-sequence E/S0s, whose mass function peaks at high masses, blue-sequence E/S0s are rare for 1–2, and are common only for (KGB). Their abundance increase sharply to 20–30% below , coincident with the mass threshold below which galaxies become notably more gas rich (Kannappan & Wei 2008, based on Kannappan 2004). At intermediate masses between and , KGB find that blue-sequence E/S0s include examples of both major mergers that are likely to fade onto the red sequence after exhausting their gas, and also settled galaxies that may be evolving toward later-type morphologies. The former dominate at higher masses, and the latter at lower masses.
One outstanding question that remains is the extent of disk growth possible in low-to-intermediate mass blue-sequence E/S0s. In this paper, we approach this question from the point of view of atomic gas reservoirs. KGB addressed this question with limited archival data for the Nearby Field Galaxy Survey (NFGS, Jansen et al. 2000a), finding preliminary evidence for gas reservoirs comparable to spiral galaxies. In this paper we present more complete, higher-quality data for all NFGS E/S0s with and a sampling of more massive E/S0s. We compare the atomic gas masses (normalized to ) of blue-sequence E/S0s with those of other galaxies, and we examine the possible fractional growth in given current rates of star formation. The question of how efficiently the atomic gas might flow inward and condense into molecular gas is beyond the scope of this paper; however, we discuss preliminary evidence from our own and others’ work that suggests efficient conversion is plausible (elaborated in a forthcoming paper: Kannappan et al. 2009, hereafter K09b).
Section 2 describes our statistically representative sample of red- and blue-sequence E/S0s from the NFGS, and presents new Green Bank Telescope111The National Radio Astronomy Observatory is a facility of the National Science Foundation operated under cooperative agreement by Associated Universities, Inc. (GBT) data for the galaxies with , which are expected to show the most disk growth (KGB). We also present a tabulation of HI data for the full NFGS. Section 3 compares atomic gas masses of blue-sequence E/S0s with those of red-sequence E/S0s and galaxies of later-type morphology within the NFGS. We also compare to the sample of Sage & Welch (2006). Section 4 examines the fractional stellar mass growth possible for blue-sequence E/S0s given the current star formation rate, in two limiting scenarios — constant (i.e., allowing gas infall) and exponentially declining (i.e., closed box) star formation. In Section 5, we discuss gas exhaustion and gas inflow timescales, and we examine evidence for bursty star formation in blue-sequence E/S0s, which likely implies efficient conversion of HI to . We conclude with a discussion of the evolutionary fates of blue-sequence E/S0s.
Appendix A details features of our new HI data for interesting individual galaxies. In this paper, we assume = 70 .
2. Sample and Data
2.1. Sample
2.1.1 NFGS Sample and Data
To understand the role of blue-sequence E/S0s in the morphological evolution of galaxies, we need to examine these galaxies alongside different types of galaxies in various stages of evolution. The NFGS provides an ideal parent sample for such study, spanning the natural diversity of galaxies in the local universe in terms of mass, luminosity, and morphological type. Jansen et al. (2000a) selected the NFGS galaxies from the CfA redshift catalog, which they binned by absolute magnitude and sub-binned by morphological type. After applying a luminosity-dependent minimum redshift to avoid galaxies of a large angular size, Jansen et al. (2000a) chose every Nth galaxy from each bin, scaling N to approximate the local galaxy luminosity function. The resulting NFGS spans the full range of morphological types and eight magnitudes in luminosity, providing a distribution of galaxies that is statistically consistent with that of the local universe.
Archival NFGS data include photometry (Jansen et al., 2000b), integrated spectrophotometry (Jansen et al., 2000a), and ionized gas and stellar kinematic data (Kannappan & Fabricant, 2001; Kannappan et al., 2002). All NFGS galaxies also have photometry from 2MASS (Skrutskie et al., 2006).
Stellar masses are estimated by fitting stellar population models to photometry and integrated spectrophotometry as described in KGB (updating Kannappan & Gawiser 2007; see also Kannappan & Wei 2008). This limits the “full NFGS sample” to 176 galaxies for which stellar masses are available. For consistency with the red/blue sequence dividing line of KGB, we use colors with those authors’ extinction corrections and -corrections. Total magnitudes are also extinction corrected. We also use star formation rates calculated by KGB from extinction-corrected H spectral line data, integrated by scanning the slit across each galaxy and calibrated against IRAS-based star formation rates (SFRs) following Kewley et al. (2002)222The Kewley et al. (2002) SFRs were scaled to the same IMF used in the stellar mass estimation by KGB..
2.1.2 Sub- E/S0 Sample
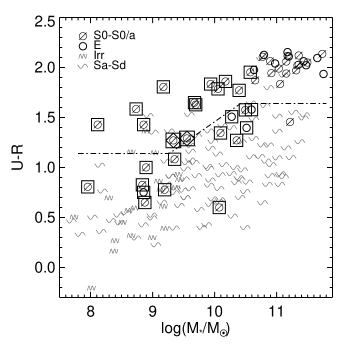
We consider a subsample of NFGS E/S0 galaxies for detailed study of the regime where KGB report abundant blue-sequence E/S0s. Our focus sample includes all 14 blue-sequence E/S0s with , with the limit chosen where the blue-sequence E/S0s tail off (Figure 1). To make a fair comparison, we include all 11 NFGS red-sequence E/S0s with . We also include two galaxies that lie on the dividing line between the red and blue sequences, which we will refer to as “mid-sequence” E/S0s following the naming convention of KGB. Our cutoff mass is very close to the bimodality mass () discussed in KGB, so henceforth we refer to this sample as the “sub-” E/S0s.
The sample mass limit excludes a large population of high-mass red-sequence E/S0s; this is appropriate because many properties scale with stellar mass, and including the high-mass galaxies would bias statistical comparison. Figure 1 shows the sub- sample in color vs. stellar mass parameter space, illustrating similar mass distributions with good coverage of both the red and blue sequences. KGB divide the two sequences with the dashed line in Figure 1, which is chosen with respect to the locus that hugs the upper boundary of the distribution of most late-type galaxies. The line levels out at values of 1.14 and 1.64, in agreement with Baldry et al. (2004). The rest of the NFGS (spirals and irregulars) is plotted in the background in the same figure for comparison. Because the full NFGS was selected to be broadly representative of the local universe, we expect our sub- E/S0 sample to encompass a wide range of evolutionary stages as well.
2.2. HI Data
We present the compilation of HI data for the full NFGS in Table 1.
2.2.1 HyperLeda and Literature
HI fluxes are available for most of the NFGS from the HyperLeda database (Paturel et al., 2003), which consists of data compiled from the literature. Because the HyperLeda database is compiled from observations made at different telescopes by different observers, Paturel et al. homogenize the HI data to account for differences in observational parameters such as beamsize, spectral resolution, and flux scale.
For NFGS galaxies lacking HI data in HyperLeda, we gather data from the literature when possible. We obtain upper limits for three galaxies from Huchtmeier & Richter (1989), four HI fluxes and one upper limit from the Cornell EGG HI Digital Archive (Springob et al., 2005), and six upper limits and one flux measurement from the HI Parkes All Sky Survey (HIPASS, Barnes et al. 2001). Because these measurements are often upper limits or taken at telescopes not included in the homogenization effort of Paturel et al. (2003), the fluxes for these galaxies are not homogenized to the HyperLeda dataset.
2.2.2 New GBT HI Observations
Good quality literature data are lacking for many early-type galaxies in the NFGS, so we have obtained GBT HI observations for many of these galaxies, with priority for our sample of sub- E/S0s. The observations were obtained with the GBT Spectrometer in L-band, with 50 MHz bandwidth, one spectral window, and nine sampling levels, in ten minute on-off source pairs (five minutes per position) during March and October of 2007. The total on-source time for each galaxy was determined during the observing runs based on the strength of the HI emission relative to the noise.
The spectra were reduced using GBTIDL (Marganian et al., 2006). Individual 30 second records with large harmonic radio frequency interference (RFI) were flagged, and persistent RFI spikes near the velocity range of the galaxy were interpolated across in a few cases. The scans were accumulated and averaged for all data for an individual galaxy, and a polynomial of order 5 was fitted over a range of 20 MHz to subtract the baseline. Hanning and fourth order boxcar smoothing, with decimation, were then applied to all the baseline-subtracted data, resulting in channel resolution of 0.0244 MHz (5 ). Flux calibration is derived from simultaneous observations of an internal noise diode whose intensity is stable.
Figures 2 and 3 present the spectra of red-, blue-, and mid-sequence E/S0s obtained with the GBT, and Table 2 lists the observational parameters and measured quantities. Col. (6) lists the total on-source time in seconds; Col. (7) is the heliocentric recession velocity measured at the mid-point of 20% flux after excluding companions (, see §2.2.3). Cols. (8) and (9) are the HI line widths measured at the 20% and 50% level (). Col. (10) gives the velocity-integrated flux and error (), both in Jy , and Col. (11) gives the dispersion of the baseline channels measured in a line-free part of the spectrum () in mJy.
We estimate the error of our flux measurements following Schneider et al. (1986, 1990), who derived the following analytical expression for uncertainty in total HI flux ():
| (1) |
where is the rms dispersion of the baseline in Jy and is the velocity resolution of the spectrum in . The errors in the measured heliocentric velocity () and velocity widths () are estimated following Fouque et al. (1990), using:
| (2) |
| (3) |
| (4) |
where is the steepness of the profile, , and S/N is the ratio of the peak signal to .
We cannot homogenize our HI fluxes to the HyperLeda system of Paturel et al. (2003), because these authors do not include the GBT in their homogenization calculations. However, because of the large beam of the GBT at 21cm (9) compared to the small optical sizes of our galaxies (2), no beam-filling correction is needed. Also, flux calibration of GBT HI spectral line data is extremely stable and accurate, so large offsets in the flux scale between our GBT data and the HyperLeda data are unlikely. In fact, comparison between our new GBT HI data and existing HI data from HyperLeda for 11 galaxies show that over half have GBT fluxes within 20% of published HI fluxes, even though the HyperLeda data are of poorer quality. In all 11 cases the S/N of the GBT HI data is better than that of the published data. We discuss the HI fluxes and line profiles of individual galaxies in further detail in Appendix A.
2.2.3 Companions
We check for companions to our GBT galaxies by setting the search radius in the NASA/IPAC Extragalactic Database (NED) to match the beam of the GBT. For galaxies with known or obvious companions, we measure the HI flux twice: the first time we measure the flux within the velocity range from ionized-gas rotation curves (or stellar rotation curves, if ionized gas is not available), and the second time we include all flux in the beam within a reasonable velocity range near the galaxy (). We mark the ionized-gas/stellar velocity range used to measure fluxes for the first method in Figures 2 and 3 with double vertical lines. We present both measurements in Table 2: the first row contains values measured in the ionized-gas/stellar velocity range, while the second row includes companion flux (if any) within 300 .
The first method most likely underestimates HI content for the two galaxies (IC 1639, IC 195) for which we must determine the velocity range from stellar rotation curves, as those rotation curves are still rising at the last measured point. The ionized-gas rotation curves used for the other galaxies, on the other hand, are flat, so the underestimation of HI flux for those galaxies should be small. The second method likely overestimates a galaxy’s HI reservoir, since cold gas from a companion may not be readily accessible for star formation in the target galaxy. We use fluxes measured with only the first method in our analysis, as conservative estimates of HI gas mass. We discuss how our results may change if we include companion gas in §5.1.2.
2.2.4 Kinematics
We estimate the observed maximum rotation speed, for each galaxy following Paturel et al. (2003):
| (5) |


.
where and are specified for a given velocity width measured at % level and velocity resolution , enabling galaxies from disparate HI datasets to be compared. For our GBT data, we adopt the recommended values of and to convert our widths into (Table 1, Col. (7)).
We find the difference between heliocentric measurements of the HI velocity and the optical velocity for NFGS galaxies to be small, centered around 0 , with a standard deviation of 33 .
2.2.5 Atomic Gas Masses
Of the 200 galaxies in the NFGS, we have HI information for 170: new GBT observations for 27 galaxies, HyperLeda HI data for 128 galaxies, and other literature data for 15 galaxies. The 30 galaxies with no HI information are distributed reasonably evenly between morphological types (53% early, 40% late, and 7% Pec/Im) as well as sequences (43% blue, 43% red, and 14% unknown because no stellar mass estimate is available). We plot color as a function of -band luminosity in Figure 4 to show the distribution of the NFGS sample with HI information. There is a somewhat higher frequency of missing data among the brightest galaxies (also the most distant, Jansen et al. 2000a).
The HI gas masses given in Col. (9) of Table 1 are calculated from following Haynes & Giovanelli (1984):
| (6) |
where is the Local Group and Virgocentric flow corrected recessional velocity from Jansen et al. (2000a), which we use to be consistent with the stellar mass estimates. We multiply the HI gas mass by a factor of 1.4 to account for the presence of helium.

2.2.6 Upper Limits to HI Masses
To calculate upper limits, we measure the rms dispersion of the baseline, , in a signal-free part of the spectrum within the velocity range from ionized-gas (or stellar) rotation curves. We then estimate following:
| (7) |
where N is the number of channels in the velocity range we measured from, and is the width of each channel in units of . We estimate the HI mass upper limit using 3 as the HI flux and following Equation 6.
3. Gas Reservoirs
3.1. Comparison of Gas Reservoirs in NFGS Galaxies
All of our sub- blue-sequence E/S0s, as well as both mid-sequence E/S0s, are detected in HI and have atomic gas masses () ranging from to almost . In contrast, four of our eleven sub- red-sequence E/S0s were not detected, although we integrated down to upper limits of –. The remaining seven galaxies have atomic gas masses ranging from –.
We plot the distribution of atomic gas mass as a function of stellar mass for the sub- blue- and red-sequence E/S0s, mid-sequence E/S0s, and other NFGS galaxies in Figure 5. We find that, at a given , blue-sequence E/S0s tend to have larger gas masses than red-sequence E/S0s. This result confirms the preliminary results of KGB, for HI data that are much more complete in terms of sampling sub- E/S0s. Since almost half of the red-sequence E/S0s are actually upper limits, the separation between the gas masses of blue- and red-sequence E/S0s is actually larger than it appears in Figure 5.
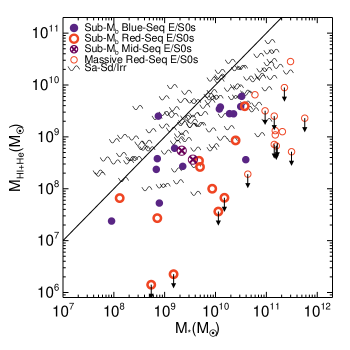
Even more intriguing is the location of blue-sequence E/S0s in between spiral/irregular galaxies and red-sequence E/S0s in the vs. relation shown in Figure 5. In fact, there is considerable overlap between blue-sequence E/S0s and spiral/irregular galaxies. This supports the KGB suggestion that blue-sequence E/S0s form a transitional class between spirals/irregular galaxies and traditional red-sequence E/S0s, as originally inferred from the fact that blue-sequence E/S0s also lie between spiral/irregular galaxies and red-sequence E/S0s in the -radius and - relations.
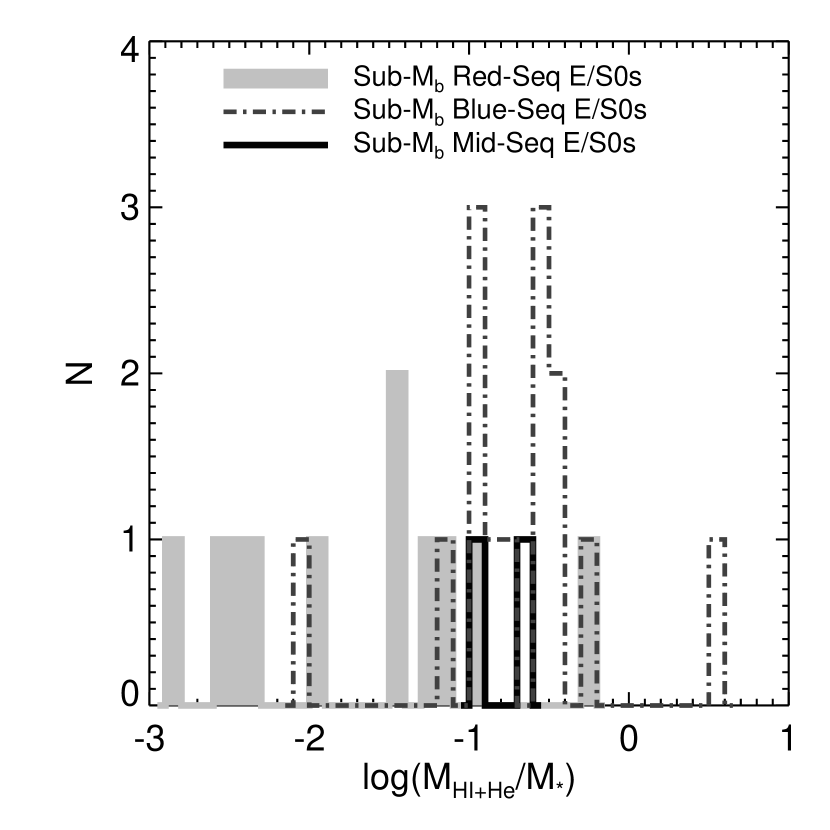
Since we are interested in the potential for morphological transformation in blue-sequence E/S0s, it is informative to consider — the mass of the atomic gas relative to the current stellar mass of a galaxy. We plot the distribution of atomic gas-to-stellar mass ratios for sub- E/S0s on both sequences in Figure 6a and list their values in Table 3. A Kolmogorov-Smirnov test on the distributions of for sub- red- and blue-sequence E/S0s rejects at the 99% level the possibility that these galaxies derive from the same parent population.
While most of the sub- blue-sequence E/S0s and both the mid-sequence E/S0s have in the range of 0.1 to 1.0, all but two of the sub- red-sequence E/S0s have . Following Binney & Merrifield (1998) Figure 4.51, the formation of new stars in an extended disk constituting 25% of original total stellar mass will change the typical S0 galaxy to an Sa galaxy. This suggests that at least half of the sub- blue-sequence E/S0s do have large enough gas reservoirs for major morphological transformation if all the gas is converted into stars in the disk. We discuss in later sections whether the gas is actually forming stars. But for now, we can say that at least half of our sub- blue-sequence E/S0s do have the potential to transform their morphologies simply based on their atomic gas masses. In contrast, sub- red-sequence E/S0s lack sufficient atomic gas to do the same with rare exceptions.
3.1.1 Interesting Outliers
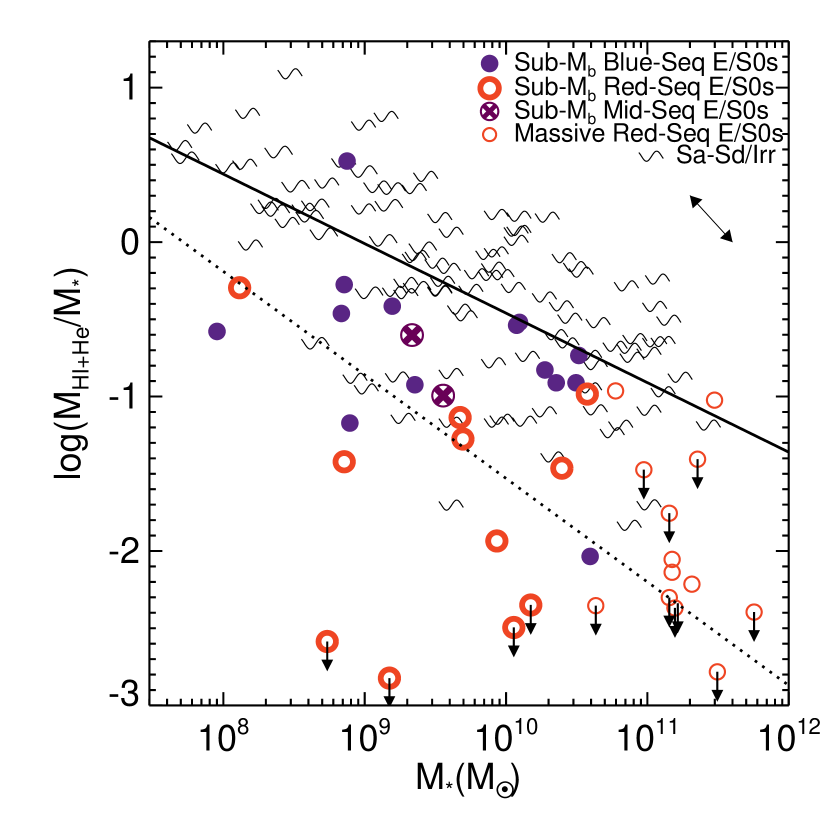
Figure 6a shows that while sub- red-sequence E/S0s tend to have lower values of , sub- blue-sequence E/S0s tend to have higher values. There are, however, a couple of outliers that do not seem to follow this trend. The most prominent of the outliers are the red-sequence E/S0 with a large gas reservoir, UGC 5923 (log ), and the blue-sequence E/S0 with a very small gas reservoir, IC 1639 (log ). Taking the stellar masses of these galaxies into consideration, however, provides plausible explanations for their gas-to-stellar mass ratios.
UGC 5923, the gas-rich red-sequence E/S0, has the lowest stellar mass of all red-sequence E/S0s in the NFGS with , so it is not surprising that this galaxy has a fractionally large gas reservoir, despite its red color. emission indicates that there is some low-level star formation in UGC 5923, but not enough to push the galaxy towards the blue sequence. This galaxy does, however, appear dusty and has the highest internal extinction of all sub- red-sequence E/S0s, which suggests that it could also be forming stars now behind an obscuring dust screen. But for dust, this object might well follow the trend of the blue-sequence E/S0s in Figure 6.
IC 1639, the gas-poor blue-sequence E/S0, is on the other end of the stellar mass scale as the galaxy with the largest stellar mass in the sub- E/S0 sample (). KGB argue that blue-sequence E/S0s at these higher stellar masses are more often associated with violent encounters than disk building. It is possible that this galaxy underwent an interaction with its larger companion in the not-so-distant past, which triggered a burst of star formation (hence its blue color) and quickly exhausted its gas reservoir.
3.1.2 as a Function of Stellar Mass
The outliers described in the previous section indicate the importance of taking stellar mass into account when considering the gas-to-stellar mass ratio. Hence we plot as a function of (Figure 6b) for all galaxies in the NFGS.
We fit the trend of decreasing atomic gas-to-stellar mass ratio with increasing stellar mass in Figure 6b with a line in the form of for all NFGS galaxies with HI data, using survival analysis (the ASURV package: Lavalley et al. 1992) to include galaxies with upper limits. Table 4 lists the coefficients for the different fits (forward, bisector) for different populations (Blue Sequence, Red Sequence, Spiral/Irregulars, and E/S0s).
As mentioned earlier, most of the sub- blue-sequence E/S0s have in the range of 0.1 to 1.0, while all but two of the sub- red-sequence E/S0s have . The separation between the two populations is even more striking in Figure 6b, and re-emphasizes the difference in potential for morphological transformation between sub- blue- and red-sequence E/S0s.
3.2. Comparison with Sage & Welch E/S0 Sample
We compare the masses of gas reservoirs in our sample of sub- E/S0s with an ongoing survey of cold gas (HI and CO) in a volume-limited sample of nearby E/S0s by Sage & Welch (2006) and Sage et al. (2007). Sage & Welch (2006) report that E/S0s contain less than 10% of the cold gas mass () predicted for gas return by analytical stellar evolution models (Ciotti et al., 1991). In particular, Ciotti et al. (1991) predict that in solar units, while Sage & Welch (2006) conclude that for S0s and suggest that this also applies to ellipticals based on preliminary data (Sage et al., 2007).
We plot vs. in Figure 7, showing as a dashed line. We divide by rather than to facilitate comparison with Sage & Welch (2006); although the larger scatter compared to Figure 6b suggests that does not work as well as , is not available for the E/S0s from Sage & Welch (2006) and Sage et al. (2007).
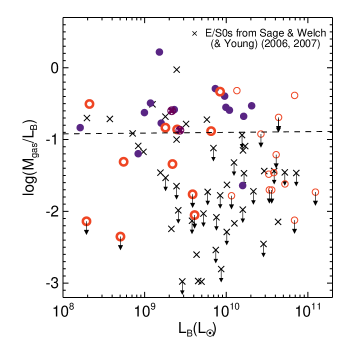
While there are a few E/S0 galaxies from Sage & Welch (2006) and Sage et al. (2007) with values of 0.1, the majority of their E/S0s have much smaller values of . In contrast, all but two of our sub- blue-sequence E/S0s fall above the 0.1 cutoff, as do both of the mid-sequence and a few red-sequence E/S0s. Note that our data points do not include molecular gas as opposed to the Sage & Welch (2006) data points, so the values of for our galaxies reflect only the neutral atomic ISM, and the actual values could be even higher. This result suggests that the sub- blue-sequence E/S0s in our sample have some of the most massive fractional gas reservoirs among early-type galaxies, in comparison to red-sequence E/S0s in our sample as well as E/S0s from the literature.
The differences in how galaxies in the two samples are selected may explain the disparity in between them. The Sage & Welch (2006) sample, selected from the Nearby Galaxies Catalog, inherits the parent sample’s biases against optically small galaxies (diameter –) and HI-poor systems (Welch & Sage, 2003). Hence, it is likely that the Sage & Welch (2006) E/S0s are more massive and therefore more likely to be on the red sequence than our sample of E/S0s. The distribution of for the two different samples in Figure 7 hints at this, with our sample of sub- E/S0s predominantly at lower and the Sage & Welch (2006) sample dominating at higher values. Note that the of blue-sequence E/S0s in our sub- sample may be systematically enhanced by star formation, decreasing , so the difference in between our sub- E/S0s and the Sage & Welch (2006) galaxies may be even larger.
Although our sub- blue-sequence E/S0s have larger gas mass reservoirs than seen by Sage & Welch, we still find much smaller reservoirs than that predicted for gas return by the analytical stellar evolution models discussed in Sage & Welch (2006), ranging from 10% to 30% of the predicted value. Our findings support Sage & Welch’s conclusion that stellar mass loss is not the primary source of HI in E/S0s.
4. Star Formation and Stellar Mass Growth
Now that we have established that sub- blue-sequence E/S0s typically have substantial fractional atomic gas reservoirs and therefore potential for morphological transformation, we consider the question of whether this gas is being converted into stars at a rate that can lead to morphological transformation in a reasonable amount of time. Although we lack information about the spatial distribution of the atomic gas, we can make some simplifying assumptions and create limiting scenarios for the evolutionary trajectory of blue-sequence E/S0s given the current rate of star formation.
4.1. Two Limiting Scenarios for Growth in the Stellar Component
To construct truly realistic scenarios for the evolutionary path of our galaxies, we would have to account for all sinks and sources of gas. The sink terms are the rates at which gas is converted into stars and ionized and/or expelled due to stellar winds and supernovae. The source terms include the rate at which fresh gas is brought in from external sources (minor mergers, interactions, etc.) and at which gas is returned by stellar evolution. A detailed accounting of all these processes, however, is beyond the scope of this paper. While there are many theoretical studies of the hierarchical assembly of galaxies (many of which include estimates of the frequency of mergers), simulations still lack the resolution to predict the frequency of very minor mergers and interactions. We discuss current simulations in more detail in §5.1.2.
We consider here the range of plausible evolutionary trajectories for our blue-sequence E/S0s by presenting two simplified, but limiting, scenarios. We should note that we assume that the atomic gas is distributed in such a way that it can be made available for star formation (e.g., via conversion to molecular gas) at a rate comparable to the current star formation rate. This may not always be the case, but we argue that this is a plausible assumption in §5.1.2 and §5.2.
In the first scenario, we assume that the current star formation rate remains constant over time, which is an assumption many population synthesis models make. Preserving a constant star formation rate requires an increasing star formation efficiency for a closed box, or open-box inflows. This scenario provides a reasonable upper limit on the possible growth in stellar mass per unit time and a lower limit on the amount of time it takes for that mass to form.
The second scenario represents the other limit: an exponentially declining star formation rate (i.e., closed box with no gas return). For each galaxy, we start out with the current cold gas reservoir () and star formation rate (). As time progresses, the star formation rate declines exponentially following as gas is converted into stars, where (e.g., Li et al. 2006). This scenario defines the lower limit on the amount of gas converted to stars within a fixed time, as the star formation rate is declining exponentially.
Because we lack information regarding the frequency of internal/external gas replenishment, these two scenarios (exponentially declining SFR with no new gas, and constant SFR allowing gas infall) represent simplified limits which likely bracket the actual amount of growth in the stellar component in these galaxies.
4.2. Estimates of Stellar Mass Growth Over Time
Given the two limiting scenarios described in the previous section, how much growth in stellar mass is possible for the different galaxies? We plot the ratio of new stellar mass formed relative to the current stellar mass as a function of current stellar mass 1, 2, 3, and 4 Gyr in the future in Figures 8a–d, respectively. Here we note that 11 E/S0s from the sub- sample (two on the blue sequence and nine on the red sequence) do not appear in Figure 8. These galaxies have spectra that are integrated over the galaxy, but no H emission was detected, so these galaxies do not appear in any of the figures using star formation rates. Future work with GALEX and Spitzer data will provide better estimates of the star formation rates in these galaxies.
For each galaxy, a vertical line in Figure 8 represents the range of possible fractional increase in stellar mass, with the lower end representing the exponentially declining SFR scenario and the upper end representing the constant SFR scenario. We mark the vertical line with a horizontal dash to note the stellar mass fraction at which the original gas reservoir runs out. Any growth in the stellar component indicated by the line above the horizontal dash requires inflow of gas, which we allow in the constant star formation scenario. Galaxies that have not converted all of the original gas mass in the constant star formation rate scenario after the time specified for each figure do not have a horizontal dash. Since these two scenarios are the limiting cases, it is likely that the actual amount of stellar mass growth is somewhere in between the two ends of the line.
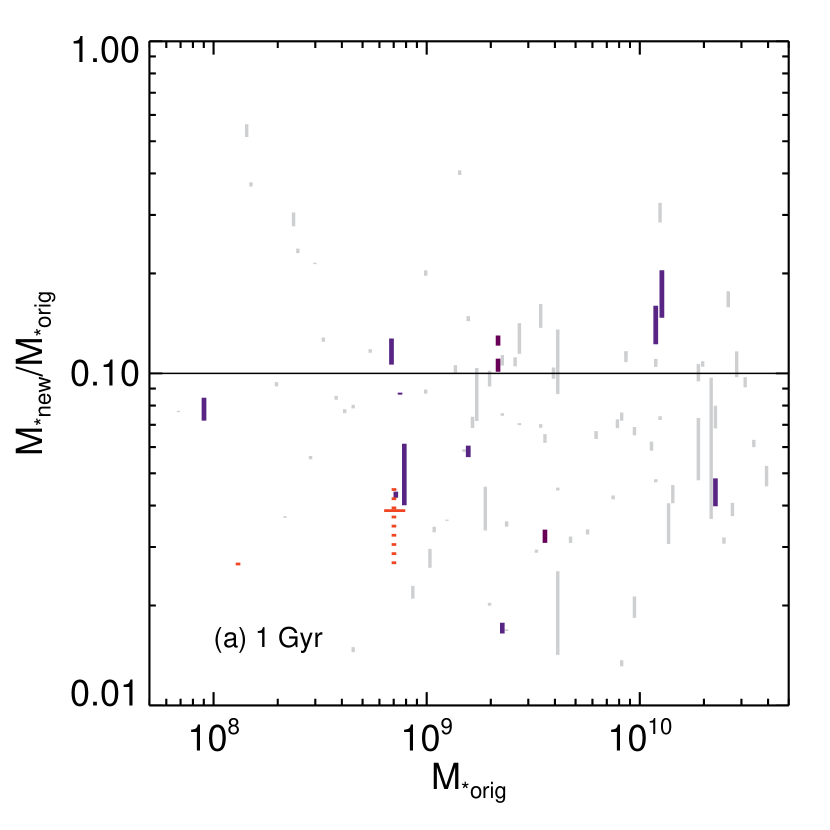
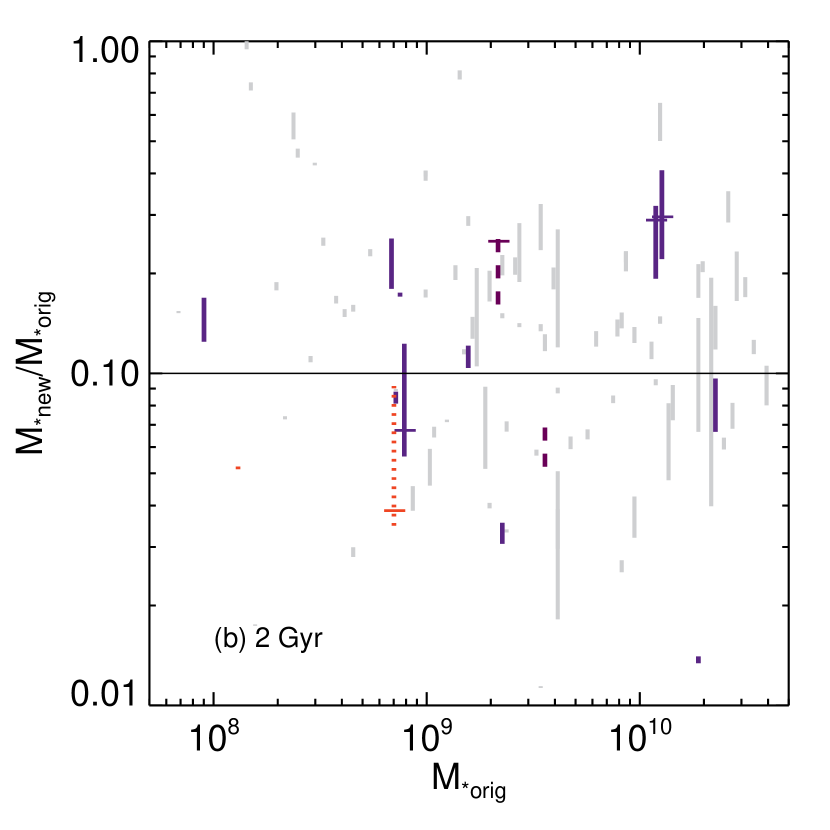
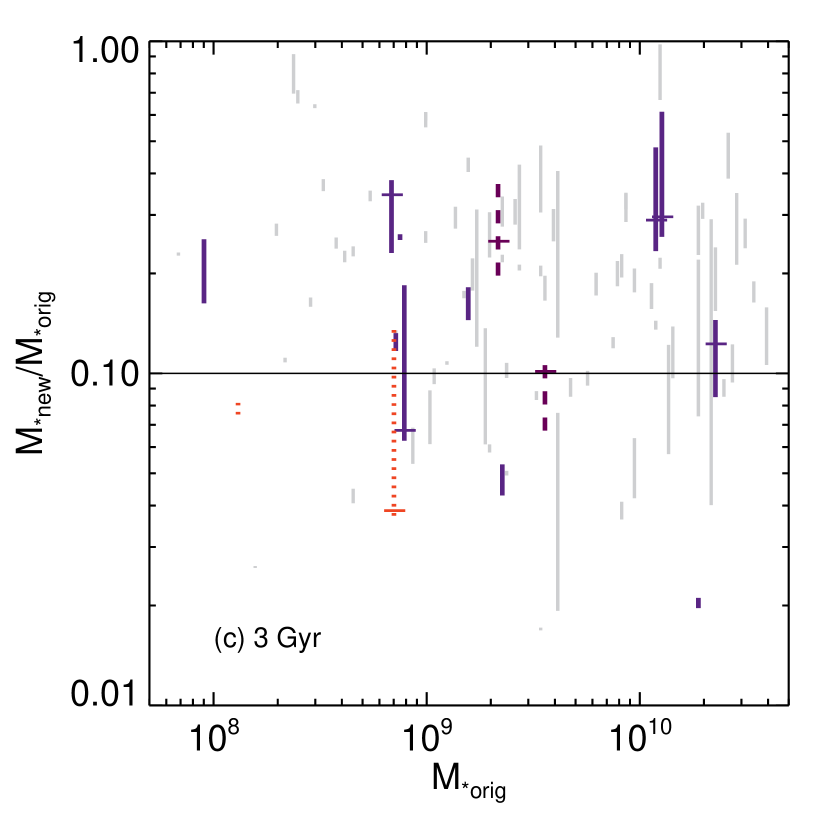
Figure 8b shows that many of the sub- blue-sequence E/S0s (dark solid lines) have the potential to increase their stellar masses by a large fraction in just 2 Gyr, with seven of the fourteen sub- blue-sequence E/S0s crossing or above the 10% line. In 3 Gyr, the time by which most sub- blue-sequence E/S0s have exhausted their gas reservoirs (5.1.1), nine of the fourteen sub- blue-sequence E/S0s will cross or be above the 10% line. The remaining five blue-sequence E/S0s have lower SFRs, so they are below the 10% line after 3 Gyr has passed. In fact, the SFRs for NGC 7360, IC 1639, and IC 195 are so low they do not form 0.1% of their current stellar masses within 3 or even 4 Gyr, so they do not appear on any of the panels in Figure 8. This large spread in the fractional stellar mass growth in blue-sequence E/S0s reflects the spread in star formation rates, which in turn may be indicative of differences in burst stages of the galaxies within this population. We discuss this in more depth in §5.2.
The two mid-sequence E/S0s in our sample also have potential for substantial morphological transformation. UGC 7020A () can form new stellar mass in the range of 20–40% of its current stellar mass within 3 Gyr, and UGC 6570 () can form new stellar mass 10% over the same period.
The low-mass red-sequence E/S0 with a surprisingly large gas mass reservoir discussed earlier, UGC 5923 (), has a relatively low star formation rate, but can still form new stellar mass 10% of its current stellar mass within 3 Gyr. NGC 5338 () has a very small gas reservoir but might form significant stellar mass if there is replenishment of gas. The rest of the sub- red-sequence E/S0s have such low SFRs that they are below the 1% line (i.e., off the plot) in all four panels of Figure 8.
We plot the same lines of fractional stellar mass growth for spiral and irregular galaxies with in grey in Figures 8a–d for comparison. For sub- blue-sequence E/S0s, the ratio of new stellar mass formed in 1–3 Gyr to original stellar mass is comparable to that of the spiral/irregular distribution (Figure 8a–c). This suggests that, as a population, sub- blue-sequence E/S0s have potential for growth in the stellar component similar to that of spiral/irregular galaxies in the near term future (1–3 Gyr). The horizontal dashes marking where the original gas reservoirs runs out, however, suggest that the inflow of fresh gas is important to the long-term evolution of our galaxies (Figure 8c, d).
5. Availability of Gas for Star Formation
5.1. Timescale for Gas Exhaustion and Inflow
Without maps of the distribution of HI, we cannot say for certain that the atomic gas is distributed in such a fashion that it is readily available for star formation. In §5.1.1 and §5.1.2 below, we argue that regardless of the distribution of the atomic gas (extra-planar, in the disk, or in companions), the timescale for inward travel of gas is most likely shorter than the duration of star formation in blue-sequence E/S0s. This suggests that assuming that the atomic gas reservoir is readily available for star formation is reasonable given internal or external mechanisms to drive gas inflow. In §5.2 we will discuss evidence for frequent, externally driven inflow in the sub- blue-sequence E/S0 population.
5.1.1 Gas Exhaustion Time
The timescale that can be directly estimated from the atomic gas mass and star formation rate of a galaxy is the gas exhaustion time () — the amount of time it would take to convert all the gas into stars, assuming the current star formation rate remains constant. This is the same as the one used in the exponentially declining star formation rate calculation for the second scenario in §4.1, although by definition the gas reservoir will never be exhausted in this scenario since the SFR decreases exponentially in parallel with decreasing gas mass. Most of the gas mass, however, will be converted into stellar mass within the timescale , so this is an interesting timescale to consider for both scenarios.
Table 5 lists the gas exhaustion times for galaxies in the sub- E/S0 sample that have star formation rates. The large spread in gas exhaustion times may be reflective of the diversity of evolutionary states within the blue-sequence E/S0 population, which we explore further in §5.2. Note that the range of gas exhaustion timescales we find includes shorter timescales than found by KGB because of preferential incompleteness at low HI masses in the archival data used by KGB.
For a more informative picture, we plot the fraction of sub- galaxies that will not have exhausted their original atomic gas reservoirs at a given future time in Figure 9. We include the mid-sequence E/S0s with the blue-sequence E/S0s in this figure as they seem to behave similarly. While the fraction of star-forming spiral/irregular galaxies seems to have a gradual, smooth decline in this figure, the blue-sequence E/S0s have a sharp drop-off at 3 Gyr. In agreement with Figure 8a–d, Figure 9 suggests that sub- spiral/irregular galaxies typically continue forming new stars long after star formation in sub- blue-sequence E/S0s is extinguished by the exhaustion of the original gas reservoir.
There is no drop-off for the sub- red-sequence E/S0s, as we have SFRs for only two of the eleven galaxies. The fact that most of the sub- red-sequence E/S0s have extremely low star formation rates, however, supports the conclusion that the near-term evolutionary trajectories of blue- and red-sequence E/S0s will be quite different.
5.1.2 Inward Travel of Gas
In §3 and §4, we have demonstrated that blue-sequence E/S0s have substantial fractional atomic gas reservoirs that, if readily available for star formation, can translate into significant growth in stellar mass and consequent morphological transformation. The key uncertainty is whether this gas is or can be made available for star formation on a reasonable timescale compared to the gas exhaustion timescale just discussed.
The GBT spectra, at 21 cm, have a resolution of only 9, which (for our sample) translates to an uncertainty radius of 10–110 kpc in the location of atomic gas, depending on the distance to the galaxy. Without maps with sufficient angular resolution (e.g., VLA HI maps), we do not know whether the cold atomic gas is accessible for conversion into for star formation or not. Broadly, there are three possible distributions for the HI gas: on a trajectory falling into the galaxy, in an HI disk that is a part of the galaxy (the most plausible configuration), or in companions.
Infalling Gas: If the gas is somewhere outside the galaxy on its way inward, we expect it to travel inwards to the galaxy on a dynamical timescale. The 9 GBT beam at 1.4 GHz corresponds to radii of 10–110 kpc from the centers of galaxies in the sub- E/S0 sample, with a median of 34 kpc. We list the dynamical timescale for inward travel of gas from the edge of the beam for each galaxy in the sub- sample in Col. (5) of Table 5. The dynamical timescale estimates for inward travel of gas range from 0.4 to 2.5 Gyr, with a median of 1.1 Gyr. These timescale estimates are smaller than the gas exhaustion times for all but two of the galaxies. These two galaxies happen to be the most distant of all sub- E/S0s in Table 5, so the edge of the GBT beam corresponds to 100 kpc. Therefore it is not surprising that these galaxies have long timescales for infall from the edge of the beam that are greater than the gas exhaustion time.
Assuming that the gas is at the edge of the beam is the most extreme case; it is much more likely that the gas is much closer to the galaxy, which would reduce the infall time as . For example, the dynamical time for inflow of gas from the predicted HI radius (2–17 kpc, scaling from the blue optical radius using an assumed ratio of 2.11; Noordermeer et al. 2005) is much shorter than the gas exhaustion time in all cases, ranging from 50–400 Myr, with a median of 150 Myr (Table 5, Col. (4)). Fraternali & Binney (2008) find evidence for the infall of extra-planar gas onto star-forming spiral galaxies on short timescales — at rates comparable to their star formation rates (few ), which supports our estimates above.
The dynamical timescales we estimate here are for inward travel of gas all the way to the center of the galaxy. However, the gas is capable of forming stars far from the centers of galaxies, depending on parameters such as local surface density and mid-plane pressure (e.g., Blitz & Rosolowsky 2004; Leroy et al. 2008). Thus the distance infalling gas has to travel to reach star forming regions and the corresponding infall timescale may be even shorter than our estimates above.
Disk Gas: Comparison between ionized-gas rotation curves and the new GBT HI profiles suggests that most of the atomic gas is likely distributed in rotating disks for all the GBT galaxies. We identify four particularly interesting cases. The ionized gas data show marginal or no rotation for UGC 6805, UGC 7020A, and UGC 6003, but their HI profiles have the appropriate widths for rotation given their stellar masses (e.g., based on the -rotation velocity relation in KGB). There is no ionized gas detection at all for NGC 3522, so the HI profile for this galaxy indicates the presence of a previously unknown gas disk.
If the gas is in a stable orbit in the disk of a galaxy, it will not necessarily travel inwards towards star forming regions on a short timescale compared to the gas exhaustion time. Depending on the density of the gas, the gas disk may or may not collapse to form stars. A dense disk of gas could dovetail nicely with either of our star formation scenarios above — it will collapse and form a stellar disk at the rate of the global SFR. If, however, the HI disk is too diffuse and spread out in an extended disk, the gas will continue in circular orbit in a dormant fashion unless it is perturbed by internal instabilities or events such as minor mergers or interactions.
Recent simulations find that the frequency of mergers increases as the ratio of masses between the progenitors () decreases (e.g., Stewart et al. 2008; Fakhouri & Ma 2008 and references therein). At the finest resolution currently available with the Millennium Simulation, Fakhouri & Ma (2008) find minor merger rates of 0.2 to 0.7 mergers per halo per Gyr at z = 0 for 1:30 to 1:100, respectively. These minor merger rates correspond to one merger every 5 Gyr on the high mass end (1:30) and one per 1.4 Gyr on the low mass end (1:100). The minor merger rate at the high mass end (1:30) is perhaps a bit long relative to the gas exhaustion times for our galaxies, but minor mergers with progenitor mass ratios down to 1:100 and even smaller may still be capable of inducing gas inflow and star formation. Due to the lack of resolution, however, Fakhouri & Ma (2008) do not consider progenitor mass ratios smaller than 1:100, where mergers are extrapolated to occur on timescales shorter than 1 Gyr.
There is also observational evidence suggesting that tidal interactions with small companions occur relatively frequently in field galaxies, bringing fresh infall of gas. At least 25% of field galaxies observed in HI in several surveys show asymmetric features, indicating that they have recently undergone or are undergoing tidal interactions (Sancisi, 1992; Verheijen & Sancisi, 2001; van der Hulst et al., 2001). Moreover, if one takes lopsided structure (azimuthal distortions in the stellar disk) and kinematics as evidence of interaction, the fraction would increase to above 50% of field galaxies (Zaritsky & Rix, 1997).
The frequency of minor mergers, taking into account recent studies of how gaseous disks could survive mergers and interactions (Hopkins et al., 2009; Stewart et al., 2009), suggests that if some of the galaxies in our sub- E/S0 sample have large, diffuse, and extended HI disks, they may not lie dormant for too long before a minor merger or interaction induces the gas to flow inwards and triggers star formation. Once a minor merger or interaction occurs, we expect the gas to travel inwards on the order of a dynamical timescale or shorter (Barnes, 2001). As we discussed above, these are short timescales relative to the frequency of minor mergers in simulations, and so we take the merger rate as the limiting factor in this case, not the subsequent inward travel time.
Here we have considered only external mechanisms that could drive the disk gas inwards, but secular mechanisms that are internally driven (e.g., cloud-cloud collisions that provide an effective viscosity, bars that may be able to form independently of external perturbations, resonances, instabilities, etc.) likely also play a role in the inflow of disk gas. Because these mechanisms do not require external triggers, including the effects of internal mechanisms will shorten the gas inflow timescales we estimate from minor mergers/interactions alone.
Companion Gas: As described in §2.2.3, we adopt a conservative approach and limit the HI flux measurement to the velocity range indicated by the primary ionized-gas (or stellar) rotation curve for galaxies with known companions. Since we restrict the flux measurements, our fluxes are most likely underestimates.
Of the four sub- E/S0s with known companions in NED (UGC 12265N, IC 195, IC 1639, and NGC 4117), only UGC 12265N has a non-negligible SFR and appears in the plots in §4. The other three will increase their atomic gas-to-stellar mass ratios by factors of 1.6–3.7 if we include the companion gas (IC 195: 0.12 0.20, IC 1639: 0.01 0.03, NGC 4117: 0.05 0.12), but do not change the results of §3 significantly. Because these three galaxies have no detected star formation, the fractional stellar mass growth over time remains negligible.
Including the companion gas, the atomic gas-to-stellar mass ratio for UGC 12265N would quadruple from 0.3 to 1.2, giving it the second highest value of for sub- blue-sequence E/S0s. The amount of growth over time (Figure 8) would not change by much; the upper limit would remain the same, but the lower limit would increase since is larger with the extra gas. If the atomic gas is readily accessible for star formation, the gas exhaustion timescale would then increase from 1.4 Gyr to 5.6 Gyr.
Following Equation 4 of Lin & Tremaine (1983), we estimate the timescale for a merger via dynamical friction between UGC 12265N and its companion (UGC 12265S) 12 kpc away (neglecting the unknown line-of-sight distance) to be 70 Myr 333 . We assume that ln = 3.3, , and the companion is half as massive as UGC 12265N. If the companion is more massive than our assumption, the merger time would decrease by the same factor. If the companion is less massive and/or further away, the timescale for merger would increase as and .. This is shorter than its gas exhaustion timescale, which suggests that much of the companion gas is available for star formation in the near future and the amount of growth in the stellar component for this galaxy is greater than our conservative estimates in the previous sections.
Given the 1:2 progenitor mass ratio for this system, the resultant burst of star formation is likely to be more extreme than the scenarios discussed in §4.1, enhancing the star formation rate by a factor of two or more (e.g., Li et al. 2008; Darg et al. 2009). Whether the merger between UGC 12265N and its companion and the subsequent star formation will result in late-type morphology is unclear. A burst of central star formation may leave UGC 12265N with early-type morphology (e.g., Dasyra et al. 2006), but the gas-richness of this pair suggests that a disk-dominated remnant may be more likely (KGB; Hopkins et al. 2009; Stewart et al. 2009).
5.2. Evidence for Episodic Gas Inflow
In §5.1.2 above, we presented the possibility of minor mergers and/or interactions acting as a trigger which induces gas inflow and star formation. Here we examine observational evidence that inflow events, most likely triggered externally, are in fact occurring in blue-sequence E/S0s.
In addition to having bluer inner and outer disk colors than red-sequence E/S0s, half of the blue-sequence E/S0s in the NFGS have centers (within 50% light radii) that are bluer than their outer disks (50–75% light radii) (KGB). Figure 10 plots the distribution of a related quantity, , for sub- NFGS galaxies. is the color gradient of a galaxy “corrected” for the mean color difference of galaxies of the same (Kannappan et al., 2004), since larger galaxies may have central colors diluted by preexisting red bars or bulges. Figure 10 shows that all but one of the sub- blue-sequence E/S0s and both mid-sequence E/S0s are on the more blue-centered end of the distribution for spiral/irregular galaxies.
In the broader NFGS, larger values of reflect central star formation enhancements and correlate strongly with morphological peculiarities and the presence of nearby companions (Kannappan et al., 2004), suggesting a triggered gas inflow scenario. Kewley et al. (2006) also find evidence for gas inflows in interacting blue-centered galaxies based on radial trends in gas metallicity. These results are consistent with preliminary evidence for a relationship between and molecular-to-atomic gas mass ratios in S0–Sb galaxies, to be reported in K09b, which implies that HI can in fact flow inwards and become , fueling central star formation.
If the range of blue-centeredness we see in the sub- blue-sequence E/S0s indicates different burst stages resulting from episodic gas inflow, then perhaps the specific star formation rate (SSFR) in these galaxies should scatter about some average SSFR expected based on the median 3 Gyr gas exhaustion timescale and the atomic gas mass of each galaxy. We consider the difference between this expected SSFR () and the observed SSFR as a function of (Figure 11). The error bars for are formal errors, and do not include systematic uncertainties from not being corrected for dust and/or from delays between the bluest stellar population colors and the peak of star formation. Such uncertainties may cause some of the significant scatter seen in this figure. Nonetheless, there is a suggestive trend with the more blue-centered galaxies having enhanced SSFRs, and the less blue-centered galaxies having reduced SSFRs.
The Spearman rank correlation coefficient for the data in Figure 11 is , with the probability of a null correlation at 19%. However, if we exclude IC 692 ( = 0.13) from the calculation, the correlation coefficient becomes , with a probability of a null correlation decreasing to 3%. Given the error bars, we infer that the relationship is likely real. This supports the inflow-driven burst picture, although follow-up on the apparent outliers would be informative.
The correlation between blue-centeredness and several properties — morphological peculiarities, the presence of companions, increasing molecular-to-atomic gas mass ratios, and enhanced SSFRs — suggests that the inflow of gas in sub- blue-sequence E/S0s may be episodic and triggered externally. Episodic inflows of gas in sub- blue-sequence E/S0s would imply that these galaxies are in various stages of bursty star formation, which is in agreement with the large ranges of prospective stellar mass growth (§4.2) and gas exhaustion times (§5.1.1) we see for this population.
This result also suggests that our focus on HI rather than molecular gas (to be discussed in Wei et al., in prep.) does not render our estimates of stellar mass growth and gas exhaustion time in §4.2 and 5.1.1 highly inaccurate. Although stars typically form from molecular gas, the estimates of inflow and minor merger/interaction timescales suggest that the transition from HI to may occur quickly enough that the potential for morphological transformation can be realized even after material already in the molecular phase has been consumed or otherwise dispersed. These inflow events may also play an important role in bridging between the sub- red- and blue-sequence E/S0 populations, triggering star formation in sub- red-sequence E/S0s such as the gas-rich UGC 5923 (discussed in §3.1.1) and moving E/S0s onto the blue sequence.

Observations of the SAURON E/S0 sample (de Zeeuw et al., 2002; Emsellem et al., 2004) have found that many intermediate-mass early-type galaxies seem to contain a disk-like stellar component (e.g., Emsellem et al. 2007; Krajnović et al. 2008) — possibly the remnant of a burst of star formation induced by the inflow of gas as discussed in this section. It is possible that some of our sub- blue-sequence E/S0s are in an active, post gas-infall star-forming phase but will eventually become passive early-type galaxies like those observed by Krajnović et al. (2008).
Some of the differences between the SAURON E/S0s and our blue-sequence E/S0s, however, likely arise from the differences between the two samples. While there are some E/S0s below the bimodality mass in the SAURON sample, these are in the minority; in contrast, the disk-building sub-population of blue-sequence E/S0s becomes numerically important only below this mass, and more notably below the threshold mass at (KGB). It is also possible that the accretion of fresh gas from external sources, as discussed in §5.1.2, will reignite star formation in some red-sequence E/S0s (in both samples) and continue building disks (KGB; Cortese & Hughes 2009). The high frequency of blue-sequence E/S0s below the threshold mass (5% of the general galaxy population and 25% of E/S0s, KGB) would be difficult to explain by quenching mergers alone, but could be explained if these systems’ star-forming phase is either long or episodic.
6. Summary
Kannappan, Guie, & Baker (2009) recently identified a population of E/S0s that reside on the blue sequence in color vs. stellar mass space, where spiral galaxies typically reside. Blue-sequence E/S0s increase in numbers below the bimodality mass () and especially below the gas richness threshold (5). These sub- blue-sequence E/S0s are characterized by fairly regular morphology, and many appear to be rebuilding disks (KGB). Blue-sequence E/S0s also fall between red-sequence E/S0s and spirals in the -radius and - relations, suggesting that they may be a transitional population (KGB).
In this paper, we examined the atomic gas content of blue-sequence E/S0s below to determine whether they have large enough gas reservoirs to transform to later-type morphology. In a representative sample drawn from the Nearby Field Galaxy Survey, we find that blue-sequence E/S0s have substantial atomic gas masses in the range of –, comparable to the gas masses of spiral and irregular galaxies in the same stellar mass range. Blue- and red-sequence E/S0s have distinctly different atomic gas-to-stellar mass ratios, with most blue-sequence E/S0s in the range of 0.1–1.0 and most red-sequence E/S0s 0.1. This suggests significantly greater potential for morphological transformation in blue-sequence E/S0s than red-sequence E/S0s.
Combining these atomic gas masses with current rates of star formation, we find that many of the sub- blue-sequence E/S0s can form new stars in the range of 10–60 of their current stellar masses within 3 Gyr, in both constant (i.e., allowing gas infall) and exponentially declining (i.e., closed box) star formation scenarios, provided that the atomic gas reservoir is available for star formation. In the constant star formation scenario, we find that about half of the sub- blue-sequence E/S0 systems will exhaust their gas reservoirs in 3 Gyr if no fresh gas infall is permitted.
Because of the lack of spatial resolution in our HI data, we cannot say for certain that the gas is readily available for star formation. We find evidence, however, which indicate that fresh gas may be brought inwards and made available for star formation on timescales shorter than the gas exhaustion timescale. We estimate the dynamical timescale for infall of extra-planar gas to be on average 1 Gyr, shorter than the gas exhaustion time for most of our galaxies. The frequency of inflow for gas trapped in diffuse disks may be dominated by the rate of minor mergers/interactions, which simulations find to occur every 1.4 Gyr or less for progenitor mass ratios of 1:100 or smaller (Fakhouri & Ma, 2008). As evidence of such events, we find that sub- blue-sequence E/S0s are more often blue-centered than the general galaxy population, where blue-centeredness is measured relative to the typical color gradient of galaxies at a given luminosity. Kannappan et al. (2004) find blue-centeredness to correlate with morphological peculiarities and companions, which supports the externally triggered gas inflow scenario. For blue-sequence E/S0s, we find a relationship between blue-centeredness and variations in specific star formation rates relative to typical reference values, suggesting that such inflows may be episodic and trigger bursts of star formation. In summary, this work clearly confirms that blue-sequence E/S0s have both the gas reservoirs and the potential for sustained star formation necessary for significant disk growth, consistent with evolution toward later-type morphology if the spatial distribution of the gas is extended. While our sample of 27 blue- and red-sequence E/S0s is sufficient for the analysis presented in this paper, it is important to extend our work to a larger sample of sub- E/S0s for more robust statistics. The multi-wavelength RESOLVE Survey underway (Kannappan & Wei, 2008) would be an ideal data set for such a study.
Active follow-up includes obtaining IRAM CO(1–0) and CO(2–1) spectra to quantify the molecular gas content in these galaxies, which may be a large fraction of the gas mass content and further extend the potential for morphological transformation in blue-sequence E/S0s. We are also obtaining VLA HI and CARMA CO(1–0) maps to resolve the distribution of the atomic and molecular gas in blue-sequence E/S0s. HI maps will allow us to look for extended gas disks, small companions, and/or signs of interactions. CO(1–0) maps may reveal inner disky “pseudobulges” growing in tandem with extended disks, as would be expected during the formation of late type galaxies.
Appendix A Appendix A
A.1. GBT Flux Measurements and Comparison with Literature Fluxes
Figure 12 plots our new GBT HI fluxes against literature fluxes compiled in HyperLeda (Paturel et al., 2003), showing good agreement between the two. Notes on individual galaxies are as follows:
For many galaxies (UGC 6655, UGC 7020A, NGC 3011, IC 1141, UGC 6570) the GBT HI profiles have much stronger S/N than those from the literature, hence any differences in flux measurements between GBT and literature are likely to be attributed to the noisy profiles of the literature data. This can be seen in the error bars in Figure 12.
NGC 5596: the literature flux is very noisy and has a velocity width of , so it makes sense that our flux measurement is smaller considering we measure a smaller velocity width.
NGC 4117: the literature data are also of poorer quality and suffer from confusion with a nearby companion NGC 4118 (1.5 and 643 ). We separate out the companion by using the width of the ionized gas from 850–1050 , which also agrees with our preliminary CO data for this galaxy.
UGC 12265N: one member of a galaxy pair; the HI is completely blended in with its smaller companion, UGC 12265S, only and 70 away (see Figure 3). Preliminary VLA HI data suggest that UGC 12265N contains about 1/4 of total HI within the GBT beam, so we use this fraction of the total HI flux for our analysis.
NGC 3522: HI spectrum from Lake & Schommer (1984) seem to have comparable S/N to our GBT spectrum, due to our rather short integration time. The 3 beam of the Arecibo Telescope used by Lake & Schommer (1984), however, could be missing some extended HI flux, which would explain the higher flux measurement on our part.
IC 1639, IC 195: both have known companions within the beam of the GBT. Because these galaxies do not have ionized-gas rotation information, we measure the HI flux within the range of stellar rotation (5344–5444 and 3498–3798 , respectively).
NGC 1029: does not have ionized-gas or stellar rotation data, so we exclude the companion by measuring the HI flux within a width given by Arecibo HI observations of this galaxy. The smaller 3 beam of the Arecibo Telescope does not detect the companion and finds a of 353 (Springob et al., 2005).
The following galaxies are classified as undetected, though HI emission was detected in velocity ranges corresponding to nearby galaxies. For these three galaxies, we give both the HI upper limit for the target galaxy as well as the HI flux from the nearby galaxy.
NGC 4308: The measured HI velocity suggests that the flux belongs to a nearby companion, UGC 7438 (5, 699 ), though this is not certain. Assigning the gas to NGC 4308 does not change any results since the measured atomic gas mass is still extremely low, of the stellar mass of the galaxy.
IC 1144: The measured HI velocity suggests that the flux belongs to a nearby companion, SDSS J155124.19+432506.8 (0.5, 12225 ).
UGC 12835: Based on the measured HI velocity, the HI flux clearly belongs to a companion in the beam, and the target galaxy is undetected.

A.2. GBT HI Profiles of Sub- E/S0s
We examine and discuss the HI profiles of red- and blue-sequence E/S0s, grouping them by different types of velocity profiles while noting the sequence they belong to (B, mid-sequence, and R).
Galaxies with flat velocity profiles: NGC 3011(B), NGC 1552(R), NGC 3522(R), and NGC 3499(R) all have HI profiles that are reminiscent of a gas disk extending either slightly into or well beyond the flat part of the rotation curve. These profiles are not as sharply peaked as the typical double-horned profile, suggesting that the gas disk does not extend too far into the flat part of the rotation curve. None of these galaxies have large companions within the beam of the GBT, though all of these profiles seem to have slight asymmetries, suggesting there may be distortions in the gas disk.
Galaxies with rising velocity profiles: UGC 6003(B), UGC 6655(B), UGC 6570(Mid), UGC 7020A(Mid), and NGC 5338(R) have sharply peaked HI profiles, which are indicative of gas disks that are still in the rising part of the rotation curve. Most of these are relatively symmetric and do not have any known large companions within the beam of the GBT.
Galaxies in between the first two cases: UGC 6805(B), IC 1141(B), and UGC 5923(R) have HI profiles that seem to be a combination of the previous two cases — their HI profiles all have a single peak like the rising rotation curve case, but there is a slight flattening suggesting that the gas is reaching the flat part of the rotation curve. UGC 6805 seems to have a gas disk with rotation in the rising part of the curve; although the center seems slightly flattened, it is hard to tell given the noise in the HI profile. IC 1141 and UGC 5923, on the other hand, seem to have centers that are much more flattened, suggesting that the gas disk may extend a little further into the flat part of the rotation curve. These galaxies also do not have any known large companions.
Galaxies with known companions: NGC 4117(R), UGC 12265N(B), IC 1639(B), and IC 195(B) all have optically confirmed companions. NGC 4117 has an asymmetric double horn profile between 800 and 1100 , and a companion (NGC 4118) and 643 away. UGC 12265N is actually a galaxy pair with UGC 12265S, and its HI profile is completely blended in since the two are less than 100 apart in velocity space. The larger peak in the HI profile for IC 1639 is actually its larger companion, IC 1640; IC 1639 is the smaller peak at 2581 . IC 195 has two companions: IC 196, which is away, but only about 15 apart in velocity space (so it is completely blended in), and Arp 290, which probably contributes to the HI profile at 3509 , located away.
Non-detections: UGC 130(R), NGC 516(R), NGC 3179(R), NGC 3605(R), NGC 4308(R), UGC 8876(R), IC 1144(B), and UGC 12835(R).
Miscellaneous: NGC 5596(R) and NGC 1298 (R) are both detections, but the S/N of their spectra are too poor to allow us to categorize their HI profiles.
References
- Baldry et al. (2004) Baldry, I. K., Glazebrook, K., Brinkmann, J., Ivezić, Ž., Lupton, R. H., Nichol, R. C., & Szalay, A. S. 2004, ApJ, 600, 681
- Barnes et al. (2001) Barnes, D. G., et al. 2001, MNRAS, 322, 486
- Barnes (2001) Barnes, J. E. 2001, in Astronomical Society of the Pacific Conference Series, Vol. 245, Astrophysical Ages and Times Scales, ed. T. von Hippel, C. Simpson, & N. Manset, 382–+
- Barnes (2002) Barnes, J. E. 2002, MNRAS, 333, 481
- Bekki (1998) Bekki, K. 1998, ApJ, 502, L133+
- Binney & Merrifield (1998) Binney, J., & Merrifield, M. 1998, Galactic Astronomy (Galactic Astronomy : by James Binney and Michael Merrifield. Princeton, NJ : Princeton University Press, 1998. (Princeton series in astrophysics) QB857 .B522 1998)
- Binney & Tremaine (2008) Binney, J., & Tremaine, S. 2008, Galactic Dynamics: Second Edition (Galactic Dynamics: Second Edition, by James Binney and Scott Tremaine. ISBN 978-0-691-13026-2 (HB). Published by Princeton University Press, Princeton, NJ USA, 2008.)
- Blitz & Rosolowsky (2004) Blitz, L., & Rosolowsky, E. 2004, ApJ, 612, L29
- Bournaud et al. (2005) Bournaud, F., Jog, C. J., & Combes, F. 2005, A&A, 437, 69
- Bower et al. (2006) Bower, R. G., Benson, A. J., Malbon, R., Helly, J. C., Frenk, C. S., Baugh, C. M., Cole, S., & Lacey, C. G. 2006, MNRAS, 370, 645
- Ciotti et al. (1991) Ciotti, L., D’Ercole, A., Pellegrini, S., & Renzini, A. 1991, ApJ, 376, 380
- Combes et al. (2007) Combes, F., Young, L. M., & Bureau, M. 2007, MNRAS, 377, 1795
- Cortese & Hughes (2009) Cortese, L., & Hughes, T. M. 2009, MNRAS, 1412
- Crocker et al. (2008) Crocker, A. F., Bureau, M., Young, L. M., & Combes, F. 2008, MNRAS, 386, 1811
- Darg et al. (2009) Darg, D. W., et al. 2009, ArXiv e-prints
- Dasyra et al. (2006) Dasyra, K. M., et al. 2006, ApJ, 651, 835
- de Zeeuw et al. (2002) de Zeeuw, P. T., et al. 2002, MNRAS, 329, 513
- Emsellem et al. (2004) Emsellem, E., et al. 2004, MNRAS, 352, 721
- Emsellem et al. (2007) —. 2007, MNRAS, 379, 401
- Faber & Gallagher (1976) Faber, S. M., & Gallagher, J. S. 1976, ApJ, 204, 365
- Fakhouri & Ma (2008) Fakhouri, O., & Ma, C.-P. 2008, MNRAS, 359
- Fouque et al. (1990) Fouque, P., Durand, N., Bottinelli, L., Gouguenheim, L., & Paturel, G. 1990, A&AS, 86, 473
- Fraternali & Binney (2008) Fraternali, F., & Binney, J. J. 2008, MNRAS, 386, 935
- Governato et al. (2007) Governato, F., Willman, B., Mayer, L., Brooks, A., Stinson, G., Valenzuela, O., Wadsley, J., & Quinn, T. 2007, MNRAS, 374, 1479
- Hawarden et al. (1981) Hawarden, T. G., Longmore, A. J., Goss, W. M., Mebold, U., & Tritton, S. B. 1981, MNRAS, 196, 175
- Haynes & Giovanelli (1984) Haynes, M. P., & Giovanelli, R. 1984, AJ, 89, 758
- Hibbard & van Gorkom (1996) Hibbard, J. E., & van Gorkom, J. H. 1996, AJ, 111, 655
- Hopkins et al. (2009) Hopkins, P. F., Cox, T. J., Younger, J. D., & Hernquist, L. 2009, ApJ, 691, 1168
- Huchtmeier & Richter (1989) Huchtmeier, W. K., & Richter, O.-G. 1989, A General Catalog of HI Observations of Galaxies. The Reference Catalog. (A General Catalog of HI Observations of Galaxies. The Reference Catalog. Huchtmeier, W.K., Richter, O.-G., pp. 350. ISBN 0-387-96997-7. Springer-Verlag Berlin Heidelberg 1989)
- Jansen et al. (2000a) Jansen, R. A., Fabricant, D., Franx, M., & Caldwell, N. 2000a, ApJS, 126, 331
- Jansen et al. (2000b) Jansen, R. A., Franx, M., Fabricant, D., & Caldwell, N. 2000b, ApJS, 126, 271
- Kannappan (2004) Kannappan, S. J. 2004, ApJ, 611, L89
- Kannappan & Fabricant (2001) Kannappan, S. J., & Fabricant, D. G. 2001, AJ, 121, 140
- Kannappan et al. (2002) Kannappan, S. J., Fabricant, D. G., & Franx, M. 2002, AJ, 123, 2358
- Kannappan & Gawiser (2007) Kannappan, S. J., & Gawiser, E. 2007, ApJ, 657, L5
- Kannappan et al. (2009) Kannappan, S. J., Guie, J. M., & Baker, A. J. 2009, AJ, 138, 579 (KGB)
- Kannappan et al. (2004) Kannappan, S. J., Jansen, R. A., & Barton, E. J. 2004, AJ, 127, 1371
- Kannappan & Wei (2008) Kannappan, S. J., & Wei, L. H. 2008, in American Institute of Physics Conference Series, Vol. 1035, The Evolution of Galaxies Through the Neutral Hydrogen Window, ed. R. Minchin & E. Momjian, 163–168
- Kannappan et al. (2009) Kannappan et al. 2009, in preparation, (K09b)
- Kewley et al. (2006) Kewley, L. J., Geller, M. J., & Barton, E. J. 2006, AJ, 131, 2004
- Kewley et al. (2002) Kewley, L. J., Geller, M. J., Jansen, R. A., & Dopita, M. A. 2002, AJ, 124, 3135
- Knapp et al. (1978) Knapp, G. R., Kerr, F. J., & Williams, B. A. 1978, ApJ, 222, 800
- Knapp & Rupen (1996) Knapp, G. R., & Rupen, M. P. 1996, ApJ, 460, 271
- Knapp et al. (1985) Knapp, G. R., Turner, E. L., & Cunniffe, P. E. 1985, AJ, 90, 454
- Krajnović et al. (2008) Krajnović, D., et al. 2008, MNRAS, 390, 93
- Lake & Schommer (1984) Lake, G., & Schommer, R. A. 1984, ApJ, 280, 107
- Lavalley et al. (1992) Lavalley, M. P., Isobe, T., & Feigelson, E. D. 1992, in Bulletin of the American Astronomical Society, Vol. 24, Bulletin of the American Astronomical Society, 839–840
- Lees et al. (1991) Lees, J. F., Knapp, G. R., Rupen, M. P., & Phillips, T. G. 1991, ApJ, 379, 177
- Leroy et al. (2008) Leroy, A. K., Walter, F., Brinks, E., Bigiel, F., de Blok, W. J. G., Madore, B., & Thornley, M. D. 2008, AJ, 136, 2782
- Li et al. (2008) Li, C., Kauffmann, G., Heckman, T. M., White, S. D. M., & Jing, Y. P. 2008, MNRAS, 385, 1915
- Li et al. (2006) Li, Y., Mac Low, M.-M., & Klessen, R. S. 2006, ApJ, 639, 879
- Lin & Tremaine (1983) Lin, D. N. C., & Tremaine, S. 1983, ApJ, 264, 364
- Marganian et al. (2006) Marganian, P., Garwood, R. W., Braatz, J. A., Radziwill, N. M., & Maddalena, R. J. 2006, in Astronomical Society of the Pacific Conference Series, Vol. 351, Astronomical Data Analysis Software and Systems XV, ed. C. Gabriel, C. Arviset, D. Ponz, & S. Enrique, 512–+
- Morganti et al. (1997) Morganti, R., Sadler, E. M., Oosterloo, T., Pizzella, A., & Bertola, F. 1997, AJ, 113, 937
- Morganti et al. (2006) Morganti, R., et al. 2006, MNRAS, 371, 157
- Naab et al. (2006) Naab, T., Jesseit, R., & Burkert, A. 2006, MNRAS, 372, 839
- Noordermeer et al. (2005) Noordermeer, E., van der Hulst, J. M., Sancisi, R., Swaters, R. A., & van Albada, T. S. 2005, A&A, 442, 137
- Oosterloo et al. (2002) Oosterloo, T. A., Morganti, R., Sadler, E. M., Vergani, D., & Caldwell, N. 2002, AJ, 123, 729
- Paturel et al. (2003) Paturel, G., Theureau, G., Bottinelli, L., Gouguenheim, L., Coudreau-Durand, N., Hallet, N., & Petit, C. 2003, A&A, 412, 57
- Sadler et al. (2000) Sadler, E. M., Oosterloo, T. A., Morganti, R., & Karakas, A. 2000, AJ, 119, 1180
- Sage & Welch (2006) Sage, L. J., & Welch, G. A. 2006, ApJ, 644, 850
- Sage et al. (2007) Sage, L. J., Welch, G. A., & Young, L. M. 2007, ApJ, 657, 232
- Sancisi (1992) Sancisi, R. 1992, in Physics of Nearby Galaxies: Nature or Nurture?, ed. T. X. Thuan, C. Balkowski, & J. Tran Thanh van, 31–+
- Schiminovich et al. (1995) Schiminovich, D., van Gorkom, J. H., van der Hulst, J. M., & Malin, D. F. 1995, ApJ, 444, L77
- Schneider et al. (1986) Schneider, S. E., Helou, G., Salpeter, E. E., & Terzian, Y. 1986, AJ, 92, 742
- Schneider et al. (1990) Schneider, S. E., Thuan, T. X., Magri, C., & Wadiak, J. E. 1990, ApJS, 72, 245
- Schweizer & Seitzer (1992) Schweizer, F., & Seitzer, P. 1992, AJ, 104, 1039
- Schweizer et al. (1989) Schweizer, F., van Gorkom, J. H., & Seitzer, P. 1989, ApJ, 338, 770
- Serra et al. (2007) Serra, P., Trager, S. C., van der Hulst, J. M., Oosterloo, T. A., Morganti, R., van Gorkom, J. H., & Sadler, E. M. 2007, New Astronomy Review, 51, 3
- Skrutskie et al. (2006) Skrutskie, M. F., et al. 2006, AJ, 131, 1163
- Somerville & Primack (1999) Somerville, R. S., & Primack, J. R. 1999, MNRAS, 310, 1087
- Springob et al. (2005) Springob, C. M., Haynes, M. P., Giovanelli, R., & Kent, B. R. 2005, ApJS, 160, 149
- Steinmetz & Navarro (2002) Steinmetz, M., & Navarro, J. F. 2002, New Astronomy, 7, 155
- Stewart et al. (2009) Stewart, K. R., Bullock, J. S., Wechsler, R. H., & Maller, A. H. 2009, ArXiv e-prints
- Stewart et al. (2008) Stewart, K. R., Bullock, J. S., Wechsler, R. H., Maller, A. H., & Zentner, A. R. 2008, ApJ, 683, 597
- Toomre & Toomre (1972) Toomre, A., & Toomre, J. 1972, ApJ, 178, 623
- van der Hulst et al. (2001) van der Hulst, J. M., van Albada, T. S., & Sancisi, R. 2001, in Astronomical Society of the Pacific Conference Series, Vol. 240, Gas and Galaxy Evolution, ed. J. E. Hibbard, M. Rupen, & J. H. van Gorkom, 451–+
- van Dokkum (2005) van Dokkum, P. G. 2005, AJ, 130, 2647
- van Gorkom et al. (1986) van Gorkom, J. H., Knapp, G. R., Raimond, E., Faber, S. M., & Gallagher, J. S. 1986, AJ, 91, 791
- Verheijen & Sancisi (2001) Verheijen, M. A. W., & Sancisi, R. 2001, A&A, 370, 765
- Wardle & Knapp (1986) Wardle, M., & Knapp, G. R. 1986, AJ, 91, 23
- Welch & Sage (2003) Welch, G. A., & Sage, L. J. 2003, ApJ, 584, 260
- White & Frenk (1991) White, S. D. M., & Frenk, C. S. 1991, ApJ, 379, 52
- Young (2002) Young, L. M. 2002, AJ, 124, 788
- Young (2005) —. 2005, ApJ, 634, 258
- Young et al. (2008) Young, L. M., Bureau, M., & Cappellari, M. 2008, ApJ, 676, 317
- Zaritsky & Rix (1997) Zaritsky, D., & Rix, H.-W. 1997, ApJ, 477, 118
| ID | Galaxy Name | UGC | Morph. | Sequence | () | () | sub- E/S0 | Reference | ||
|---|---|---|---|---|---|---|---|---|---|---|
| (km ) | (km ) | (Jy km ) | () | Sample | ||||||
| (1) | (2) | (3) | (4) | (5) | (6) | (7) | (8) | (9) | (10) | (11) |
| 1 | A00113p3037 | 130 | cE | R | 0.12 | 1.36 | GBT | |||
| 2 | A00289p0556 | 313 | Sd | B | 2085(7) | 48(2) | 0.78(0.13) | 1.65 | LE | |
| 3 | NGC193 | 408 | L- | R | 4220? | 2.0 | 1.80 | HR | ||
| 4 | A00389m0159 | 439 | Sa | B | 5299(7) | 55(3) | 4.94(1.28) | 6.54 | LE | |
| 5 | A00442p3224 | 484 | Sb | B | 4857(8) | 197(6) | 13.12(4.83) | 1.56 | LE | |
| 6 | A00510p1225 | 545 | Sc | 18339(8) | 175(9) | 1.03(0.33) | 1.66 | LE | ||
| 7 | NGC315 | 597 | E | R | 4921 | 1.33 | 1.63 | HR | ||
| 8 | A00570p1504 | 615 | Sab | B | 5507(3) | 164(12) | 1.72(0.21) | 2.53 | CEGG | |
| 9 | A01047p1625 | 685 | Im | 156(4) | 32(1) | 11.32(2.04) | 5.07 | LE | ||
| 10 | NGC382 | 688 | E | R | LE | |||||
| 11 | IC1639 | 750 | cE | B | 5381(12) | 22(10) | 0.70(0.08) | 9.55 | GBT | |
| 12 | A01123m0046 | 793 | Sc | B | 1.98 | 1.01 | HI | |||
| 13 | A01187m0048 | 892 | Sa | B | 5228(5) | 32(2) | 2.37(0.33) | 3.04 | CEGG | |
| 14 | NGC516 | 946 | L | R | 0.09 | 2.59 | GBT | |||
| 15 | A01300p1804 | 1104 | Im | B | 684(4) | 44(2) | 7.62(0.97) | 2.35 | LE | |
| 16 | A01344p2838 | 1154 | Sbc | B | 7758(7) | 124(5) | 5.03(2.38) | 1.47 | LE | |
| 17 | A01346p0438 | 1155 | Sbc | B | 3181(8) | 85(4) | 2.50(0.42) | 1.18 | LE | |
| 18 | A01374p1539B | 1176 | Im | 632(3) | 16(0.4) | 23.23(2.24) | 5.98 | LE | ||
| 19 | NGC695 | 1315 | Sc | B | 9729(6) | 148(5) | 3.93(0.84) | 1.84 | LE | |
| 20 | NGC784 | 1501 | Sm | 198(4) | 41(1) | 45.50(4.39) | 2.87 | LE | ||
| 21 | A02008p2350 | 1551 | Sdm | B | 2671(5) | 47(2) | 11.53(1.11) | 4.15 | LE | |
| 22 | IC195 | 1555 | S0/a | B | 3648(2) | 104(7) | 6.85(0.16) | 4.39 | GBT | |
| 23 | IC197 | 1564 | Sbc | B | 6316(6) | 122(9) | 8.26(0.86) | 1.55 | CEGG | |
| 24 | IC1776 | 1579 | Sc | B | 3410(6) | 48(2) | 12.19(3.16) | 6.64 | LE | |
| 25 | A02056p1444 | 1630 | Sb | B | 4437(3) | 133(10) | 6.39(0.67) | 5.94 | CEGG | |
| 26 | NGC825 | 1636 | Sa | R | 3397(5) | 217(10) | 5.89(1.52) | 3.20 | LE | |
| 27 | NGC927 | 1908 | Sc | B | 8266(10) | 94(4) | 4.43(1.15) | 1.43 | LE | |
| 28 | A02257m0134 | 1945 | Sdm | B | 1768(8) | 49(3) | 2.30(0.2) | 3.25 | LE | |
| 29 | NGC984 | 2059 | Sa | R | 4355(7) | 278(18) | 10.62(4.59) | 1.00 | LE | |
| 30 | NGC1029 | 2149 | S0/a | R | 3620(28) | 127(9) | 8.32(0.15) | 5.19 | GBT | |
| 31 | A02464p1807 | 2296 | cE | 6.9 | 3.39 | HR | ||||
| 32 | A02493m0122 | 2345 | Sm | B | 1506(5) | 40(2) | 19.68(2.5) | 2.03 | LE | |
| 33 | NGC1298 | 2683 | ?E | R | 6452(3) | 36(2) | 0.48(0.09) | 9.43 | GBT | |
| 34 | A03202m0205 | 2704 | Sa | B | 1.92 | 6.03 | HI | |||
| 35 | NGC1552 | 3015 | L | R | 4784(8) | 129(9) | 0.7(0.09) | 7.76 | GBT | |
| 36 | NGC2692 | 4675 | Sa | R | 4026(12) | 75(4) | 3.03(0.42) | 2.37 | LE | |
| 37 | A08567p5242 | 4713 | Sb | B | 9036(7) | 249(9) | 3.09(0.27) | 1.27 | LE | |
| 38 | A09045p3328 | 4787 | Sdm | B | 552(8) | 53(1) | 6.00(1.02) | 1.07 | LE | |
| 39 | NGC2780 | 4843 | Sab | B | 1962(7) | 130(10) | 0.25(0.06) | 5.83 | LE | |
| 40 | A09125p5303 | 4879 | Im | R | LE | |||||
| 41 | NGC2799 | 4909 | Sm | B | 1755(25) | 146(13) | 7.55(2.5) | 1.70 | LE | |
| 42 | NGC2824 | 4933 | L | R | LE | |||||
| 43 | NGC2844 | 4971 | Sa | B | 1489(6) | 145(5) | 6.46(0.82) | 9.75 | LE | |
| 44 | NGC3011 | 5259 | S0/a | B | 1543(2) | 76(5) | 1.24(0.08) | 1.93 | GBT | |
| 45 | NGC3009 | 5264 | Sc | B | 4564(12) | 194(13) | 2.95(0.34) | 3.42 | LE | |
| 46 | IC2520 | 5335 | Pec | B | 1238(8) | 85(8) | 6.00(1.69) | 6.31 | LE | |
| 47 | A09557p4758 | 5354 | Sm | B | 1171(4) | 76(3) | 17.14(1.48) | 1.85 | LE | |
| 48 | NGC3075 | 5360 | Sc | B | 3582(8) | 124(4) | 15.07(7.12) | 1.00 | LE | |
| 49 | A09579p0439 | 5378 | Sb | B | 4161(10) | 117(4) | 6.05(2.86) | 5.31 | LE | |
| 50 | NGC3104 | 5414 | Im | B | 603(3) | 41(2) | 17.78(1.36) | 4.33 | LE | |
| 51 | A10042p4716 | 5451 | Im | R | 629(9) | 52(2) | 2.84(0.64) | 7.17 | LE | |
| 52 | NGC3165 | 5512 | Im | R | 1333(4) | 61(2) | 3.45(0.78) | 3.63 | LE | |
| 53 | A10114p0716 | 5522 | Sc | B | 1220(4) | 90(2) | 27.92(2.98) | 2.62 | LE | |
| 54 | NGC3179 | 5555 | L | R | 0.19 | 5.10 | GBT | |||
| 55 | A10171p3853 | 5577 | Sm | B | 2028(9) | 45(2) | 3.30(0.93) | 8.61 | LE | |
| 56 | NGC3213 | 5590 | Sbc | B | 1346(5) | 67(4) | 1.47(0.35) | 2.01 | LE | |
| 57 | NGC3264 | 5719 | Sdm | B | 940(7) | 60(2) | 14.93(1.44) | 1.16 | LE | |
| 58 | NGC3279 | 5741 | Sc | B | 1393(6) | 156(4) | 3.55(0.96) | 4.81 | LE | |
| 59 | A10321p4649 | 5744 | Sc | B | LE | |||||
| 60 | A10337p1358 | 5760 | Scd | B | 3010(6) | 139(5) | 3.78(0.33) | 1.86 | LE | |
| 61 | IC2591 | 5763 | Sbc | B | 6797(10) | 160(5) | 8.75(4.13) | 2.04 | LE | |
| 62 | A10365p4812 | 5791 | Sc | B | 857(5) | 67(3) | 3.72(1.05) | 2.34 | LE | |
| 63 | A10368p4811 | 5798 | Sc | B | 1519(6) | 72(5) | 5.37(1.52) | 9.36 | LE | |
| 64 | NGC3326 | 5799 | Sb | B | 8153(8) | 100(6) | 2.77(0.88) | 8.97 | LE | |
| 65 | A10389p3859 | 5819 | Sbc | B | LE | |||||
| 66 | A10431p3514 | 5870 | Sa | B | 1992(6) | 100(7) | 4.59(1.3) | 1.24 | LE | |
| 67 | A10448p0731 | 5892 | Sb | B | 1.53 | 4.97 | HI | |||
| 68 | A10465p0711 | 5923 | S0/a | R | 713(4) | 65(5) | 3.12(0.16) | 4.71 | GBT | |
| 69 | A10504p0454 | 6003 | S0/a | B | 5819(5) | 67(5) | 1.47(0.09) | 2.46 | GBT | |
| 70 | NGC3454 | 6026 | Sc | B | 1109(5) | 91(3) | 5.62(1.26) | 5.62 | LE | |
| 71 | A10592p1652 | 6104 | Sbc | B | 2947(5) | 110(2) | 7.41(1.26) | 3.59 | LE | |
| 72 | NGC3499 | 6115 | S0/a | R | 1495(12) | 119(9) | 0.39(0.06) | 7.15 | GBT | |
| 73 | NGC3510 | 6126 | Sd | B | 704(3) | 79(2) | 33.57(2.9) | 7.26 | LE | |
| 74 | Mrk421 | 6132W | Pec | LE | ||||||
| 75 | NGC3522 | 6159 | L- | R | 1221(8) | 112(8) | 2.00(0.16) | 2.47 | GBT | |
| 76 | A11040p5130 | 6162 | Sc | B | 2208(5) | 95(4) | 12.65(1.74) | 4.04 | LE | |
| 77 | IC673 | 6200 | Sa | B | 3859(8) | 151(5) | 17.14(8.09) | 1.31 | LE | |
| 78 | A11068p4705 | 6201 | L- | R | LE | |||||
| 79 | A11072p1302 | 6206 | Sc | B | LE | |||||
| 80 | NGC3605 | 6295 | L- | R | 0.11 | 1.61 | GBT | |||
| 81 | A11142p1804 | 6296 | Sc | R | 976(6) | 82(3) | 2.10(0.72) | 8.28 | LE | |
| 82 | NGC3633 | 6351 | Sa | B | 2599(6) | 150(5) | 2.90(0.46) | 1.07 | LE | |
| 83 | IC692 | 6438 | E | B | 1163(8) | 35(3) | 2.50(0.71) | 2.71 | LE | |
| 84 | A11238p5401 | 6446 | Sd | 645(4) | 57(2) | 28.71(3.65) | 1.13 | LE | ||
| 85 | A11310p3254 | 6545 | Sb | B | 2630(6) | 66(7) | 1.00(0.28) | 4.20 | LE | |
| 86 | IC708 | 6549 | ?E | R | LE | |||||
| 87 | A11332p3536 | 6570 | S0/a | Mid | 1628(2) | 49(3) | 1.35(0.05) | 2.60 | GBT | |
| 88 | A11336p5829 | 6575 | Sc | B | 1216(5) | 95(3) | 13.12(1.27) | 1.68 | LE | |
| 89 | NGC3795A | 6616 | Scd | B | 1148(5) | 45(2) | 11.86(1.63) | 1.39 | LE | |
| 90 | A11372p2012 | 6625 | Sc | B | LE | |||||
| 91 | NGC3795 | 6629 | Sc | B | 1212(6) | 103(4) | 7.21(0.62) | 7.72 | LE | |
| 92 | A11378p2840 | 6637 | L- | B | 1836(6) | 61(5) | 1.84(0.87) | 4.31 | LE | |
| 93 | A11392p1615 | 6655 | L | B | 744(2) | 26(2) | 0.92(0.04) | 1.70 | GBT | |
| 94 | NGC3846 | 6706 | Sm | B | 1451(8) | 66(3) | 6.34(0.87) | 1.00 | LE | |
| 95 | NGC3850 | 6733 | Sc | 1149(8) | 69(3) | 7.91(1.34) | 9.43 | LE | ||
| 96 | A11476p4220 | 6805 | L | B | 1132(6) | 49(3) | 0.39(0.05) | 3.78 | GBT | |
| 97 | NGC3913 | 6813 | Sd | 954(3) | 19(1) | 10.52(1.12) | 9.06 | LE | ||
| 98 | IC746 | 6898 | Sb | B | 5028(3) | 123(4) | 6.95(1.1) | 9.31 | LE | |
| 99 | A11531p0132 | 6903 | Sc | 1892(6) | 78(3) | 15.35(2.44) | 3.54 | LE | ||
| 100 | NGC3978 | 6910 | Sbc | B | 9962(8) | 77(3) | 3.33(0.71) | 1.64 | LE | |
| 101 | A11547p4933 | 6930 | Sc | 778(5) | 50(2) | 27.41(4.06 | 1.53 | LE | ||
| 102 | A11547p5813 | 6931 | Sm | B | 1195(8) | 49(2) | 4.63(0.89) | 5.62 | LE | |
| 103 | NGC4034 | 7006 | Sc | B | 2367(8) | 91(6) | 3.21(0.28) | 1.19 | LE | |
| 104 | A11592p6237 | 7009 | Im | B | 1120(12) | 74(6) | 6.00(1.02) | 6.79 | LE | |
| 105 | A12001p6439 | 7020A | L | Mid | 1515(1) | 39(3) | 2.30(0.05) | 3.86 | GBT | |
| 106 | NGC4117 | 7112 | L | R | 934(2) | 122(9) | 5.10(0.20) | 4.36 | GBT | |
| 107 | NGC4120 | 7121 | Sc | B | 2246(7) | 92(4) | 10.42(0.9) | 3.53 | LE | |
| 108 | A12064p4201 | 7129 | Sab | R | 947(9) | 60(6) | 1.22(0.25) | 9.69 | LE | |
| 109 | NGC4141 | 7147 | Sc | R | 1902(7) | 70(3) | 6.89(0.60) | 1.90 | LE | |
| 110 | NGC4159 | 7174 | Sdm | B | 1753(12) | 77(5) | 5.68(2.09) | 1.29 | LE | |
| 111 | NGC4204 | 7261 | Sdm | 858(9) | 36(1) | 24.10(4.61) | 5.80 | LE | ||
| 112 | NGC4238 | 7308 | Sc | B | 2765(6) | 113(6) | 5.78(0.50) | 2.78 | LE | |
| 113 | NGC4248 | 7335 | Sdm | R | 484(14) | 29(3) | 4.63(1.31) | 8.05 | LE | |
| 114 | A12167p4938 | 7358 | Sc | B | 3658(6) | 132(5) | 5.27(1.01) | 4.04 | LE | |
| 115 | NGC4272 | 7378 | L- | LE | ||||||
| 116 | NGC4288 | 7399 | Sm | B | 535(4) | 77(3) | 26.18(3.6) | 5.38 | LE | |
| 117 | NGC4308 | 7426 | L | R | 0.06 | 1.01 | GBT | |||
| 118 | A12195p3222 | 7428 | Sdm | 1138(6) | 28(1) | 7.21(2.04) | 9.43 | LE | ||
| 119 | A12195p7535 | cE | LE | |||||||
| 120 | A12263p4331 | 7608 | Im | 536(5) | 24(1) | 20.42(2.39) | 3.80 | LE | ||
| 121 | A12295p4007 | 7678 | Sd | B | 682(9) | 24(1) | 5.03(1.42) | 1.49 | LE | |
| 122 | A12300p4259 | 7690 | Sdm | B | 538(11) | 35(2) | 14.52(2.46) | 2.73 | LE | |
| 123 | A12304p3754 | 7699 | Sd | B | 500(7) | 81(3) | 20.04(2.34) | 2.67 | LE | |
| 124 | NGC4509 | 7704 | Sm | B | 937(8) | 38(4) | 3.89(1.84) | 2.72 | LE | |
| 125 | A12331p7230 | 7761 | Sb | B | LE | |||||
| 126 | A12446p5155 | 7950 | Im | B | 498(4) | 35(1) | 5.89(0.63) | 1.37 | LE | |
| 127 | NGC4758 | 8014 | Sbc | B | 1243(6) | 79(3) | 8.59(1.46) | 1.24 | LE | |
| 128 | NGC4795 | 8037 | Sa | R | 2812(5) | 155(7) | 1.70(0.23) | 7.88 | LE | |
| 129 | NGC4807 | 8049 | L+ | R | LE | |||||
| 130 | NGC4841B | 8073 | E | LE | ||||||
| 131 | NGC4926 | 8142 | L- | R | LE | |||||
| 132 | NGC4961 | 8185 | Sbc | 2534(4) | 93(3) | 12.19(1.94) | 4.98 | LE | ||
| 133 | A13065p5420 | 8231 | Sb | B | LE | |||||
| 134 | IC4213 | 8280 | Scd | B | 815(4) | 81(4) | 8.51(0.99) | 4.44 | LE | |
| 135 | A13194p4232 | 8400 | Scd | B | LE | |||||
| 136 | NGC5117 | 8411 | Sc | 2392(4) | 96(3) | 9.25(1.47) | 3.51 | LE | ||
| 137 | NGC5173 | 8468 | E | B | 2428(6) | 81(7) | 4.99(1.06) | 2.00 | LE | |
| 138 | A13281p3153 | 8498 | Sab | B | 7320(8) | 290(19) | 11.43(5.40) | 3.19 | LE | |
| 139 | NGC5208 | 8519 | L | R | 2.72 | 6.36 | HI | |||
| 140 | NGC5230 | 8573 | Sc | B | 6856(6) | 65(2) | 8.75(1.39) | 2.12 | LE | |
| 141 | A13361p3323 | 8630 | Sm | B | 2438(7) | 83(3) | 6.70(0.58) | 2.48 | LE | |
| 142 | NGC5267 | 8655 | Sb | B | 70(4) | 0.78(0.16) | 1.47 | LE | ||
| 143 | A13422p3526 | 8693 | Sbc | B | 2438(8) | 106(4) | 8.36(3.95) | 3.41 | LE | |
| 144 | NGC5338 | 8800 | L | R | 801(9) | 20(1) | 0.77(0.12) | 1.93 | GBT | |
| 145 | NGC5356 | 8831 | Sb | B | 1372(5) | 122(4) | 4.39(0.84) | 6.75 | LE | |
| 146 | A13550p4613 | 8876 | S0/a | R | 0.15 | 4.78 | GBT | |||
| 147 | NGC5407 | 8930 | L | R | LE | |||||
| 148 | NGC5425 | 8933 | Sc | B | 2072(8) | 103(5) | 6.64(0.78) | 2.01 | LE | |
| 149 | A14016p3559 | 8984 | L | R | LE | |||||
| 150 | NGC5470 | 9020 | Sb | 1026(8) | 109(4) | 7.69(1.47) | 6.75 | LE | ||
| 151 | NGC5491 | 9072A | Sc | B | 5888(7) | 214(3) | 6.17(1.05) | 1.10 | LE | |
| 152 | NGC5532 | 9137 | L | R | LE | |||||
| 153 | NGC5541 | 9139 | Sc | B | LE | |||||
| 154 | NGC5596 | 9208 | L | R | 3220(24) | 94(7) | 0.52(0.14) | 3.17 | GBT | |
| 155 | NGC5608 | 9219 | Sm | B | 664(6) | 46(2) | 9.33(1.09) | 4.19 | LE | |
| 156 | A14305p1149 | 9356 | Sc | B | 2226(6) | 103(3) | 15.92(2.53) | 5.18 | LE | |
| 157 | NGC5684 | 9402 | L | R | LE | |||||
| 158 | NGC5762 | 9535 | Sa | B | 1792(8) | 80(3) | 7.48(1.77) | 1.71 | LE | |
| 159 | A14489p3547 | 9560 | Pec | B | 1218(4) | 80(4) | 4.47(0.95) | 5.99 | LE | |
| 160 | A14492p3545 | 9562 | L+ | B | 1257(3) | 76(3) | 11.97(2.29) | 1.79 | LE | |
| 161 | IC1066 | 9573 | Sab | B | 1576(6) | 90(3) | 7.69(2.93) | 1.43 | LE | |
| 162 | A14594p4454 | 9660 | Sc | B | 608(9) | 29(2) | 6.00(1.69) | 2.75 | LE | |
| 163 | A15016p1037 | cE | LE | |||||||
| 164 | IC1100 | 9729 | Scd | B | LE | |||||
| 165 | NGC5874 | 9736 | Sbc | B | 3128(5) | 139(5) | 6.82(1.08) | 4.12 | LE | |
| 166 | NGC5875A | 9741 | Sc | B | LE | |||||
| 167 | NGC5888 | 9771 | Sb | B | LE | |||||
| 168 | IC1124 | 9869 | Sab | B | 5313(8) | 160(11) | 3.48(0.90) | 5.19 | LE | |
| 169 | NGC5940 | 9876 | Sab | 10214(6) | 78(3) | 1.58(0.25) | 7.90 | LE | ||
| 170 | A15314p6744 | 9896 | Sc | 6466(6) | 115(4) | 4.34(0.42) | 9.72 | LE | ||
| 171 | NGC5993 | 10007 | Sb | B | 9562(9) | 76(6) | 5.83(1.65) | 2.67 | LE | |
| 172 | IC1141 | 10051 | S0/a | B | 4389(3) | 93(7) | 1.82(0.07) | 1.98 | GBT | |
| 173 | IC1144 | 10069 | S0/a | B | 0.07 | 5.37 | GBT | |||
| 174 | NGC6007 | 10079 | Sbc | B | 10544(5) | 184(3) | 8.99(2.65) | 4.89 | LE | |
| 175 | A15523p1645 | 10086 | Sc | B | 2.06 | 6.53 | LE | |||
| 176 | A15542p4800 | 10097 | L | R | HI | |||||
| 177 | NGC6020 | 10100 | ?E | R | 2.10 | 2.26 | HI | |||
| 178 | NGC6123 | 10333 | S0/a | R | 3964(12) | 34(3) | 3.01(0.85) | 2.78 | LE | |
| 179 | NGC6131 | 10356 | Sc | B | 5061(12) | 93(7) | 4.85(1.37) | 6.86 | LE | |
| 180 | NGC6185 | 10444 | Sa | B | LE | |||||
| 181 | NGC7077 | 11755 | S0/a | B | 1148(6) | 47(2) | 2.00(0.41) | 1.69 | LE | |
| 182 | NGC7194 | 11888 | ?E | R | 8105(?) | 106(?) | 6.17(0.58) | 2.02 | HI | |
| 183 | A22306p0750 | 12074 | Sc | B | 1989(7) | 70(3) | 1.90(0.32) | 4.15 | LE | |
| 184 | NGC7328 | 12118 | Sab | B | 2824(6) | 143(4) | 10.33(1.75) | 4.33 | LE | |
| 185 | NGC7360 | 12167 | E | B | 4685(7) | 157(8) | 3.96(1.87) | 4.31 | LE | |
| 186 | A22426p0610 | 12178 | Sdm | B | 1931(4) | 103(7) | 22.18(1.92) | 4.46 | LE | |
| 187 | A22551p1931N | 12265N | L | B | 5717(2) | 103(7) | 6.64(0.13) | 1.07 | GBT | |
| 188 | NGC7436 | 12269 | E | R | LE | |||||
| 189 | NGC7460 | 12312 | Sb | B | 3190(6) | 90(3) | 1.16(0.46) | 6.28 | LE | |
| 190 | NGC7537 | 12442 | Sbc | B | 2678(3) | 142(3) | 24.55(2.62) | 8.74 | LE | |
| 191 | NGC7548 | 12455 | L | R | 7991(6) | 83(4) | 0.29(0.07) | 9.02 | LE | |
| 192 | A23176p1541 | 12519 | Sd | B | 4378(5) | 145(5) | 4.23(0.32) | 4.07 | LE | |
| 193 | NGC7620 | 12520 | Scd | B | 9583(6) | 108(3) | 6.70(1.06) | 3.11 | LE | |
| 194 | A23264p1703 | 12620 | L | R | 6849 | 0.16 | 3.69 | CEGG | ||
| 195 | IC1504 | 12734 | Sb | B | 6274(6) | 204(7) | 7.28(0.63) | 1.39 | LE | |
| 196 | NGC7752 | 12779 | Sd | B | 5044(8) | 170(10) | 8.67(1.95) | 1.06 | LE | |
| 197 | A23514p2813 | 12835 | E | R | 0.20 | 4.79 | GBT | |||
| 198 | A23542p1633 | 12856 | Im | B | 1776(5) | 66(2) | 11.53(1.11) | 2.02 | LE | |
| 199 | A04345m0225 | 3104 | L | 9739(8) | 87(6) | 1.37(0.39) | 4.99 | LE | ||
| 200 | NGC1517 | 2970 | Sc | 3483(3) | 79(3) | 10.71(0.93) | 6.04 | LE |
Note. — Col. (1): NFGS ID number. Col. (2): NGC number, IC number, or IAU anonymous notation. Col. (3): UGC number. Col. (4): Morphological type in the NFGS database. Col. (5): Sequence association (red, blue, or mid) if and color are available, see Figure 1. Col. (6): Heliocentric optical velocity measured from HI in . Col. (7): Observed maximum rotation speed in . Col. (8): Velocity-integrated HI flux in . Col. (9): HI gas mass calculated from following Haynes & Giovanelli (1984). Col. (10): Reference for HI data. GBT: new GBT observations presented in this paper, LE: HyperLeda (Paturel et al., 2003), HR: A General Catalog of HI Observations of Galaxies, (Huchtmeier & Richter, 1989), CEGG: Cornell EGG HI Digital Archive (Springob et al., 2005), HI: HIPASS (Barnes et al., 2001).
| ID | Galaxy Name | UGC | () | () | () | ) | ||||
|---|---|---|---|---|---|---|---|---|---|---|
| (J2000) | (J2000) | (s) | (km ) | (km ) | (km ) | (Jy km ) | (mJy) | |||
| (1) | (2) | (3) | (4) | (5) | (6) | (7) | (8) | (9) | (10) | (11) |
| 1 | A00113+3037 | 130 | 00:13:56.9 | +30:52:59 | 2970 | 0.12 | 0.93 | |||
| 11 | IC1639 | 750 | 01:11:46.5 | -00:39:52 | 2700 | 5381(12) | 83(35) | 54(23) | 0.19(0.05) | 1.00 |
| 5523(12) | 253(36) | 80(24) | 0.70 0.08) | 1.00 | ||||||
| 14 | NGC516 | 946 | 01:24:08.1 | +09:33:06 | 4440 | 0.09 | 0.80 | |||
| 22 | IC195 | 1555 | 02:03:44.6 | +14:42:33 | 1140 | 3648(2) | 264(7) | 229(4) | 4.28(0.12) | 1.46 |
| 3631(3) | 474(10) | 393(7) | 6.85(0.16) | 1.46 | ||||||
| 30 | NGC1029 | 2149 | 02:39:36.5 | +10:47:36 | 870 | 3620(28) | 340(83) | 267(55) | 7.41(0.14) | 1.56 |
| 3609(30) | 365(91) | 277(60) | 8.32(0.15) | 1.56 | ||||||
| 33 | NGC1298 | 2683 | 03:20:13.1 | -02:06:51 | 840 | 6452(3) | 91(10) | 86(6) | 0.48(0.09) | 1.87 |
| 35 | NGC1552 | 2683 | 04:20:17.7 | -00:41:34 | 3180 | 4784(8) | 318(24) | 281(16) | 0.70(0.09) | 0.98 |
| 44 | NGC3011 | 5259 | 09:49:41.2 | +32:13:15 | 2100 | 1543(2) | 179(7) | 170(5) | 1.24(0.08) | 1.25 |
| 54 | NGC3179 | 5555 | 10:17:57.2 | +41:06:51 | 1740 | 0.19 | 1.31 | |||
| 68 | A10465+0711 | 5923 | 10:49:07.6 | +06:55:02 | 870 | 713(4) | 188(11) | 149(7) | 3.12(0.16) | 2.31 |
| 69 | A10504+0454 | 6003 | 10:53:03.8 | +04:37:54 | 1740 | 5819(5) | 234(16) | 152(11) | 1.47(0.09) | 1.17 |
| 72 | NGC3499 | 6115 | 11:03:11.0 | +56:13:18 | 6990 | 1495(12) | 370(35) | 261(23) | 0.39(0.06) | 0.58 |
| 75 | NGC3522 | 6159 | 11:06:40.4 | +20:05:08 | 900 | 1221(8) | 308(24) | 246(16) | 2.00(0.16) | 1.82 |
| 80 | NGC3605 | 6295 | 11:16:46.6 | +18:01:02 | 900 | 0.11 | 1.33 | |||
| 87 | A11332+3536 | 6570 | 11:35:49.1 | +35:20:06 | 3600 | 1628(2) | 155(7) | 113(4) | 1.35(0.05) | 0.82 |
| 93 | A11392+1615 | 6655 | 11:41:50.6 | +15:58:25 | 3600 | 744(2) | 86(5) | 63(3) | 0.92(0.04) | 0.97 |
| 96 | A11476+4220 | 6805 | 11:50:12.3 | +42:04:28 | 3600 | 1132(6) | 137(17) | 114(11) | 0.39(0.05) | 0.90 |
| 105 | A12001+6439 | 7020A | 12:02:37.6 | +64:22:35 | 2100 | 1515(1) | 136(4) | 91(3) | 2.30(0.05) | 0.91 |
| 106 | NGC4117 | 7112 | 12:07:46.1 | +43:07:35 | 900 | 950(2) | 197(6) | 197(4) | 2.20(0.13) | 1.80 |
| 839(2) | 480(7) | 450(5) | 5.10(0.2) | 1.80 | ||||||
| 117 | NGC4308aaThe companion flux noted for this galaxy may in fact belong to NGC 4308, although the offset between the optical and measured HI velocity suggests that the flux belongs to a nearby companion. | 7426 | 12:21:56.9 | +30:04:27 | 8070 | 0.06 | 0.61 | |||
| 702(5) | 69(15) | 56(10) | 0.13(0.03) | 0.61 | ||||||
| 144 | NGC5338 | 8800 | 13:53:26.5 | +05:12:28 | 900 | 801(9) | 110(27) | 48(18) | 0.77(0.12) | 2.23 |
| 146 | A13550+4613 | 8876 | 13:56:58.0 | +45:58:24 | 2100 | 0.15 | 1.24 | |||
| 154 | NGC5596 | 9208 | 14:22:28.7 | +37:07:20 | 1920 | 3220(24) | 385(73) | 209(49) | 0.52(0.14) | 1.40 |
| 172 | IC1141 | 10051 | 15:49:46.9 | +12:23:57 | 4140 | 4389(3) | 237(8) | 207(5) | 1.82(0.07) | 0.92 |
| 173 | IC1144bbThe measured HI velocity suggests that the flux belongs to a nearby companion. | 10069 | 15:51:21.7 | +43:25:03 | 5700 | 0.07 | 0.62 | |||
| 12206(6) | 215(19) | 175(13) | 0.47(0.05) | 0.62 | ||||||
| 187 | A22551+1931NccPreliminary VLA HI data (Wei et al., in prep.) suggest that UGC 12265N contains about 1/4 of total HI within the GBT beam, so we use this fraction of the total HI flux for our analysis. | 12265N | 22:57:36.0 | +19:47:26 | 1140 | 1.66(0.13) | 1.44 | |||
| 5717(2) | 315(7) | 227(5) | 6.64(0.13) | 1.44 | ||||||
| 197 | A23514+2813 | 12835 | 23:53:56.7 | +28:29:34 | 4080 | 0.20 | 0.79 | |||
| 6728(5) | 204(16) | 182(10) | 0.43(0.06) | 0.79 |
Note. — For galaxies with large companions in the GBT beam, we measure the HI flux twice. The first row contains values measured in the ionized-gas/stellar velocity range, or upper limits if the galaxy is undetected. The second row includes companion flux (if any) within 300 of the target galaxy. Please see §2.2.3 for more details. Col. (1): NFGS ID number. Col. (2): NGC number, IC number, or IAU anonymous notation. Col. (3): UGC number. Col. (4): RA of GBT pointing center in :: (J2000). Col. (5): DEC of GBT pointing center in :: (J2000). Col. (6): Time on-source in seconds. Col. (7): Heliocentric optical velocity measured from HI in . Col. (8): Velocity width measured at the 20% level in . Col. (9): Velocity width measured at the 50% level in . Col. (10): Velocity-integrated HI flux in . Col. (11): Channel-to-channel RMS of the HI spectrum in mJy.
| Galaxy Name | () | |
|---|---|---|
| IC 1639 | 0.01 | |
| IC 195 | 0.12 | |
| NGC 3011 | 0.12 | |
| UGC 6003 | 0.29 | |
| IC 692 | 0.53 | |
| UGC 6637 | 0.38 | |
| UGC 6655 | 0.26 | |
| UGC 6805 | 0.07 | |
| NGC 5173 | 0.15 | |
| UGC 9562 | 3.35 | |
| IC 1141 | 0.12 | |
| NGC 7077 | 0.34 | |
| NGC 7360 | 0.18 | |
| UGC 12265N | 0.30 | |
| UGC 6570 | 0.10 | |
| UGC 7020A | 0.25 | |
| NGC 516 | 0.003 | |
| UGC 5923 | 0.51 | |
| NGC 3499 | 0.01 | |
| NGC 3522 | 0.07 | |
| NGC 3605 | 0.002 | |
| NGC 4117 | 0.05 | |
| NGC 4308 | 0.003 | |
| NGC 5338 | 0.04 | |
| UGC 8876 | 0.004 | |
| NGC 5596 | 0.03 | |
| NGC 6123 | 0.10 |
Note. — Values of and for blue-, mid-, and red-sequence E/S0s in the sub- sample.
| NFGS population | Fit Type | Slope | Intercept | Scatter |
|---|---|---|---|---|
| Blue Sequence: | ||||
| forward | -0.45 0.05 | 4.09 | 0.45 | |
| bisector | -0.72 | 6.70 | ||
| Spiral/Irregular: | ||||
| forward | -0.45 0.05 | 4.04 | 0.44 | |
| bisector | -0.70 | 6.49 | ||
| Red Sequence: | ||||
| forward | -0.67 0.12 | 5.23 | 0.58 | |
| bisector | -1.46 | 13.0 | ||
| E/S0: | ||||
| forward | -0.67 0.12 | 5.17 | 0.59 | |
| bisector | -1.57 | 13.9 |
Note. — Fits of for all galaxies in the NFGS with HI data, grouped by either sequence or morphological type. The forward fits were done using Buckley-James survival method in the ASURV package (Lavalley et al., 1992). The bisector fit is the mathematical bisector of the forward and backward fits using the same survival method, and so lacks estimates of the uncertainty and scatter.
| Galaxy | Seq. | |||
|---|---|---|---|---|
| (Gyr) | (Gyr) | (Gyr) | ||
| NGC 3011 | B | 6.7 | 0.06 | 1.0 |
| UGC 6003 | B | 1.8 | 0.12 | 2.5 |
| IC 692 | B | 12.1 | 0.15 | 1.3 |
| UGC 6637 | B | 6.4 | 0.17 | 1.6 |
| UGC 6655 | B | 3.1 | 0.09 | 1.0 |
| UGC 6805 | B | 1.1 | 0.06 | 1.1 |
| NGC 5173 | B | 21.1 | 0.17 | 0.7 |
| UGC 9562 | B | 38.3 | 0.10 | 1.6 |
| IC 1141 | B | 2.5 | 0.07 | 1.3 |
| NGC 7077 | B | 2.7 | 0.17 | 1.1 |
| NGC 7360 | B | 168.5 | 0.15 | 1.1 |
| UGC 12265N | B | 1.4 | 0.17 | 2.4 |
| UGC 6570 | Mid | 2.7 | 0.22 | 0.9 |
| UGC 7020A | Mid | 1.9 | 0.28 | 1.0 |
| UGC 5923 | R | 18.7 | 0.04 | 0.7 |
| NGC 5338 | R | 0.8 | 0.40 | 0.4 |
Note. — Col. (3): Gas exhaustion time, , in Gyr. Col. (4): Inward travel time of gas from the edge of the HI disk, following (Binney & Tremaine, 2008). We estimate using a typical ratio of HI to blue optical diameter of 2.11 for early type galaxies from Noordermeer et al. (2005), and is the inclination-corrected maximum rotation speed of the HI from . Col. (5): Inward travel time of gas from the edge of the GBT beam, following (Binney & Tremaine, 2008), where is the stellar mass of the galaxy multiplied by 10 to account for dark matter and is the distance from the edge of the GBT beam to the center of each galaxy.