The zCOSMOS-Bright survey: the clustering of early and late galaxy morphological types since
Abstract
We measure the spatial clustering of galaxies as a function of their morphological type at , for the first time in a deep redshift survey with full morphological information. This is obtained by combining high-resolution HST imaging and VLT spectroscopy for about galaxies to with accurate spectroscopic redshifts from the zCOSMOS-Bright redshift survey. At this epoch, early-type galaxies already show a significantly stronger clustering than late-type galaxies on all probed scales. A comparison to the SDSS at , shows that the relative clustering strength between early and late morphological classes tends to increase with cosmic time at small separations, while on large scales it shows no significant evolution since . This suggests that most early-type galaxies had already formed in intermediate and dense environments at this epoch. Our results are consistent with a picture in which the relative clustering of different morphological types between and , reflects the evolving role of environment in the morphological transformation of galaxies, on top of the global mass-driven evolution.
keywords:
Cosmology: observations – Cosmology: large-scale structure of Universe – Galaxies: evolution – Galaxies: high-redshift – Galaxies: statistics.1 Introduction
In the local Universe, the clustering properties of galaxies depend on luminosity (e.g. Davis et al., 1988; Hamilton, 1988; White, Tully, & Davis, 1988; Park et al., 1994; Loveday et al., 1995; Benoist et al., 1996; Guzzo et al., 2000; Norberg et al., 2001; Zehavi et al., 2002, 2005; Li et al., 2006; Skibba et al., 2006; Wang et al., 2007; Swanson et al., 2008), colour (e.g. Willmer, da Costa, & Pellegrini, 1998; Zehavi et al., 2002, 2005; Li et al., 2006; Swanson et al., 2008; Skibba & Sheth, 2009), spectral type (e.g. Loveday, Tresse, & Maddox, 1999; Norberg et al., 2002; Madgwick et al., 2003; Wang et al., 2007), and environment (Abbas & Sheth, 2006, 2007). Differences in the clustering of the various galaxy morphological types are also observed (e.g. Davis & Geller, 1976; Giovanelli, Haynes, & Chincarini, 1986; Iovino et al., 1993; Loveday et al., 1995; Hermit et al., 1996; Guzzo et al., 1997; Willmer, da Costa, & Pellegrini, 1998; Zehavi et al., 2002; Skibba et al., 2009). Elliptical galaxies are more strongly clustered than spiral and irregular galaxies. Another manifestation of this phenomenon is the existence of a morphology-density relation (Dressler, 1980; Postman & Geller, 1984), which implies that a higher fraction of ellipticals than either spirals or irregulars, reside in denser environments. Spiral and irregular galaxies are more likely to populate less dense regions. However, the origin and relation between these dependences are still not fully understood. They are usually discussed in terms of a nature or nurture scenario, i.e. being intrinsic properties of galaxies at formation or originated from the interaction of galaxies with their environment all along their cosmic evolution.
At higher redshifts, our knowledge of galaxy clustering properties remains fragmentary. We know little about the clustering of the various morphological types. Deep surveys have detected an evolution in the global galaxy clustering with redshift up to (Coil et al., 2004; Le Fèvre et al., 2005; McCracken et al., 2008). Additional results indicate that the luminosity, colour, and spectral type dependences of clustering evolve with redshift. A less significant segregation is evident when we consider the dependence of clustering on either colour or spectral type, the difference in clustering strength between red/early-type and blue/late-type galaxies being shallower at than at (Meneux et al., 2006; Coil et al., 2008).
These observations are consistent with the accepted picture of hierarchical clustering growth and galaxy evolution, in which cold dark matter haloes form from the gravitational collapse of dark matter around peaks in the density field. Haloes evolve hierarchically, such that smaller haloes assemble to form larger and more massive haloes in high-density regions (Mo & White, 1996; Sheth & Tormen, 2002). In parallel, galaxies form within haloes, by means of the cooling of hot baryonic gas (White et al., 1987). In this framework, luminous and massive galaxies are expected to be more strongly clustered than fainter and less massive ones that tend to form in less clustered haloes, which are less biased with respect to the underlying mass distribution. Moreover, early-type galaxies, which are in general brighter than late-type galaxies, are more strongly clustered. This difference is thought to be related to their different formation histories. Early-type galaxies are understood to be the product of interaction processes (e.g. galaxy merging) and/or physical mechanisms that take place in dense environments, although mergers are more common in less dense group environments than at galaxy cluster cores (Ellison et al., 2010). Instead, late-type galaxies may not experience such dramatic events, being more likely to reside in less dense environments. Mergers are expected to affect galaxy morphology by creating or growing a galaxy bulge component, albeit a large gas fraction may result in a galaxy temporarily re-growing a disk. They contribute to the evolving number densities (e.g. de Ravel et al., 2009) and clustering properties of different types of galaxies.
Galaxy colours or spectral types are often used as proxies for galaxy morphologies, but are affected by uncertainties in tracing the same underlying galaxy populations across cosmic time. For instance, a disk galaxy containing an old stellar population would be classified as an early-type object. In a similar way, a starburst galaxy heavily obscured by dust would be classified as a red, early-type galaxy. In contrast, an old and red stellar population may dominate the measured stellar mass of an object, but the galaxy colour can be blue because of a recent burst of star formation. Colours are primarily related to galaxy recent star formation history at variance with morphologies, which may be the result of the interaction of galaxies with their surroundings. Selecting galaxies by colour or spectral type, or by morphology may give one different views on galaxy evolution and environmental effects at work. Studying how galaxy clustering depends on morphology and cosmic epoch may thus provide important and complementary clues to mechanisms through which galaxies developed into the population we see today. Such a study has not yet been possible at because of the lack of high resolution imaging surveys of sufficient size. The Cosmic Evolution Survey (COSMOS, Scoville et al., 2007) provides us with a unique sample in this respect.
In this work, we use the zCOSMOS-Bright spectroscopic sample of galaxies (Lilly et al., 2009) and measure for the first time the morphological dependence of galaxy clustering at . This paper is part of a series of three using the first epoch zCOSMOS-Bright sample, that investigate galaxy clustering as a function of galaxy physical properties: morphology (this paper), luminosity and stellar mass (Meneux et al., 2009), and colour (Porciani et al., in preparation).
The paper is organised as follows. In Sect. 2, we present the galaxy sample and its basic properties. In Sect. 3, we describe the method used to measure galaxy clustering. In Sect. 4, we provide the measurements of early- and late-type galaxy clustering. In Sect. 5, we summarise and discuss our results. Throughout this paper, we assume a flat cosmology with , , and . The magnitudes are quoted in the AB system and for simplicity, we denote the absolute magnitude in -band as .
2 The data
2.1 The zCOSMOS-Bright catalogue
zCOSMOS is an ongoing large spectroscopic survey being performed with the Visible Multi-Object Spectrograph (VIMOS, Le Fèvre et al., 2003) at the European Southern Observatory’s Very Large Telescope (ESO-VLT). The bright part of the survey, zCOSMOS-Bright, has been designed to follow-up spectroscopically the entire COSMOS-ACS field (Scoville et al., 2007; Koekemoer et al., 2007) to as faint as . Observations have used the medium resolution red grism with arcsec slits, yielding a spectral resolution of at 2.5 Å . The velocity uncertainty in the redshifts is estimated to be . The survey strategy, which consists of 8 passes of the VIMOS spectrograph across the field, will allow us to reach in the end a high sampling rate of about over the entire field (Lilly et al., 2007). In the present analysis, we use the first epoch zCOSMOS-Bright spectroscopic sample (also called zCOSMOS 10k-bright sample), which is based on the first two years of observations performed in 2005-2006. The first epoch sample covers an effective area of with an average sampling rate of about across the field. It consists of magnitude-selected objects according to . This selection provides a redshift distribution in the range that peaks at . A confidence class has been assigned to each object of the sample to characterise the confidence in the redshift determination and its nature. In this work, we use only galaxies with secure redshifts, i.e., objects with confidence classes , , , , , , and . Our sample thus represents of the full first-epoch zCOSMOS-Bright catalogue (see Lilly et al., 2009, for details). The zCOSMOS survey is able to benefit from the unprecedented multiwavelength coverage of the COSMOS field (Capak et al., 2007), which permits us to compute very accurate photometric redshifts (e.g. Ilbert et al., 2009). By incorporating the photometric redshift consistency information, we reach a spectroscopic confirmation rate of . The zCOSMOS survey design and the basic properties of the zCOSMOS-Bright catalogue are fully described in Lilly et al. (2007) and Lilly et al. (2009).
2.2 Galaxy morphology
A unique advantage of the COSMOS/zCOSMOS surveys is the HST-ACS high resolution imaging (Koekemoer et al., 2007) that is available over an area of . In particular, these data allow us to determine directly the morphology of galaxies out to . Morphologies used in this work were estimated using a robust classification scheme based on three non-parametric diagnostics of galaxy structure: concentration, asymmetry, and the Gini coefficient (Abraham et al., 1996; Abraham, van den Bergh, & Nair, 2003; Lotz, Primack, & Madau, 2004). We first computed the distance of each galaxy in the multi-parameter space with respect to each galaxy of a control sample of 500 galaxies that had been visually classified. A morphological class was then assigned to each galaxy depending on the most frequent class among those of the nearest neighbours in the control sample. The use of the nearest neighbours has been chosen as it maximises the completeness of the different classes in our sample. Galaxies were classified into three main morphological types: early-type, spiral, and irregular, with the early-type including both elliptical and lenticular galaxies (S0).
The classifier was optimised to be insensitive to band-shifting and surface brightness dimming. Since the classification is performed using a single photometric band and we study a relatively broad range of redshifts, our morphology measurements may be biased as a function of redshift because of the band-shifting effect (e.g. Lotz, Primack, & Madau, 2004). However, as discussed in Tasca et al. (2009) our morphologies can only be affected at redshifts greater than . Furthermore, the effect is small when only two broad classes of early- and late-type galaxies are defined (Brinchmann et al., 1998), which is the case here. In practice, spiral galaxies can be misclassified as irregulars but, since we define a broad class of late-type galaxies that includes both spiral and irregular galaxies, our analysis is unaffected by this bias. We evaluated the contamination and completeness of the different classes by applying our automated classifier to the control sample and comparing the resulting classification with the visual one. This comparison showed that our classification scheme is rather robust with only a small contamination of about for each class when considering only two broad classes of early-type and spiral+irregular galaxies. We verified, using more conservative morphological classes with almost no contamination but larger incompleteness (i.e. the “clean” sample of Tasca et al., 2009), that this has a limited impact on the clustering measurements. The effect is much smaller than the statistical error on measurements. We refer the reader to Tasca et al. (2009) for a full description of the classification scheme and the properties of the morphological sample.
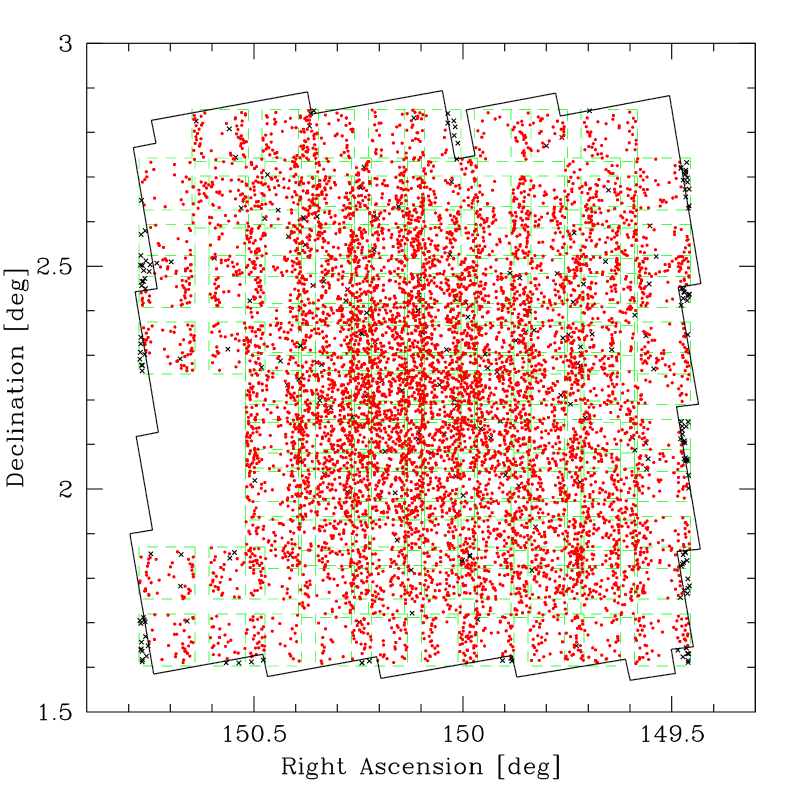
In this study we focus on two broad classes: early types and late types, the latter referring to galaxies morphologically classified as either spirals or irregulars. Because of the slightly different geometries of the COSMOS-ACS and zCOSMOS-Bright fields, a small number of galaxies in the zCOSMOS-Bright catalogue do not have morphological measurements. These galaxies, which represent of the zCOSMOS-Bright sample, are indicated by crosses in Fig. 1. In this analysis, we therefore remove galaxies that do not have a counterpart in the COSMOS-ACS photometric catalogue (Leauthaud et al., 2007). In the end, the effective area of the sample that we can use is defined to be the intersection of the COSMOS-ACS and zCOSMOS fields, after removal of regions affected by photometric defects for which no morphological measurement is available (see Fig. 1).
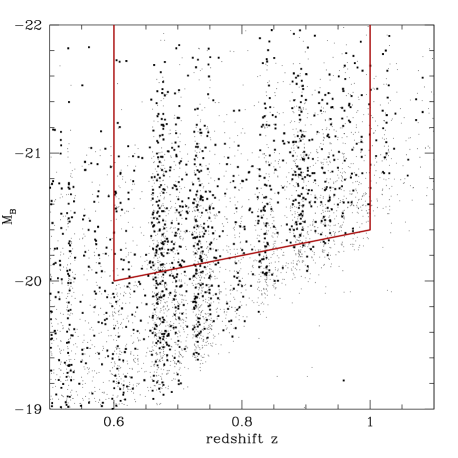
2.3 Sample selection
We consider a nearly volume-limited sample where galaxies are selected to be of absolute magnitude below a given threshold and to populate a complete comoving volume in the considered redshift interval. We focus on the high-redshift part of the zCOSMOS-Bright sample, defining volume-limited samples of early- and late-type galaxies at . The selection is performed on the basis of the galaxy -band absolute magnitudes to facilitate comparison with other studies. We include an intrinsic luminosity evolution in the definition of the sample by considering a linearly evolving absolute magnitude cut such as
| (1) |
where is a constant. This is performed to ensure that the evolution in the characteristic galaxy luminosity within the considered redshift interval is taken into account. This absolute magnitude threshold allows us to select galaxies with luminosities above at these redshifts. The mean luminosity of all galaxies selected above this threshold is about (Zucca et al., 2009).
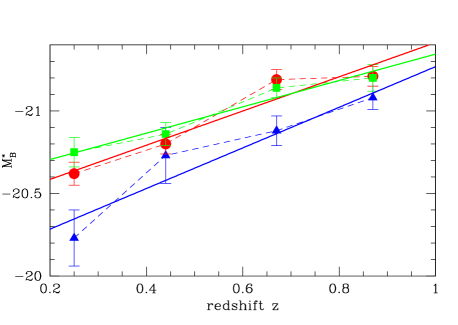
Different galaxy populations exhibit different luminosity evolutions (Lilly et al., 1996; Zucca et al., 2006) and thus depends on the morphological type. The value of can be inferred observationally from the evolution of the luminosity function for the different morphological types. We used the characteristic absolute magnitude in the -band, , derived from the same data by Zucca et al. (2009) in different redshift intervals and for different morphological types. We note that we used values obtained by keeping the faint-end slope of the luminosity function fixed. This is a reasonable decision since does not clearly exhibit any type of evolution at these redshifts (Zucca et al., 2009). We adopted this approach to avoid compensating for the luminosity evolution with an artificial increase in .
We therefore determined by fitting the redshift evolution in with a linear function. The values of for the three morphological types and their best-fit linear functions are presented in Fig. 2. We find a small amount of luminosity evolution for early types and spirals, given, respectively, by and , but a stronger evolution for irregular galaxies, for which . In the case of irregular galaxies, the value of is driven significantly in the fit by the low-redshift point, which has a relatively small and unexpected value. Excluding this point in the fit yields to a higher value of , close to that found for spirals. Therefore, after several tests and given the large uncertainty in these values, we assumed that for all morphological types, which is close to the average of the three morphological classes. We directly tested that varying the slope of the absolute magnitude cut removes or adds only a small fraction of galaxies and does not influence significantly the measurements of the correlation function.
3 Galaxy clustering estimation
3.1 The projected two-point correlation function
To estimate galaxy clustering, we use the standard projected two-point projected correlation function , which enables us to measure real-space clustering without being affected by redshift-space distortions. The three-dimensional galaxy distribution that is recovered from redshift surveys and its two-point correlation function are distorted because of the effect of galaxy peculiar motions. These motions affect in particular the distance measurements in the radial direction. By dividing the vector into two components, and , respectively perpendicular and parallel to the line-of-sight (Peebles, 1980; Fisher et al., 1994), one obtains the bi-dimensional two-point correlation function . One can then recover the true spatial correlations by integrating over the redshift-space distortion field, projecting along the line-of-sight. The projected two-point correlation function is related to both and the real-space two-point correlation function by the relations
| (2) |
To compute , we chose in practice to integrate out to Mpc. Given the volume of the survey, we found that this value is sufficiently large and optimally minimises the noise introduced at large by the uncorrelated pairs in the data (see also Meneux et al., 2009, Porciani et al., in preparation). This truncation introduces a global underestimation of of about that has to be taken into account when modelling the observations.
We computed using the standard Landy & Szalay (1993) estimator, which is defined by
| (3) |
where , , and are, respectively, the normalised numbers of distinct galaxy-galaxy, galaxy-random, and random-random pairs with comoving separations between and . In this analysis, we used random samples of objects.
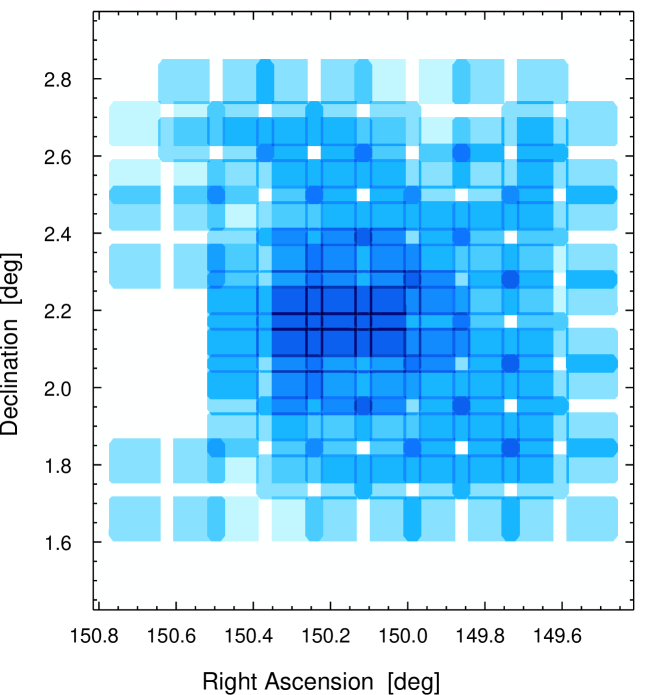
3.2 Observational biases
The zCOSMOS-Bright sample has a complex angular sampling because of the survey observational strategy and the shape of the VIMOS field-of-view. In Fig. 1, one can discern the VIMOS footprint and the superposition of multiple passes in the angular distribution of galaxies. To correct the projected correlation function for this non-uniform and incomplete angular sampling, we accurately estimated the background counts expected for unclustered objects in the field. We generated random catalogues with the detailed angular selection function of the sample by varying the number of random galaxies with angular position. More precisely, from the knowledge of the precise shape of the VIMOS field-of-view and the coordinates of the observed pointings, we distribute iteratively random galaxies inside the areas covered by each pointing. With this procedure, we reproduce in the random sample the effective surface density variations due to the non-uniform spectroscopic sampling of the zCOSMOS sample, illustrated in Fig. 4. The objects within regions of the parent photometric catalogue affected by photometric defects, and for which no morphological measurements were possible, were removed a posteriori by applying the COSMOS-ACS photometric mask (Leauthaud et al., 2007). This technique was already applied to the clustering analysis of the VIMOS-VLT Deep Survey (VVDS) (e.g. Le Fèvre et al., 2005; Pollo et al., 2006; Meneux et al., 2006; de la Torre et al., 2007), which suffers from similar observational biases (see Pollo et al., 2005, for details). In the present analysis, we improve this method by adding a correction for the non-uniform sampling inside each pointing and including a more accurate pair-weighting scheme to correct for the angular incompleteness, as described below.
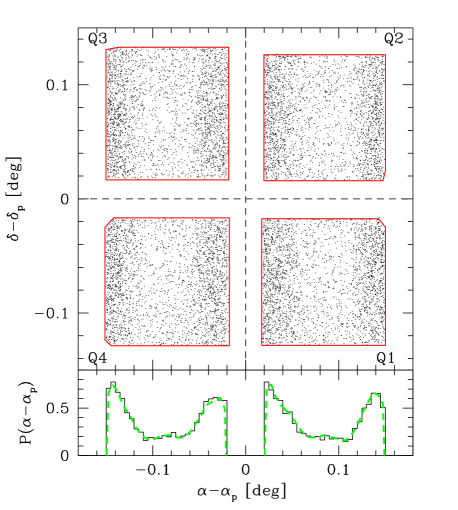
In the top panel of Fig. 5, we plot the distribution of zCOSMOS-Bright galaxies in the rest-frame angular coordinates of their pointing. The solid contours correspond to the effective shape of the four quadrants of the VIMOS field-of-view. In this figure, one can discern a variation in sampling as a function of the position within the pointing, in the right ascension direction. This non-uniform sampling is produced during the designing of slit masks to optimise the total number of slits, and in turn produces two layers of spectra in each mask (Bottini et al., 2005). This problem is more severe for zCOSMOS-Bright than VVDS because of the use of a higher resolution grism and consequently longer spectra on the detector, which limit the degree of freedom of the slit positioning algorithm. We therefore correct for this by reproducing within the random samples the right-ascension-dependent sampling of each pointing. We model the average distribution of galaxies along the right ascension direction with a smooth function, as shown in the bottom panel of Fig. 5, and use the fitted model to distribute the galaxies in the random sample.
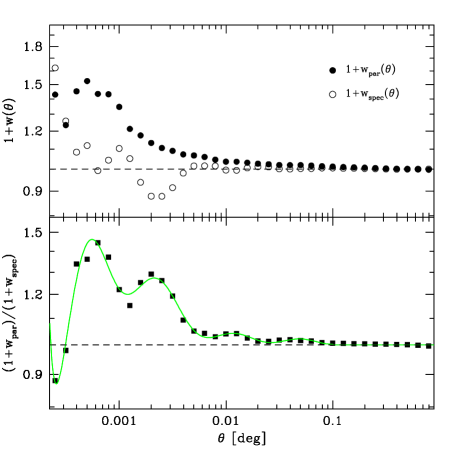
In addition, we use a pair-weighting scheme to account for the small-scale incompleteness caused by the geometrical constraints of the slit mask design (Bottini et al., 2005), which prevent VIMOS from simultaneously targeting very close objects. As shown in the upper panel of Fig. 6, in general this incompleteness affects the angular clustering on scales of , but the effect becomes significant only below . The latter angular scale corresponds to a maximum separation of Mpc at . To correct for this, we assign a weight to each galaxy-galaxy pair that accounts for the missed angular pairs. To calculate the weights, we use the information contained in the parent photometric catalogue, which is assumed to be free from angular incompleteness. We define a weighting function to be the ratio of the mean number of pairs in the parent photometric catalogue to those in the spectroscopic catalogue as a function of angular separation. This quantity can be written as (e.g. Hawkins et al., 2003),
| (4) |
where and are the angular correlation functions of the parent photometric and spectroscopic samples. We use again the Landy & Szalay (1993) estimator to compute the angular correlation functions. In the calculation of , we account for the complex angular sampling of the spectroscopic catalogue, as discussed above. We note that only the galaxy-galaxy pairs are weighted because the random sample does not have any close-pair constraints. The weighting function and the angular correlation functions of the parent photometric and spectroscopic samples are shown in Fig. 6. We compared this weighting scheme with those adopted in the parallel clustering analyses by Meneux et al. (2009) and Porciani et al. (in preparation), and found that the different estimators yield consistent results within the errors. More detailed results of this comparison are presented in Porciani et al. (in preparation).
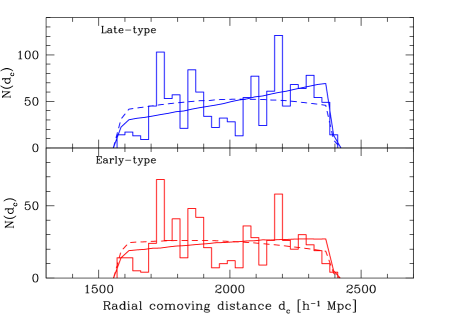
Finally, to compute , the random catalogues need also to reproduce the detailed radial selection function of the survey. Galaxies are clustered and, because the volumes probed by galaxy surveys are usually small, it is difficult to measure average quantities such as the radial distribution of objects. The subsequent variability in the measurements, usually referred to as sample variance (or cosmic variance), can significantly bias its determination (e.g. Garilli et al., 2008). One way of obtaining the radial selection function entails convolving the observed galaxy redshift distribution with a kernel of sufficiently large width to smooth out the resolved structures. The zCOSMOS-Bright sample contains a large number of structures along the line-of-sight that correspond to the multiple peaks seen in the observed radial distribution. We find that the smoothing method tends to flatten and broaden the redshift distribution in our sample. A Gaussian filter of smoothing length as large as Mpc needs to be applied to completely remove the spikes in the radial distribution. This, however distorts the shape of radial distribution as shown in Fig. 7. An alternative way of estimating the expected that we adopt here, is to use the galaxy luminosity function. For volume-limited samples, one can recover the radial distribution as
| (5) |
where is the galaxy luminosity function at redshift and is the comoving volume. In practice, to obtain , we first fitted the evolution of the measured Schechter parameters in different redshift bins by Zucca et al. (2009) with linear functions of . We then use the functions that best describe , , and to obtain at any redshift , assuming a Schechter form of the luminosity function. This method has the advantage of reducing sample variance effects in the determination of the radial distribution by smoothing out the spurious variations in the measured Schechter parameters from one redshift bin to another. The resulting predicted radial distribution using this method is also shown in Fig. 7.
3.3 Error estimation
We estimate the errors in the correlation function measurements using the blockwise bootstrap method (e.g. Porciani & Giavalisco, 2002), which provides a reliable estimate of both the statistical and sample variance errors. We verified their reliability by directly comparing with the ensemble average scatter of a set of mock samples of the survey, and chose blockwise errors because they produce a more stable covariance matrix. This internal-error estimator consists in calculating the variance in the correlation functions among a given number of realisations of the sample, consisting of a random sequence of equal-sized sub-volumes, allowing for repetitions. To define the sub-volumes and because the transverse dimension of the survey is small, we divided the sample into slices along the radial direction and constrained the radial size of each slice to be larger than times , as defined in Sect. 3.1. Therefore, for each sample, we generated realisations by bootstrapping slices of equal volume.
Norberg et al. (2009) studied the efficiency of different error estimators, showing that this particular technique enables us to robustly recover the main eigenvectors of the underlying covariance matrix and that by obtaining a large number of realisations , one can calculate variances that agree with external estimators. However, their analysis is performed by considering significantly larger volumes than the one probed by the zCOSMOS-Bright sample, which prompted us to check directly the reliability of this method for our specific survey using mock samples. We used 24 realistic mock samples of the COSMOS survey provided by Kitzbichler & White (2007) and based on the Millennium dark matter N-body simulation (Springel et al., 2005). We applied to them the detailed zCOSMOS-Bright observational strategy. For this purpose, we used SSPOC software (Bottini et al., 2005) to mimic in the mock samples, the selection of spectroscopic targets within the observed pointings. In addition, we included the same redshift success rate as the real data (see Iovino et al., 2010, for details). We find that the blockwise bootstrap method, on average, allows us to recover fairly well both the diagonal and off-diagonal terms of the covariance matrix, although the diagonal errors are slightly underestimated on large scales. This effect is however of the order of on scales between Mpc and Mpc. Details of the error analysis are presented in Meneux et al. (2009) and Porciani et al. (in preparation).
4 Results
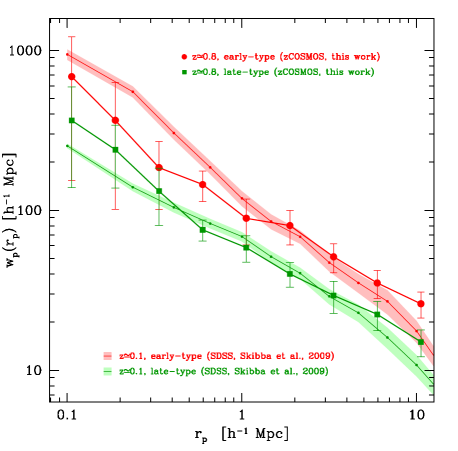
We present in Fig. 8 our measurement of the spatial clustering of early- and late-type galaxies at , showing that at this epoch, the former are already more strongly clustered than the latter. The observed segregation tends to only affect the amplitude of the projected correlation function on all probed scales, corresponding to an almost scale-independent relative clustering of early- to late-type galaxies that we discuss in Sect. 4.2. We compare our measurements with those obtained by Skibba et al. (2009) at in the Sloan Digital Sky Survey Data Release 6 (SDSS, Adelman-McCarthy et al., 2008) and based on visually classified morphologies from the Galaxy Zoo sample (Lintott et al., 2008). We overplot in Fig. 8 the measurements they obtained for early and late morphological types (defined as and respectively, see Skibba et al., 2009), with absolute magnitudes of . This magnitude cut selects galaxies with luminosity above at (Blanton et al., 2003), making these local measurements comparable with ours. However, we cannot make a fully quantitative comparison as the sample selection and morphological classifications are not exactly the same. Comparison of the correlation function shapes shows some indications of an increase with cosmic time in the relative difference in clustering between early and late morphological classes for separations smaller than a few Mpc, although error bars are relatively large on these scales in our sample.
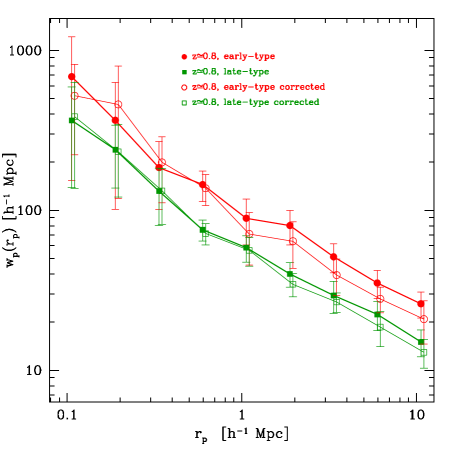
4.1 Effect of the overabundance of high-density regions in the COSMOS field
In the measurements of Fig. 8, the shape of the projected correlation function at Mpc, for both early- and late-type galaxies, is flatter than that for the SDSS, with approximately . Such behaviour was also noticed in previous analysis of the zCOSMOS-Bright data, based on luminosity- and stellar mass-selected samples (Meneux et al., 2009) and has been recently explained as being due to an overabundance of rich structures in the field, in particular at (de la Torre et al., 2010). This is quantified by an excess of galaxies in the high-density tail of the overdensity probability distribution function (PDF) of the sample, which is responsible for an enhancement of the clustering signal on scales above Mpc. de la Torre et al. (2010) find that simply removing galaxies inhabiting the 10% densest environments brings the shape of back into agreement with current model predictions and other datasets (Meneux et al., 2008, 2009). We explore the significance of this effect in our morphologically-selected samples performing exactly the same operation here. The resulting are shown as empty symbols in Fig. 9. This procedure reduces the amplitude of on large scales, although the result is less dramatic than in the full sample (de la Torre et al., 2010), and allows us to obtained better-behaved shapes on these scales.
4.2 Relative clustering of early- to late-type galaxies
The observed relative clustering between different galaxy types can provide us with valuable information on the properties of the galaxy formation bias (e.g. Narayanan, Berlind, & Weinberg, 2000). In general, local biasing models predict constant scale-independent relative clustering on large scales (Coles, 1993; Fry & Gaztanaga, 1993; Mann, Peacock, & Heavens, 1998; Scherrer & Weinberg, 1998; Narayanan, Berlind, & Weinberg, 2000). This prediction remains in any model where the galaxy type is correlated with the local density. We note that here “local” refers to scales over which material in non-linear structures has mixed during the cosmic history. This behaviour disagrees with models of non-local bias in which, for instance, the galaxy formation efficiency is coherently modulated over large scales because of ionising radiation (Bower et al., 1993) or suppressed in randomly distributed voids (Babul & White, 1991). In these models, the large-scale relative clustering is expected to be scale-dependent (Narayanan, Berlind, & Weinberg, 2000).
| selection | reference | |||
|---|---|---|---|---|
| 0.8 | this work | |||
| 0.1 | [1] Skibba et al. (2009) | |||
| [2] Willmer, da Costa, & Pellegrini (1998) | ||||
| [3] Guzzo et al. (1997) | ||||
| [4] Loveday et al. (1995) |
For references [2], [3], and [4], the large-scale relative bias is calculated from the power-law best-fits to the of elliptical/S0 (early-type) and spiral (late-type) galaxies; errors are obtained by propagating errors in the individual power-law parameters.
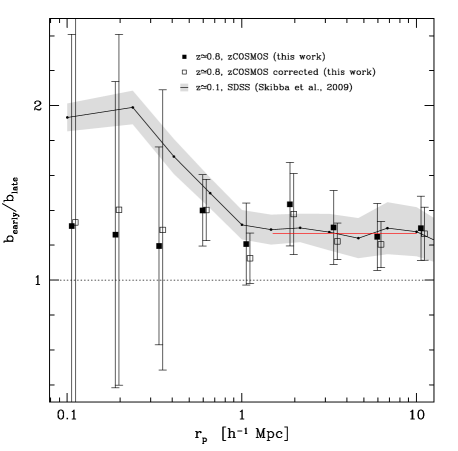
Figure 10 shows the relative clustering (or relative bias) of early- to late-type galaxies in the range Mpc obtained in our sample and from SDSS measurements as
| (6) |
where and ( and ) correspond respectively to the projected correlation function and the bias of early-type (late-type) galaxies with respect to the mass; is the projected correlation function of mass. At , the relative bias shows a scale-dependence in the regime where clustering is non-linear, i.e. on small scales, but tends asymptotically to a constant value on larger scales. It varies from at Mpc to at Mpc, confirming previously reported clustering measurements in the local Universe (Loveday et al., 1995; Hermit et al., 1996; Guzzo et al., 1997; Willmer, da Costa, & Pellegrini, 1998). The observed large-scale behaviour of the relative bias then supports a locally biased galaxy formation scenario, in which the definition of early and late morphological types may be directly or indirectly related to the local environment. Moreover the large value of the relative bias on small scales, i.e. below 1 Mpc, suggests that a fraction of early-type galaxies formed recently and preferentially in dense environments. At , in contrast, the scale dependence is much less important or absent. These results may indicate that a fraction of early-type galaxies may have formed at epochs later than by the merging of late-type galaxies (perhaps through major mergers), in relatively dense environments.
From the relative bias of early- to late-type galaxies, we derived the large-scale linear relative bias by averaging on scales of Mpc. Our measurement, corrected for the effect of the excess of rich structures in the field, is reported in Table LABEL:breltab where it is compared with measurements. Interestingly, we find in our sample a value of similar to that measured in the local samples and in particular in the SDSS. This finding suggests that most of the dependence of galaxy clustering on morphology was already in place at for galaxies.
5 Summary and discussion
We have measured the dependence of clustering on morphology at for galaxies of luminosity greater than . For this purpose, we have used the first epoch zCOSMOS-Bright spectroscopic sample of galaxies, our study benefiting from the availability of high resolution HST imaging for the COSMOS field. We have computed the projected correlations function in volume-limited samples of two broad morphological classes, early types (elliptical/S0) and late types (spiral/irregular) and have compared them to SDSS measurements. Our two main results can be summarised as follows:
-
1.
We find that at , early-type galaxies exhibit a stronger clustering strength than late-type galaxies on scales from Mpc to Mpc.
-
2.
Comparing our results to those for the SDSS for galaxies with comparable luminosities, shows that while the relative difference in clustering between early and late morphological classes seems to increase with cosmic time on scales smaller than a few Mpc, the large-scale difference does not evolve significantly since . This indicates that a large fraction of early-type galaxies were already formed in intermediate and dense environments at this epoch.
The observed difference in shape of the correlation function that we observe for early- and late-type galaxies, can be interpreted within the framework of halo occupation distribution models (e.g. Cooray & Sheth, 2002). In these models, the galaxy correlation function is the sum of two contributions, one dominating the small scales that characterises the clustering of galaxies inside haloes (1-halo term), and a large-scale contribution, which characterises the clustering of galaxies belonging to different haloes (2-halo term). The prominence of the 1-halo term observed for early-type galaxies, i.e. the enhancement of the observed correlation function on scales smaller than or of the order of the typical halo radius ( Mpc), implies that these galaxies are on average hosted by massive haloes with larger virial radii in dense environments (Abbas & Sheth, 2006). The weaker but steeper 1-halo term of late-type galaxies indicates that these galaxies instead may be hosted on average by less massive haloes inhabiting low-density environments. This trend is qualitatively consistent with measurements of the clustering of red and blue galaxies, that dominate respectively the early- and late-type populations (e.g. Zehavi et al., 2005; Skibba & Sheth, 2009).
Our work is complementary to those of Tasca et al. (2009) and Kovač et al. (2010) who study within the same sample, the evolution of the fraction of early and late morphological types with environment, as defined either by the continuous overdensity field or group/field environments, respectively. The measurements presented here are consistent with the picture emerging from these works. In particular, Tasca et al. (2009) observed a flattening in the morphology-density relation with increasing redshift at fixed luminosity, extending to morphology similar evolutionary trends observed in the colour- and spectral-type-density relations (Cucciati et al., 2006; Cooper et al., 2006; Grützbauch et al., 2010). The finding that early- and late-type galaxies tend to have increasingly similar probabilities of populating high-density/group and low-density/field environments with increasing redshift, is qualitatively consistent with the evolution in the morphological dependence of clustering discussed here, where we find a corresponding decrease in the relative small-scale clustering of early- to late-type galaxies. The mass and environmental physical processes play an important role in shaping the morphology-density relation and its evolution with cosmic time (e.g. Kovač et al., 2010). It is found that mass has a dominant contribution at in particular for relatively bright luminosity-selected sample (Tasca et al., 2009). In contrast, in the local Universe, one finds that only a part of this relation can be attributed to the variation in the stellar-mass function with environment, with the dense environment-related processes becoming more important (Bamford et al., 2009). Our results corroborate this evolutionary picture. While the large-scale shape of the relative bias has remained constant since , the small-scale shape exhibits a significant evolution. This is due to an increase in the number of small-scale early-type pairs with cosmic time, as a result of that of the relative contribution of environmental physical processes in transforming early- to late-type galaxies, especially in dense environments.
Acknowledgments
We acknowledge the anonymous referee for his careful review of the paper and helpful suggestions. Financial support from INAF and ASI through grants PRIN-INAF-2007 and ASI/COFIS/WP3110 I/026/07/0 is gratefully acknowledged. JDS is supported by World Premier International Research Center Initiative (WPI Initiative), MEXT, Japan.
This work is based on observations undertaken at the European Southern Observatory (ESO) Very Large Telescope (VLT) under Large Program 175.A-0839 and also on observations with the NASA/ESA Hubble Space Telescope, obtained at the Space Telescope Science Institute, operated by the Association of Universities for Research in Astronomy, Inc. (AURA), under NASA contract NAS 5Y26555, with the Subaru Telescope, operated by the National Astronomical Observatory of Japan, with the telescopes of the National Optical Astronomy Observatory, operated by the Association of Universities for Research in Astronomy, Inc. (AURA), under cooperative agreement with the National Science Foundation, and with the Canada-France- Hawaii Telescope, operated by the National Research Council of Canada, the Centre National de la Recherche Scientifique de France, and the University of Hawaii.
References
- Abbas & Sheth (2006) Abbas U., Sheth R. K., 2006, MNRAS, 372, 1749
- Abbas & Sheth (2007) Abbas U., Sheth R. K., 2007, MNRAS, 378, 641
- Abraham et al. (1996) Abraham R. G., van den Bergh S., Glazebrook K., Ellis R. S., Santiago B. X., Surma P., Griffiths R. E., 1996, ApJS, 107, 1
- Abraham, van den Bergh, & Nair (2003) Abraham R. G., van den Bergh S., Nair P., 2003, ApJ, 588, 218
- Adelman-McCarthy et al. (2008) Adelman-McCarthy J. K., et al., 2008, ApJS, 175, 297
- Babul & White (1991) Babul A., White S. D. M., 1991, MNRAS, 253, 31P
- Bamford et al. (2009) Bamford S. P., et al., 2009, MNRAS, 393, 1324
- Benoist et al. (1996) Benoist C., Maurogordato S., da Costa L. N., Cappi A., Schaeffer R., 1996, ApJ, 472, 452
- Blanton et al. (2003) Blanton M. R., et al., 2003, ApJ, 592, 819
- Bottini et al. (2005) Bottini D., et al., 2005, PASP, 117, 996
- Bower et al. (1993) Bower R. G., Coles P., Frenk C. S., White S. D. M., 1993, ApJ, 405, 403
- Brinchmann et al. (1998) Brinchmann J., et al., 1998, ApJ, 499, 112
- Capak et al. (2007) Capak P., et al., 2007, ApJS, 172, 99
- Coil et al. (2004) Coil A. L., et al., 2004, ApJ, 609, 525
- Coil et al. (2008) Coil A. L., et al., 2008, ApJ, 672, 153
- Coles (1993) Coles P., 1993, MNRAS, 262, 1065
- Cooper et al. (2006) Cooper M. C., et al., 2006, MNRAS, 370, 198
- Cooray & Sheth (2002) Cooray A., Sheth R., 2002, PhR, 372, 1
- Cucciati et al. (2006) Cucciati O., et al., 2006, A&A, 458, 39
- Davis & Geller (1976) Davis M., Geller M. J., 1976, ApJ, 208, 13
- Davis et al. (1988) Davis M., Meiksin A., Strauss M. A., da Costa L. N., Yahil A., 1988, ApJ, 333, L9
- de la Torre et al. (2007) de la Torre S., et al., 2007, A&A, 475, 443
- de la Torre et al. (2010) de la Torre S., et al., 2010, MNRAS, 1322
- de Ravel et al. (2009) de Ravel L., et al., 2009, A&A, 498, 379
- Dressler (1980) Dressler A., 1980, ApJ, 236, 351
- Ellison et al. (2010) Ellison S. L., Patton D. R., Simard L., McConnachie A. W., Baldry I. K., Mendel J. T., 2010, MNRAS, 407, 1514
- Fisher et al. (1994) Fisher K. B., Davis M., Strauss M. A., Yahil A., Huchra J. P., 1994, MNRAS, 267, 927
- Fry & Gaztanaga (1993) Fry J. N., Gaztanaga E., 1993, ApJ, 413, 447
- Garilli et al. (2008) Garilli B., et al., 2008, A&A, 486, 683
- Giovanelli, Haynes, & Chincarini (1986) Giovanelli R., Haynes M. P., Chincarini G. L., 1986, ApJ, 300, 77
- Grützbauch et al. (2010) Grützbauch R., Conselice C. J., Varela J., Bundy K., Cooper M. C., Skibba R., Willmer C. N. A., 2010, MNRAS, in press
- Guzzo et al. (1997) Guzzo L., Strauss M. A., Fisher K. B., Giovanelli R., Haynes M. P., 1997, ApJ, 489, 37
- Guzzo et al. (2000) Guzzo L., et al., 2000, A&A, 355, 1
- Hamilton (1988) Hamilton A. J. S., 1988, ApJ, 331, L59
- Hawkins et al. (2003) Hawkins E., et al., 2003, MNRAS, 346, 78
- Hermit et al. (1996) Hermit S., Santiago B. X., Lahav O., Strauss M. A., Davis M., Dressler A., Huchra J. P., 1996, MNRAS, 283, 709
- Ilbert et al. (2009) Ilbert O., et al., 2009, ApJ, 690, 1236
- Iovino et al. (1993) Iovino A., Giovanelli R., Haynes M., Chincarini G., Guzzo L., 1993, MNRAS, 265, 21
- Iovino et al. (2010) Iovino A., et al., 2010, A&A, 509, A40
- Kitzbichler & White (2007) Kitzbichler M. G., White S. D. M., 2007, MNRAS, 376, 2
- Koekemoer et al. (2007) Koekemoer A. M., et al., 2007, ApJS, 172, 196
- Kovač et al. (2010) Kovač K., et al., 2010, ApJ, 718, 86
- Landy & Szalay (1993) Landy S. D., Szalay A. S., 1993, ApJ, 412, 64
- Le Fèvre et al. (2003) Le Fèvre O., et al., 2003, SPIE, 4834, 173
- Le Fèvre et al. (2005) Le Fèvre O., et al., 2005, A&A, 439, 877
- Leauthaud et al. (2007) Leauthaud A., et al., 2007, ApJS, 172, 219
- Li et al. (2006) Li C., Kauffmann G., Jing Y. P., White S. D. M., Börner G., Cheng F. Z., 2006, MNRAS, 368, 21
- Lilly et al. (1996) Lilly S. J., Le Fèvre O., Hammer F., Crampton D., 1996, ApJ, 460, L1
- Lilly et al. (2007) Lilly S. J., et al., 2007, ApJS, 172, 70
- Lilly et al. (2009) Lilly S. J., et al., 2009, ApJS, 184, 218
- Lintott et al. (2008) Lintott C. J., et al., 2008, MNRAS, 389, 1179
- Lotz, Primack, & Madau (2004) Lotz J. M., Primack J., Madau P., 2004, AJ, 128, 163
- Loveday et al. (1995) Loveday J., Maddox S. J., Efstathiou G., Peterson B. A., 1995, ApJ, 442, 457
- Loveday, Tresse, & Maddox (1999) Loveday J., Tresse L., Maddox S., 1999, MNRAS, 310, 281
- Madgwick et al. (2003) Madgwick D. S., et al., 2003, MNRAS, 344, 847
- Mann, Peacock, & Heavens (1998) Mann R. G., Peacock J. A., Heavens A. F., 1998, MNRAS, 293, 209
- McCracken et al. (2008) McCracken H. J., Ilbert O., Mellier Y., Bertin E., Guzzo L., Arnouts S., Le Fèvre O., Zamorani G., 2008, A&A, 479, 321
- Meneux et al. (2006) Meneux B., et al., 2006, A&A, 452, 387
- Meneux et al. (2008) Meneux B., et al., 2008, A&A, 478, 299
- Meneux et al. (2009) Meneux B., et al., 2009, A&A, 505, 463
- Mo & White (1996) Mo H. J., White S. D. M., 1996, MNRAS, 282, 347
- Narayanan, Berlind, & Weinberg (2000) Narayanan V. K., Berlind A. A., Weinberg D. H., 2000, ApJ, 528, 1
- Norberg et al. (2001) Norberg P., et al., 2001, MNRAS, 328, 64
- Norberg et al. (2002) Norberg P., et al., 2002, MNRAS, 332, 827
- Norberg et al. (2009) Norberg P., Baugh C. M., Gaztañaga E., Croton D. J., 2009, MNRAS, 396, 19
- Park et al. (1994) Park C., Vogeley M. S., Geller M. J., Huchra J. P., 1994, ApJ, 431, 569
- Peebles (1980) Peebles P. J. E., 1980, The Large-Scale Structure of the Universe. Princeton University Press, Princeton, NJ, p. 435
- Pollo et al. (2005) Pollo A., et al., 2005, A&A, 439, 887
- Pollo et al. (2006) Pollo A., et al., 2006, A&A, 451, 409
- Porciani & Giavalisco (2002) Porciani C., Giavalisco M., 2002, ApJ, 565, 24
- Postman & Geller (1984) Postman M., Geller M. J., 1984, ApJ, 281, 95
- Scherrer & Weinberg (1998) Scherrer R. J., Weinberg D. H., 1998, ApJ, 504, 607
- Scoville et al. (2007) Scoville N., et al., 2007, ApJS, 172, 1
- Sheth & Tormen (2002) Sheth R. K., Tormen G., 2002, MNRAS, 329, 61
- Skibba & Sheth (2009) Skibba R. A., Sheth R. K., 2009, MNRAS, 392, 1080
- Skibba et al. (2006) Skibba R., Sheth R. K., Connolly A. J., Scranton R., 2006, MNRAS, 369, 68
- Skibba et al. (2009) Skibba R. A., et al., 2009, MNRAS, 399, 966
- Springel et al. (2005) Springel V., et al., 2005, Natur, 435, 629
- Swanson et al. (2008) Swanson M. E. C., Tegmark M., Blanton M., Zehavi I., 2008, MNRAS, 385, 1635
- Tasca et al. (2009) Tasca L. A. M., et al., 2009, A&A, 503, 379
- Wang et al. (2007) Wang L., Li C., Kauffmann G., De Lucia G., 2007, MNRAS, 377, 1419
- White et al. (1987) White S. D. M., Frenk C. S., Davis M., Efstathiou G., 1987, ApJ, 313, 505
- White, Tully, & Davis (1988) White S. D. M., Tully R. B., Davis M., 1988, ApJ, 333, L45
- Willmer, da Costa, & Pellegrini (1998) Willmer C. N. A., da Costa L. N., Pellegrini P. S., 1998, AJ, 115, 869
- Zehavi et al. (2002) Zehavi I., et al., 2002, ApJ, 571, 172
- Zehavi et al. (2005) Zehavi I., et al., 2005, ApJ, 630, 1
- Zucca et al. (2006) Zucca E., et al., 2006, A&A, 455, 879
- Zucca et al. (2009) Zucca E., et al., 2009, A&A, 508, 1217