Solving the large discrepancy between inclusive and exclusive measurements of the reaction cross section at astrophysical energies
Abstract
A solution of the large discrepancy existing between inclusive and exclusive measurements of the reaction cross section at MeV is evaluated. This problem has profound astrophysical relevance for this reaction is of great interest in Big-Bang and r-process nucleosynthesis. By means of a novel technique, a comprehensive study of all existing cross section data is carried out, setting up a consistent picture in which all the inclusive measurements provide the reliable value of the cross section. New unambiguous signatures of the strong branch pattern non-uniformities, near the threshold of higher excited levels, are presented and their possible origin, in terms of the cluster structure of the involved excited states of and nuclei, is discussed.
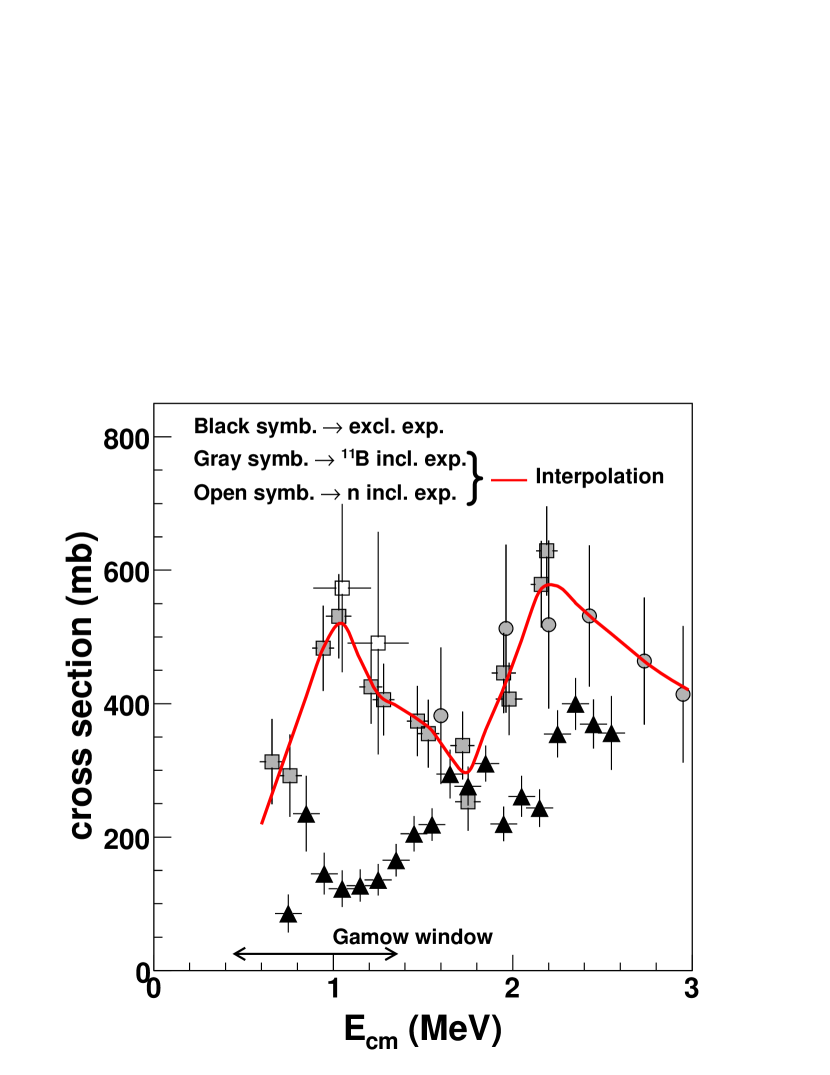
Recently, the total disagreement between inclusive measurements of the 8Li+4HeB+ reaction cross section and exclusive ones at kinetic energy in the centre-of-mass system MeV has been pointed out (La Cognata et al., 2008). The case is illustrated in Fig.1. The complementary neutron inclusive (La Cognata et al., 2008) and 11B inclusive (Boyd et al., 1992; Gu et al., 1995) measurements give comparable values of the reaction cross section. Instead, the exclusive approach (Ishiyama et al., 2006), where 11B-n coincidences were measured, gives cross-section values which, with the exception of a narrow region around MeV, are generally smaller by a factor with respect to the inclusive ones.
The largest discrepancy among the data in Fig.1 is observed right at energies of astrophysical interest MeV. The measurements at such energies explore the Gamow window of the 8Li+4HeB+ reaction at temperatures K, of great interest in primordial as well as in other relevant nucleosynthesis sites, in particular core-collapse supernovae and neutron-star mergers. Within the frame of the inhomogeneous Big Bang model, still representing a viable possibility for the early universe (Lara et al., 2006; Malaney & Fowler, 1988; Kajino & Boyd, 1990; Rauscher et al., 2007), this reaction could have allowed to overcome the A=8 mass gap, thus providing a possible explanation for the experimental observation of a non-negligible abundance of heavy elements in the oldest astrophysical objects (Matsuura et al. (2005) and Refs. therein). The magnitude of the cross section is the key information to check the reliability of these predictions. The 8Li+4HeB+ reaction also plays an important role in the context of the r-process nucleosynthesis (Sasaqui et al., 2006; Terasawa et al., 2001). Currently, the most popular scenario is neutrino-driven winds from Type II SNe. Anyway, possibility remains that it could be associated with neutron-star mergers or gamma-ray bursts, in which the required neutron-rich conditions can also be realized. Therefore, it is of critical importance to constrain the parameter space for the r-process to restrict possible environments. Sasaqui et al. (2006) found that the 8Li+4HeB+ reaction leads to a more efficient production of seed nuclei, so that a larger neutron/seed ratio is required for a successful r-process. This, in turn, allows to constrain the entropy per baryon and the astrophysical site for production of r-process nuclei.
In this Letter, we conclude that inclusive measurements provide the most reliable estimate of the cross section.
For the 8Li+4HeB+ reaction involves the unstable 8Li nucleus ( ms), the scope of measurements with present-day facilities is the cross section summed over all 11B+ni branches,
| (1) |
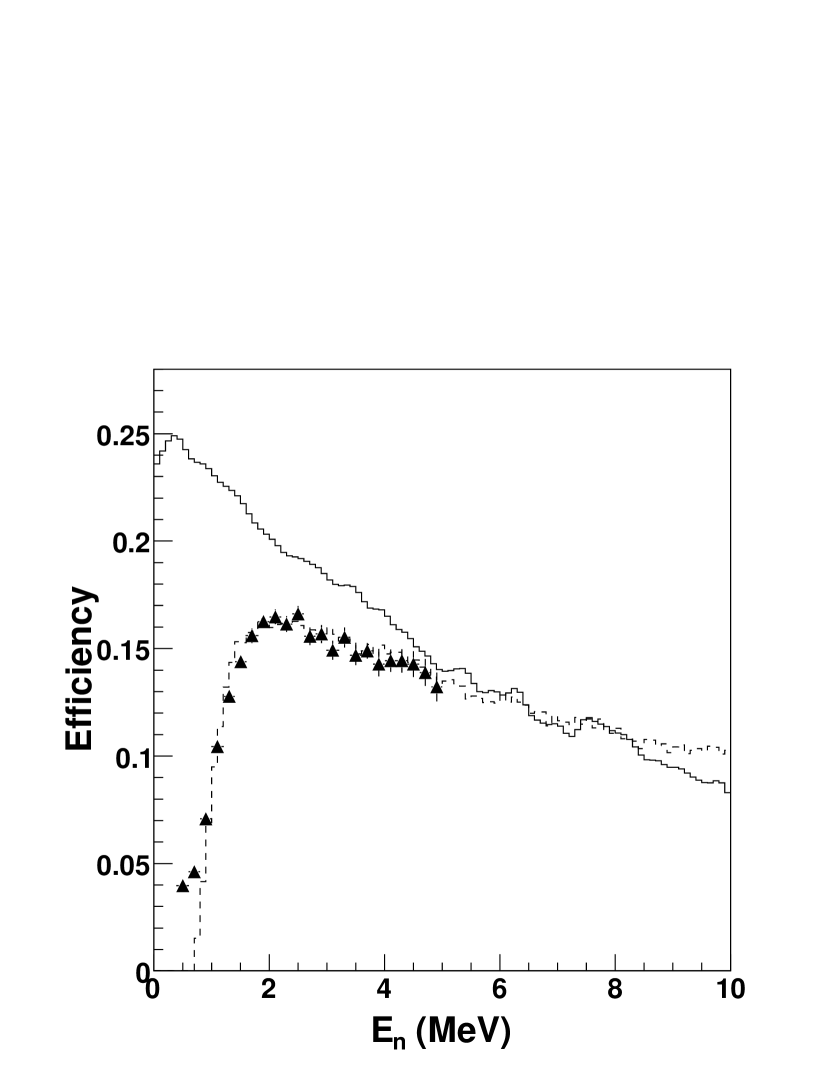
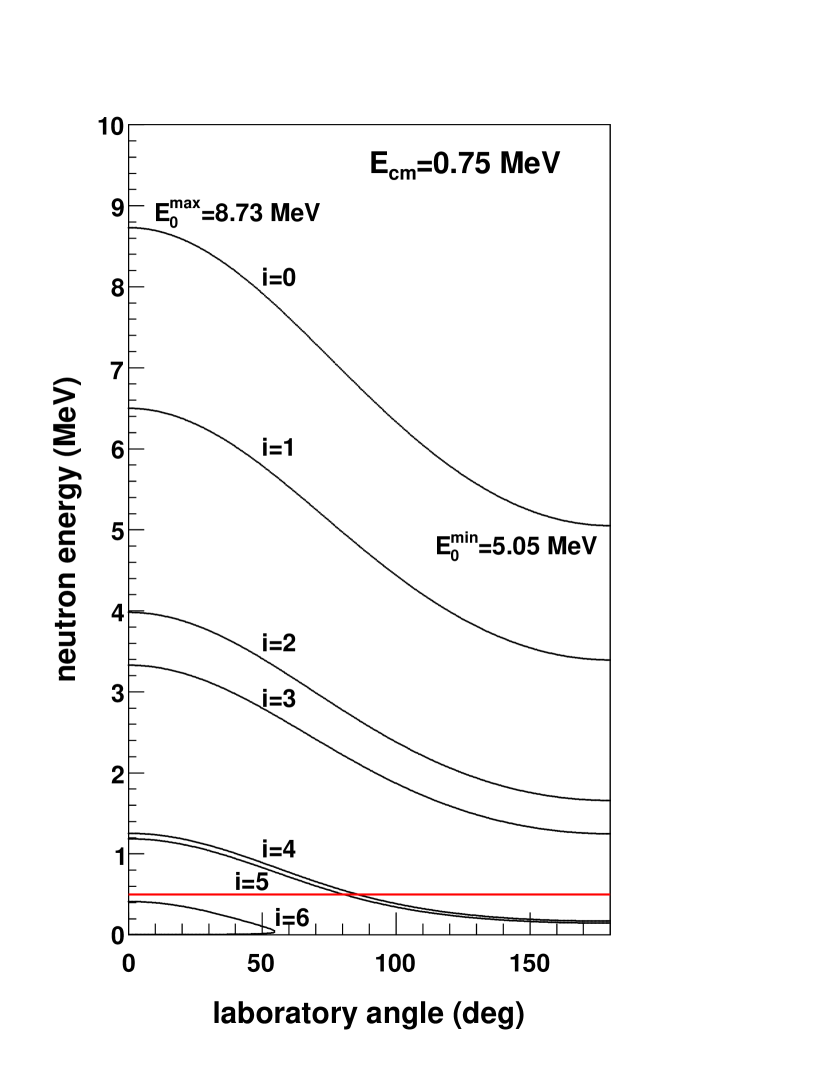
denoting the energetically open highest branch at a given ( being the branch leading to 11B ground state). The involved reaction branches, identified by the 11B level sequence in Ishiyama et al. (2006), are listed in Tab.1. Examining possible error sources that might spoil cross section measurements, the number of detected particles N, of impinging projectiles Nproj, of target nuclei per unit surface Ntar, and the detection efficiencies contribute to the overall uncertainty. Background might illusorily enhance the reaction yields N of inclusive measurements (Boyd et al., 1992; Gu et al., 1995; La Cognata et al., 2008). However, they were performed by measuring completely different ejectiles (11B or neutron), thus different sources of background are expected. Therefore, the agreement between them make us confident that the possible background contribution stays below the uncertainty ranges in Fig.1. We also underscore that each of inclusive (Boyd et al., 1992; Gu et al., 1995) and exclusive (Ishiyama et al., 2006) data sets has been measured in a single irradiation, thus any error in their evaluation attributable to Ntar and/or Nproj only could lead to a rigid vertical displacement of one excitation function with respect to the others, excluded by Fig.1. Indeed, concordant inclusive (Boyd et al., 1992; Gu et al., 1995) and exclusive (Ishiyama et al., 2006) cross section measurements at E MeV (see Fig.1) rule out significant errors on both Ntar and Nproj. Even supposing the concurrence of equally oriented systematic uncertainties on N, Ntar and Nproj it is not possible to explain the magnitude of the discrepancy and its dependence on . The most likely candidate source of error is then represented by the neutron detection efficiency in the exclusive measurement (Ishiyama et al., 2006). Indeed, in comparison to 11B inclusive measurements (Boyd et al., 1992; Gu et al., 1995), the sensitivity to reaction events in the exclusive measurements (Ishiyama et al., 2006) was governed by the neutron counter. In comparison to neutron inclusive measurements (La Cognata et al., 2008) a substantially different type of neutron detector was used in Ishiyama et al. (2006). As shown in Fig.2, the thermalization counter used in La Cognata et al. (2008) is a zero-energy-threshold detector, its detection efficiency staying at a significant level down to thermal energies. Instead, the plastic scintillator array in Ishiyama et al. (2006) shows a steep drop in detection efficiency with decreasing neutron energy below 2 MeV with a seeming cut at MeV. The occurrence of such a detection threshold plays a critical role in the measurement of the total cross section according to Eq.1. With this respect, we consider the calculated kinematical diagram for the 11B final states of the 8Li+4HeB+ reaction at MeV, shown in Fig.3. In this plot, with the cut at 0.5 MeV in the neutron energy spectrum, the reaction branch is experimentally unaccessible. In such a situation the exclusive experiment (Ishiyama et al., 2006) could not provide the wanted cross sections summed over all 11B final states. Moreover, with the information available in Ishiyama et al. (2006); Hashimoto et al. (2006) we have performed Monte Carlo simulations by implementing the detector set-up in Ishiyama et al. (2006); Hashimoto et al. (2006) into a GEANT code as described in Celano et al. (1997). Excellent agreement with the bulk of the experimental efficiency curve is obtained by the dashed histogram in Fig.2. This shows a steep drop below 2 MeV, very similar to a sharp detection cut-off, characterized by the effective half-drop energy threshold MeV. With reference to Fig.3, a cut-off of about 1 MeV would make unaccessible the branches besides the reaction branch. Quantitatively, the more favored the associated branching ratios the larger is the missing cross section in the exclusive experiment. It should be noted that the case MeV illustrated in Fig.3 is in the hearth of the Gamow window for Big Bang nucleosynthesis.
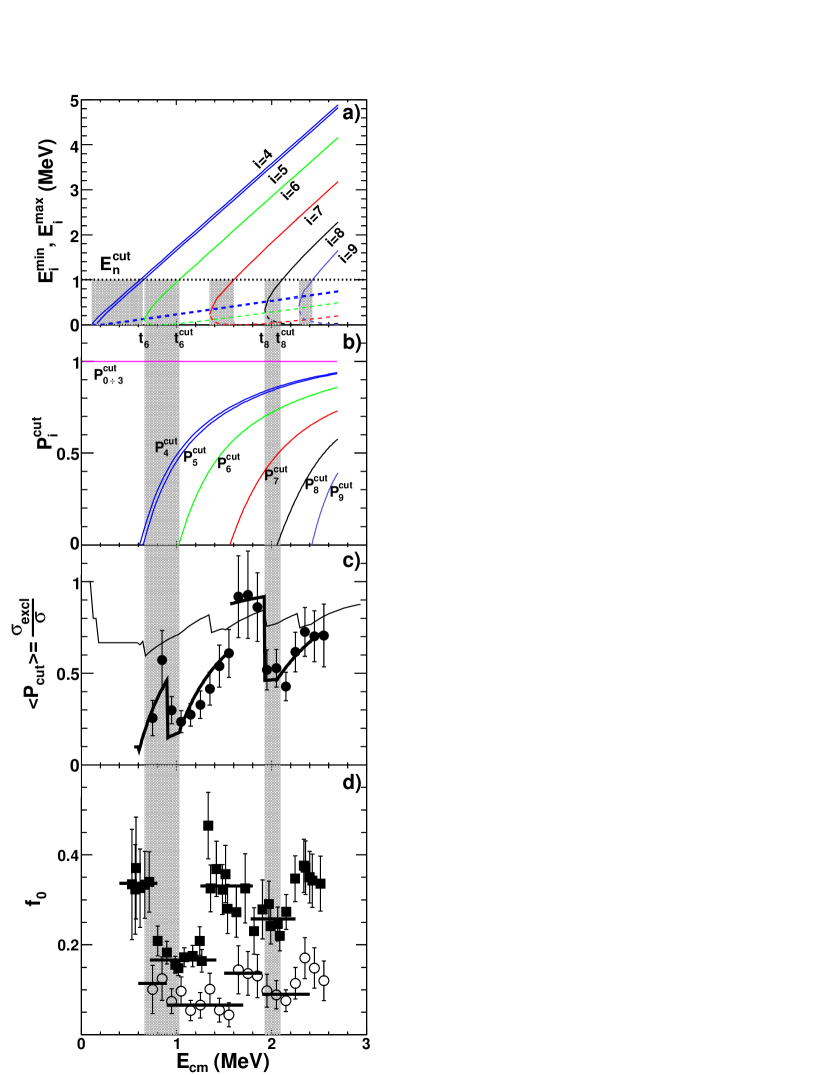
The laboratory reaction neutron kinematics is summarized in Fig.4a as a function of . For each reaction branch, at a fixed , the laboratory neutron energy ranges between the minimum (dashed) and the maximum (solid) curves. Assuming MeV, we have calculated the values at which crosses such level (dashed black line in Fig.4a). These are given in Tab.1 together with the corresponding set of reaction threshold energies at which a branch starts to be potentially active, fixed by the corresponding reaction Q-values. Each couple singles out a kinematic region where the observation of the corresponding th branch is completely missed, because the corresponding laboratory neutron energies stay below the experimental threshold. These intervals are emphasized by shaded bands in Fig.4a. Inside each shaded interval, no efficiency correction can by any means be performed for the corresponding completely missed branch.
Whenever falls outside the shaded region of an open branch this becomes partially observable and its missed portion is recoverable, only provided that the observed portion is corrected by the appropriate value of its observability factor . For each reaction branch, this is defined as the observable portion of the laboratory neutron energy distribution characterized by .
Consequently, in the exclusive measurements (Ishiyama et al., 2006), the excitation function, i.e. the cross section versus , can be corrected at some -values, but remains necessarily uncorrected at some other values, right inside each shaded interval, where the of the corresponding reaction branch equals zero.
Conversely, the zero-energy detection threshold inclusive measurements (Boyd et al., 1992; Gu et al., 1995; La Cognata et al., 2008) do measure the wanted cross section in the whole investigated range of . Accordingly, we write
| (2) |
where the factors are the unknown branching ratios as functions of . In Eq.2, is the weighted linear interpolation of all inclusive cross section data (La Cognata et al., 2008; Boyd et al., 1992; Gu et al., 1995) within 0.1 MeV bins, represented by the curve in Fig.1.
On the other hand, in the case of the exclusive measurements (Ishiyama et al., 2006) the detection efficiencies must incorporate the observability factor of the corresponding branch versus . Assuming isotropic neutron emission in the centre-of-mass system, following the measurements in Ishiyama et al. (2006), we have calculated the values for different . The results for MeV are displayed in Fig.4b. We remark that with the higher threshold MeV suggested by Fig.2 the portions of missed events in the exclusive experiment by Ishiyama et al. (2006), and hence the corrections, are much larger than those corresponding to the seeming cut of 0.5 MeV so that data have remained essentially uncorrected in Ishiyama et al. (2006). Accordingly, the experimental cross section reported in Ishiyama et al. (2006) can be written as
| (3) | |||
| (4) |
being the average of the observability factors weighted by the branching ratios. Eqs.3-4 not only clarify the primary role played by the experimental threshold through the factors , but also the fundamental concurrent role played by branching ratios. Indeed, we underscore that if all , no matter the branching ratio pattern because and, consequently, . Conversely, if at least one of the is significantly smaller than one underestimates , the more favored the feeding of a (partially) missed branch, the larger the deviation of from . With reference to the case in Fig.3, this effect is more significant when reaction branches involving large 11B excitation energies come into play, their observation being extremely sensitive to the neutron threshold energy . Clearly, the deviations of from are entirely described by . Accordingly, from Eq.3, we have deduced the experimental of the exclusive measurement (Ishiyama et al., 2006) as , the errors of the interpolated being appropriately propagated. It is shown in Fig.4c versus and confirms that the largest deviations between and occur right in correspondence of the shaded bands, forming a marked saw-tooth-like behavior with two apparent falls corresponding to the opening of the and branches.
To describe such a rise-and-fall behavior, a simple recurrence formula can be used, following immediately from Eq.4:
| (5) |
where and denote near-threshold values on the left and right side of , respectively. The two terms on the right side govern the magnitude of each fall and of the following rise, respectively.
As a reference case, in Fig.4c we show the calculated according to Eq.4 for the uniform branch pattern (thin solid line). The energetically open ’s are assumed constant in each interval and the in Fig.4b, evaluated for MeV, are used in the calculation. In this case, falls of occur at the successive opening of each of the reaction branches because the threshold on the neutron energy makes each of them experimentally unaccessible inside the corresponding interval. Strikingly, not only the falls in the experimental recall this type of discontinuity but, in addition, we can conclude that in the experiment the and branches strongly deviate from an uniform pattern.
Because of the normalization to 1, when the and branches strongly add up, correspondingly strong falls should be observable by examining the population of all the lower-i active branches. Indeed, this is what we have found in the trend of the experimental values as a function of , as it is clearly demonstrated in Fig.4d. This has been determined here starting both from the exclusive data (Ishiyama et al., 2006) and from the deduced from the inverse reaction in Paradellis et al. (1990). We also note that an apparent increase of in both data sets distinguishes two regions, below and above MeV, where different branch pattern regimes come presumably into play.
Accordingly, two separate fits of the experimental , for the region below and above MeV, has been performed to determine the branching ratios , using the subroutine MINUIT. Following Fig.4d, the branching ratios are assumed constant inside each interval in between two successive branch openings. Therefore, all can be treated as free fitting parameters only constrained by the normalization condition . In particular, as the factors (Fig.4b), Eq.4 becomes so that we have considered the as a single branch. Because the threshold energies and are so close (Tab.1), also the are treated as a single branch. The resulting branching ratio (and error) values are listed in Tab.1 and the associated curves are shown in Fig.4c111The sensitivity to each is the higher the steeper is the rise of the corresponding . This implies that in the region, where the slowly approach unity, the fitting procedure presumably adds small values to .. We also remark that both start energy and shape of the two rises in the experimental are extremely sensitive to . By tests performed, this fact leads to the independent determination of MeV, in agreement with the analysis of efficiency data in Fig.2. To cross check these results we evaluate the averaged over the MeV range, and compare with those given in Ishiyama et al. (2006) (Tab.1). These are linked with the true by
| (6) |
Inserting into Eq.6 the values established above results in the reported in Tab.1, the errors of and of all the being propagated accordingly. The good agreement of this comparison strongly supports the validity of Eq.2 and, therefore, the reliability of .
The physical novelty of the present Letter is the apparent selective feeding of the highest excited 11B levels, in particular of the and branches leading to the 11B levels at 7.29 and 8.56 MeV, respectively, originating the discussed non-uniformities. This peculiar trend can hardly be understood invoking selection rules only, as there does not seem to be anything unique in terms of quantum numbers about the and branches (see Table 1). Rather it seems to signal that the nuclear structure of the initial 12B* and of the final 11B* excited states plays the most important role in determining the characteristic non-uniformity of the observed branching ratios. Concerning 12B, in the excitation energy region explored here ( MeV), states with large , or 5He spectroscopic factors have recently been emphasized in the reaction. In particular, clear evidence exists for at least two states, at 10.9 and 11.6 MeV, which show significant widths (Soic et al., 2003). The relative contributions of these 12B states to the 8Li( ,n)11B reaction process are regulated by both their and partial widths. The 12B state at 10.9 MeV clearly contributes, giving rise to a resonance at MeV, as it is demonstrated by (Fig.1). The contribution of the 11.6-MeV 12B state cannot be excluded as a hump does appear right at MeV in the cross section , indicating a small -width and, therefore, a possibly complex cluster structure. Concerning 11B, a well developed 2+ cluster structure of the state at 8.56 MeV has been established very recently, whereas the other lower-lying negative-parity 11B levels are successfully described by shell-model calculations (Kawabata et al., 2007). Right below , the trend of the experimental is consistent with the one obtained for the uniform branch pattern, which suggest an at most weakly non-uniform preferential feeding of the lowest energy reaction branches. This can be likely attributed to a mismatch between initial- (cluster) and final- (single particle) state nuclear structures. Above , the enhanced relative feeding of the newly open branch, signalling a large overlap between the initial and final state wave functions, indicates a 12B cluster structure close to the 2+ one of the 8.56 MeV level of the daughter 11B nucleus (plus neutron).
The comparable reaction branch non-uniformity type established here for the branch suggests close structures of both 11B and 12B involved states. The relevant issues pointed out here call for further investigations.
In conclusion, in this Letter we have shown robust evidences that support the large values from inclusive measurements (La Cognata et al., 2008; Gu et al., 1995; Boyd et al., 1992) as representing at present the most reliable estimate of the 8Li+4HeB+ reaction cross section at astrophysical energy. The recommended value of this cross section (and the corresponding error ), following the considerations developed above, is:
| (7) | |||
| (8) |
where mb, mb/MeV, mb MeV2, mb MeV2, mb MeV2, MeV, MeV, MeV, MeV, MeV, MeV, mb, mb/MeV, mb/MeV2. The previous formula is a simple fitting of the cross-section weighted linear interpolation in Fig.1, whose accuracy is better than 5% in the whole energy range.
The original approach we have developed here can have important applications in different fields and can be extended to become an effective experimental method to extract spectroscopic information otherwise inaccessible with present-day experimental facilities. For the nuclear physics case considered here we have determined for the first time significantly non-uniform branch patterns, which are interpreted as manifesting the exotic cluster structure recently discovered in 11B (Kawabata et al., 2007) and 12B (Soic et al., 2003) excited nuclei. More importantly, this Letter strongly calls for revised calculations of the r-process nucleosynthesis. Indeed, Sasaqui et al. (2006) concluded that the entropy per baryon increases by about a factor of 2 from previous estimates in Sasaqui et al. (2005), using the cross section in Ishiyama et al. (2006). According to the present revised cross-section value of the 8Li+4HeB+ reaction, the consequent constraint on models of the r-process astrophysical site might be significantly altered, with undoubtedly interesting consequences for astrophysics. We will explore possible additional implications of this work in future studies.
References
- Boyd et al. (1992) R.N. Boyd et al., 1992, Phys. Rev. Lett. 68, 1283
- Celano et al. (1997) L. Celano et al., 1997, Nucl. Instr. Meth. A 392, 304
- Gu et al. (1995) X. Gu et al., 1995, Phys. Lett. B 343, 31
- Hashimoto et al. (2006) T. Hashimoto et al., 2006, Nucl. Instr. Meth. A 556, 339
- Ishiyama et al. (2006) H. Ishiyama et al., 2006, Phys. Lett. B 640, 82
- Kajino & Boyd (1990) T. Kajino & R. Boyd, 1990, Astrophys. J. 359, 267
- Kawabata et al. (2007) T. Kawabata et al., 2007, Phys. Lett. B 646, 6
- La Cognata et al. (2008) M. La Cognata et al., 2008, Phys. Lett. B. 664, 157
- Lara et al. (2006) J.F. Lara et al., 2006, Phys. Rev. D 73, 083501
- Malaney & Fowler (1988) R.A. Malaney & W.A. Fowler, 1988, Astrophys. J. 333, 14
- Mao et al. (1994) Z.Q. Mao et al., 1994, Nucl. Phys. A 567, 125
- Matsuura et al. (2005) S. Matsuura et al., 2005, Phys. Rev. D 72, 123505
- Paradellis et al. (1990) T. Paradellis et al., 1990, Z. Phys. A 337, 211
- Rauscher et al. (2007) T. Rauscher et al., 2007, Phys. Rev. D 75, 068301
- Sasaqui et al. (2005) T. Sasaqui et al., 2005, Astrophys. J. 634, 534
- Sasaqui et al. (2006) T. Sasaqui et al., 2006, Astrophys. J. 645, 1345
- Soic et al. (2003) N. Soic et al., 2003, Europhys. Lett. 63, 524
- Terasawa et al. (2001) M. Terasawa et al., 2001, Astrophys. J. 562, 470
| i | State in 11B | ||||||||
| Jπ, E∗ (MeV) | (MeV) | (MeV) | MeV | MeV | MeV | MeV | this work | Ref. (Ishiyama et al., 2006) | |
| 0 | 0.05 | 0.87 | 0.43 0.08 | ||||||
| 1 | |||||||||
| 2 | |||||||||
| 3 | |||||||||
| 4 | 0.11 | 0.61 | |||||||
| 5 | 0.16 | 0.65 | |||||||
| 6 | 0.66 | 1.03 | |||||||
| 7 | 1.35 | 1.60 | |||||||
| 8 | 1.93 | 2.11 | |||||||