Molecular Gas in NUclei of GAlaxies (NUGA)
XIII. The interacting Seyfert 2/LINER galaxy NGC 5953
††thanks: Based on observations
carried out with the IRAM Plateau de Bure Interferometer. IRAM is supported by the
INSU/CNRS (France), MPG (Germany), and IGN (Spain).
We present 12CO(1–0) and 12CO(2–1) maps of the interacting Seyfert 2/LINER galaxy NGC 5953 obtained with the IRAM interferometer at resolutions of 21 14 and 11 07, respectively. We also present single-dish IRAM 30 m observations of the central region of NGC 5953 for the 12CO(1–0), 12CO(2–1), and HCN(1–0) transitions at resolutions of 22″, 12″, and , respectively. The CO emission is distributed over a disk of diameter 16″(2.2 kpc), within which are several, randomly distributed peaks. The strongest peak does not coincide with the nucleus, but is instead offset from the center, 2-3′′ (340 pc) toward the west/southwest. The kinematics of the molecular component are quite regular, as is typical of a rotating disk. We also compared the 12CO distribution of NGC 5953 with observations at other wavelengths in order to study correlations between different tracers of the interstellar medium. The HST/F606W WFPC2 images show flocculent spiral structures and an “S-shape” feature 60 pc in radius, possibly associated with a nuclear bar or with the radio jet. A two-dimensional bulge/disk decomposition of the -band (HST/F160W) and 3.6 m (Spitzer/IRAC) images reveals a circumnuclear “ring” 10-14″ in diameter, roughly coincident in size with the CO disk and with a star-forming ring previously identified in ionized gas. This ring is not present in the near-infrared (NIR) color image, nor is it present in the “dust-only” image constructed from the 8 m IRAC map. The implication is that the excess residual ring is stellar, with colors similar to the surrounding disk. We interpret this ring, visible in ionized gas, which appears as stars in the NIR, and with no sign of hot dust, as due to a red super giant population at least 10–15 Myr old. However, star formation is still ongoing in the disk and in the ring itself. Using NIR images, we computed the gravity torques exerted by the stellar potential on the gas. The torques are predominantly positive in both 12CO(1–0) and 12CO(2–1), suggesting that gas is not flowing into the center, and less than 5% of the gas angular momentum is exchanged in each rotation. This comes from the regular and almost axisymmetric total mass and gas distributions in the center of the galaxy. In NGC 5953, the AGN is apparently not being actively fueled in the current epoch.
Key Words.:
galaxies: individual: NGC 5953 – galaxies: spiral – galaxies: active – galaxies: nuclei – galaxies: ISM – galaxies: kinematics and dynamics1 Introduction
Since molecular gas is the predominant phase of the interstellar medium (ISM) in the inner regions of spiral galaxies, CO lines represent an optimum tracer of nuclear gas dynamics, active galactic nuclei (AGN) fueling mechanisms, and their link with circumnuclear star formation. Although most galaxies host super massive black holes (SMBHs) and the gas accretion phenomenon is usually invoked to explain nuclear activity in galaxies, the nature of this activity is still not well known. The feeding of an AGN through accretion depends on an adequate supply of gas whose angular momentum has been reduced enough to enable inflow on the small spatial scales surrounding the BH. Angular momentum must be removed from the disk gas (e.g., Jogee 2006, and references therein), a process that can be accomplished through non-axisymmetric perturbations of internal or external origin. In the first case, they arise from disk instabilities and, in the second, from galaxy collisions, mergers, and mass accretion (Heckman et al. 1986). Either way, they usually manifest themselves as density waves, such as large-scale spirals or as bars and their gravity torques (e.g., Sakamoto et al. 1999; Combes 2001), or as more localized phenomena, including nested nuclear bars (e.g., Friedli & Martinet 1993), lopsidedness or perturbations (e.g., Shu et al. 1990; García-Burillo et al. 2000), or warped nuclear disks (e.g., Schinnerer et al. 2000a, b).
To better understand the mechanisms for gas fueling of AGN, we started a high-resolution and high-sensitivity CO survey of nearby active galaxies at the IRAM Plateau de Bure Interferometer (PdBI), the NUclei of GAlaxies (NUGA) project (García-Burillo et al. 2003). The galaxies of the NUGA sample already studied show surprising results. In fact, there is no unique circumnuclear molecular gas feature linked with nuclear activity, but instead a variety of molecular gas morphologies which characterize the inner kpc of active galaxies. These morphologies include one- and two-armed instabilities (García-Burillo et al. 2003), well-ordered rings and nuclear spirals (Combes et al. 2004; Casasola et al. 2008), circumnuclear asymmetries (Krips et al. 2005) and large-scale bars (Boone et al. 2007; Hunt et al. 2008). The analysis of the torques exerted by the stellar gravitational potential on the molecular gas of the NUGA sample has shown that the gas can be driven away from the AGN (e.g. for NGC 4321) or toward it (e.g. for NGC 2782, NGC 3147, and NGC 4579). However, the velocities observed for NUGA are too small to correspond to the AGN feedback models where violent molecular outflows and superwinds are expected (e.g Narayanan et al. 2006; Hopkins & Hernquist 2006).
The different morphologies we find are probably related to the various timescales (García-Burillo et al. 2005). Large-scale bars can transport gas inward efficiently (e.g., Combes & Gerin 1985; Sakamoto et al. 1999), and it appears that they can also drive powerful starbursts (e.g., Knapen et al. 2002; Jogee et al. 2005). Nevertheless, a clear correlation between large-scale bars and nuclear activity has not yet been found (e.g., Mulchaey & Regan 1997), probably because the timescales for bar-induced gas inflow and AGN duty cycles are very different. Bars drive inflow over timescales (300 Myr, Jogee et al. 2005) larger than those of AGN accretion-rate duty cycles (1-10 Myr, Heckman et al. 2004; Hopkins & Hernquist 2006; King & Pringle 2007), and active accretion seems to occur only intermittently over the lifetime of a galaxy (Ferrarese et al. 2001; Marecki et al. 2003; Janiuk et al. 2004; Hopkins & Hernquist 2006; King & Pringle 2007). This implies that most AGN are in an intermediate phase between active accretion episodes, making the detection of galaxies with nuclear accretion rather difficult.
Viscosity rather than self-gravity can also play a significant role in the fueling process. Viscous torques, generally weak and with timescales quite long at large radii, in combination with gravitational torques can coordinate efforts to produce recurrent episodes of activity during the typical lifetime of any galaxy (García-Burillo et al. 2005). Viscous torques can produce gas inflow on scales 100-200 pc if they act on a contrasted nuclear ring distribution and in the absence of particularly strong positive gravitational torques. In NGC 4579, the efficiency of viscosity may be comparable to the efficiency of gravity torques in the inner 50 pc (García-Burillo et al. 2009).
This paper, dedicated to the galaxy NGC 5953, is the latest of the NUGA series where results obtained for the galaxies of the sample are described on a case-by-case basis. NGC 5953 ( = 28 Mpc for = 73 km s-1Mpc-1) is an interacting galaxy (e.g., Rampazzo et al. 1995; Casasola et al. 2004; Iono et al. 2005), classified as a Seyfert 2 by Gonzalez Delgado & Perez (1996) and as a LINER by Veilleux et al. (1995), and of early and unbarred Hubble type (SAa pec). NGC 5953 and its late-type companion NGC 5954 (LINER/Seyfert 2, SAB(rs)cd pec) constitute a binary system (VV 244, Arp 91) where the two galaxies are separated by a projected distance of 5.8 kpc (43″). They show clear signs of interaction visible in the distorted morphology, the presence of a tidal bridge (or distorted arm) connecting the two galaxies, and of prominent star-forming regions. Both galaxies have circumnuclear starbursts that may have been induced by the interaction (Gonzalez Delgado & Perez 1996).
NGC 5953 hosts a compact radio core and jet, revealed by high-resolution radio continuum observations with MERLIN (Krips et al. 2007a). The jet is resolved at 18 cm, and after beam deconvolution is roughly 03 in length (40 pc), with a position angle (PA) of 10∘. The small-scale radio continuum structure at 20 cm is similar in orientation, but with lower spatial resolution (15), slightly more toward the east, PA25∘ (Jenkins 1984). This jet-like elongation as seen at lower resolution was first referred to as a “jet” by Gonzalez Delgado & Perez (1996) because it is roughly aligned with the structure in the “excitation map”, obtained by dividing [Oiii] emission by H.
The NGC 5953/54 pair has also been mapped in atomic and molecular gas. Both galaxies are embedded in a common Hi envelope, with a clear velocity gradient along the Hi plume extending more than 8 kpc to the northwest (Chengalur et al. 1994; Iono et al. 2005; Haan et al. 2007, 2008). There is some indication of a faint diffuse optical counterpart to the Hi plume (Chengalur et al. 1994; Hernández-Toledo et al. 2003). The Hi peak is also significantly displaced from the stellar disks (Iono et al. 2005). The overall Hi velocity gradient runs from southeast to northwest, roughly perpendicular to the rotation in the ionized and molecular gas (Hernández-Toledo et al. 2003; Iono et al. 2005). The most recent Hi mass determination for NGC 5953 has been obtained by Haan et al. (2008), M109 M⊙ (value scaled to our adopted distance of Mpc), typical of that expected for interacting galaxies of the same morphological type (Casasola et al. 2004).
| Parameter | Valueb | Referencesc |
|---|---|---|
| a | 15h34m32.36s | (1) |
| a | 15∘11′3770 | (1) |
| a | 15h34m32.38s | (2) |
| a | 15∘11′3759 | (2) |
| 1990 km s-1 | (1) | |
| RC3 Type | SAa pec | (3) |
| Nuclear Activity | S2/LINER | (4) (5) |
| Inclination | 42∘ | (1) |
| Position Angle | 45∘ 1∘ | (1) |
| Distance | 28 Mpc () | (3) |
| LB | L⊙ | (6) |
| M | M⊙ | (7) |
| M | M⊙ | (8) |
| Mdust(60 and 100 m) | M⊙ | (6) |
| LFIR | L⊙ | (9) |
-
a
(, ) is the phase tracking center of our 12CO observations, (, ) is the dynamical center derived from radio observations for the core of NGC 5953 by Krips et al. (2007a).
-
b
Luminosity and mass values extracted from the literature have been scaled to the distance of Mpc.
- c
The molecular gas distribution in NGC 5953 is symmetric with a short extension pointing toward NGC 5954 (e.g., Yao et al. 2003; Iono et al. 2005). The H2 mass content estimated by Iono et al. (2005) is M⊙ (scaled to the distance of Mpc for NGC 5953), higher than the molecular hydrogen mass found for the interacting companion NGC 5954 (M = M⊙). Higher-order transitions of the CO molecule have also been detected in NGC 5953, including the 12CO(3–2) line by Yao et al. (2003) with the James Clerk Maxwell Telescope (FWHM15″), suggesting a high excitation of the carbon monoxide, indicative of dense and hot gas. Table 1 summarizes the fundamental characteristics of NGC 5953.
The structure of this paper is as follows. In Sect. 2, we describe our new observations of NGC 5953 and the literature data with which we compare them. In Sects. 3 and 4, we present the observational results, both single dish and interferometric, describing morphology, excitation conditions, and kinematics of the molecular gas in the inner kpc of NGC 5953. Comparisons between 12CO observations and those obtained at other wavelengths are given in Sect. 5. In Sect. 6, we describe the computation of the gravity torques derived from the stellar potential in the inner region of NGC 5953. Sect. 7 summarizes our results.
We will assume a distance to NGC 5953 of Mpc (HyperLeda111http://leda.univ-lyon1.fr, Paturel et al. 2003) and a Hubble constant km s-1 Mpc-1. This distance implies that 1″ corresponds to 136 pc.

2 Observations
2.1 Interferometric observations
We observed NGC 5953 with the IRAM PdBI in the ABCD configuration of the array between September 2003 and February 2004 in the 12CO(1–0) (115 GHz) and the 12CO(2–1) (230 GHz) rotational transitions. The PdBI receiver characteristics, the observing procedures, and the image reconstruction are the same as described in García-Burillo et al. (2003). The quasars 3C454.3 and 3C273 were used for bandpass and flux calibrations respectively, and the quasar 1546+027 was used for phase and amplitude calibrations.
Data cubes with 512 512 pixels (0 20 for 12CO(1–0) and 0 14 for 12CO(2–1)) were created over a velocity interval of -242 km s-1 to +242 km s-1 in bins of 5 km s-1. The images were reconstructed using the standard IRAM/GILDAS222http://www.iram.fr/IRAMFR/GILDAS/ software (Guilloteau & Lucas 2000) and restored with gaussian beams of dimensions 20 14 (PA = ) at 115 GHz and 11 07 (PA = ) at 230 GHz. We used natural weighting to generate the 12CO(1–0) maps and uniform weighting to generate 12CO(2–1) maps. Such a procedure maximizes the flux recovered in 12CO(1–0) and optimizes the spatial resolution in 12CO(2–1). In the cleaned maps, the rms uncertainty in 5 km s-1 width velocity channels is 2.7 mJy beam-1 and for the 12CO(1–0) and 12CO(2–1) lines, respectively. At a level of 3 no 3 mm (1 mm) continuum was detected toward NGC 5953, down to an rms noise level of 0.32 mJy beam-1 (0.48 mJy beam-1). The conversion factors between intensity and brightness temperature are at 115 GHz and at 230 GHz. All velocities are referred to the systemic velocity = 1990 km s-1 (see later Sect. 4.1) and offsets are relative to the phase tracking center of the observations (, ) = (15h34m32.36s, 15∘11′3770). All maps presented in this paper are centered on this position. The maps are not corrected for primary beam attenuation.
2.2 Single dish observations and short spacing correction
We performed IRAM 30 m telescope observations in a raster pattern with 7″ spacing from 16 to 19 July 2002. We used 4 SIS receivers to observe simultaneously at the frequencies of the 12CO(1–0) (115 GHz), the 12CO(2–1) (230 GHz), and the HCN(1–0) (89 GHz) lines. The half power beam widths are 22″ for 12CO(1–0), 12″ for 12CO(2–1), and 29″ for HCN(1–0). The CO(2–1) line has been observed in dual-polarization. Typical system temperatures were 270-390 K at 115 GHz, 300-750 K at 230 GHz, and 120 K at 89 GHz. Throughout this paper the line intensity scale is expressed in units of , the beam-averaged radiation temperature. is related to , the equivalent antenna temperature reported above the atmosphere, by where is the telescope main-beam efficiency. At 115 GHz = 0.79, at 230 GHz = 0.54, and at 89 GHz = 0.82. All observations were performed in “wobbler-switching” mode, with a minimum phase time for spectral line observations of 2 s and a maximum beam throw of . The pointing accuracy was 3′′ rms. The single dish maps are centered on the phase tracking center of the interferometric observations (see Table 1).
Single dish 12CO observations were used to compute short spacings and complete the interferometric measurements. We combined 30 m and PdBI data using the SHORT-SPACE task available in the GILDAS software. The best compromise between good angular resolution and complete restoration of the missing extended flux was found by varying the relative weights of 30 m and PdBI observations. These were chosen in order to obtain the same mean weights in the single dish data as in the interferometric data within a ring in the plane ranging from to ( m). The combined PdBI+30 m data have produced maps with angular resolutions of 21 14 at PA = for the 12CO(1–0) and 11 07 at PA = for the 12CO(2–1). In the combined maps, the rms uncertainty in 5 km s-1 width velocity channels is 2.5 mJy beam-1 and 5.5 mJy beam-1 for the 12CO(1–0) and 12CO(2–1) lines, respectively. All figures presented in this paper are made with short-spacing-corrected data.
We estimate that the 12CO(1–0) map including only PdBI observations within 22″ (12CO(1–0) HPBW for the 30 m telescope) recovers a flux of SCO(1-0) = 150 Jy km s-1, 81 of the total flux measured with the combined PdBI+30 m map, SCO(1-0) = 185 Jy km s-1. Table 2 collects 12CO(1–0) flux values, both present in literature and determined with our observations, for NGC 5953. In this table, Col. (1) indicates the reference, Cols. (2) and (3) the telescope, both single dish and interferometer, and the diameter of the single dish telescope, Col. (4) is the primary beam of the instrument or the diameter used for the performed photometry, Col. (5) is the beam in interferometric measurements, and Col. (6) is the measured flux. Table 2 shows that 12CO(1–0) fluxes we obtained with interferometric observations, single dish, and combined measurements (PdBI+30 m) are in good mutual agreement with each other and with data present in literature. Our 12CO(1–0) combined map within 42″ gives a value (254 Jy km s-1) consistent with the flux of 233 Jy km s-1 found with OVRO (Iono et al. 2005), but consistent also with the NRAO flux of 365 Jy km s-1 (Zhu et al. 1999) taking into account that they used a single dish with a diameter of 12 m and a primary beam of 55″. In addition, we recovered 79 of the total flux detected by Young et al. (1995) with the FCRAO (320 Jy km s-1), a reasonable agreement considering the uncertainties in the amplitude calibration and the non-correction by the primary beam attenuation.
| Reference | Telescope | Diameter | Primary beam or FOVa | Beam | Flux |
|---|---|---|---|---|---|
| [m] | [″] | [″ ″] | [Jy km s-1] | ||
| Iono et al. (2005) | OVRO | 60 | 4.4 3.6 | 233 | |
| Zhu et al. (1999) | NRAO | 12 | 55 | 365 | |
| Young et al. (1995) | FCRAO | 14 | 45 | 320 | |
| This paper | PdBI+30 m | 42 | 2.1 1.4 | 254 | |
| This paper | PdBI+30 m | 22b | 2.1 1.4 | 185 | |
| This paper | PdBI | 22b | 2.0 1.4 | 150 | |
| This paper | 30 m | 30 | 22 (central position) | 167c | |
| This paper | 30 m | 30 | 22 (inner ) | 377d |
-
a
Primary beam is considered for single dish observations, while field-of-view (FOV) for interferometric or combined (interferometric+single dish) ones.
-
b
The photometry has been performed within 22″, the 12CO(1–0) primary beam for the 30 m telescope.
-
c
The 12CO(1–0) recovered flux for the central position (0″, 0″).
-
d
The 12CO(1–0) recovered flux for inner , mapping with 7″spacing (see Sect. 2.2).
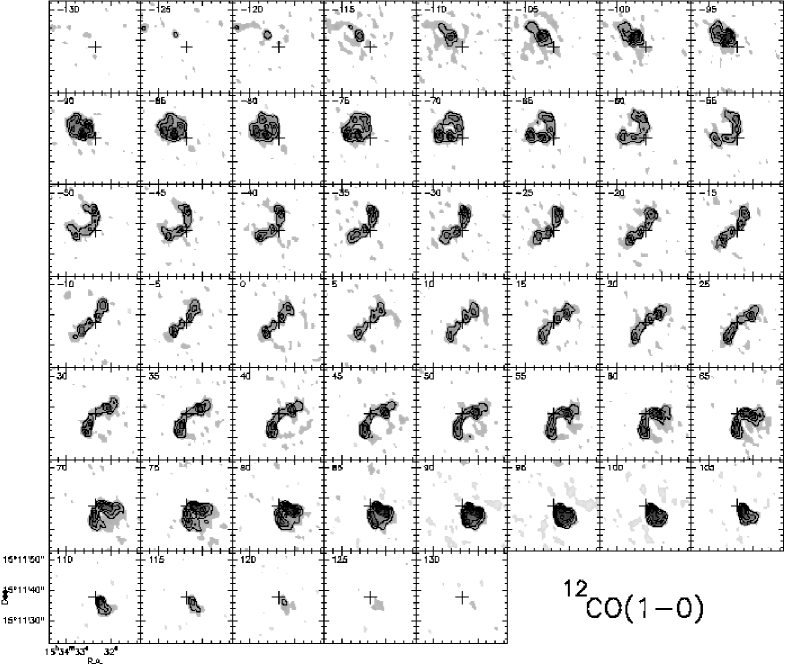
Figures 1 and 2 show the channel maps for the 12CO(1–0) and 12CO(2–1) lines, respectively, in the central region of NGC 5953. Figures 4 and 5 display the single dish data, for the 12CO(1–0), 12CO(2–1), and HCN(1–0) lines. The two 12CO lines have been mapped on a grid with spacings, while the HCN(1–0) line has been mapped on a grid with spacings and the nine HCN(1–0) spectra have been averaged to improve the signal-to-noise.
2.3 Optical and infrared images
We first acquired a broad-band optical image from the HST archive333Based on observations made with the NASA/ESA Hubble Space Telescope, and obtained from the Hubble Legacy Archive, which is a collaboration between the Space Telescope Science Institute (STScI/NASA), the Space Telescope European Coordinating Facility (ST-ECF/ESA) and the Canadian Astronomy Data Centre (CADC/NRC/CSA). of NGC 5953 obtained with the F606W filter (mean wavelength of 5940 ). This image was first published by Malkan et al. (1998), in a survey of 256 of the nearest (z0.035) Seyfert 1, Seyfert 2, and starburst galaxies. The image covers the inner with a pixel size of 0045.
From the HST archive, we also acquired the HST NICMOS F160W (-band, ) image of NGC 5953. This near-infrared (NIR) image was presented by Regan & Mulchaey (1999) and Hunt & Malkan (2004), and covers the inner of the galaxy with a pixel size of 0075.
We also acquired infrared (IR) images obtained with the IRAC camera on Spitzer, available thanks to the project ‘Starburst Activity in Nearby Galaxies’ (Principal Investigator: G. Rieke). The IRAC images, from 3.6, to , were reduced with MOPEX (Makovoz & Marleau 2005) which accounts for distortion and rotates to a fiducial coordinate system. They cover a large sky area (320) including both NGC 5953 and NGC 5954. We imposed a pixel size of 120 for the final images, roughly the same as the original IRAC detector. Following Helou et al. (2004), a “dust-only” (non-stellar) image was derived from the 8 m image, with subtraction of the stellar component computed by scaling the 3.6 m and 4.5 m images and subtracting them. This image will be referred to as a dust-only image, and should be dominated by emission from Polycyclic Aromatic Hydrocarbons (PAHs) and perhaps some hot dust continuum emission.
A image was derived from NIR data published by Hunt et al. (1999) acquired with ARNICA (Arcetri Near-Infrared Camera) mounted on the Nordic Optical Telescope (NOT444The NOT is operated on the island of La Palma jointly by Denmark, Finland, Norway, and Sweden, in the Spanish Observatorio del Roque de los Muchachos of the Instituto de Astrofisica de Canarias.). ARNICA was an imaging camera for the NIR bands between 1.0 and 2.5 m based on the Rockewell HgTeCd-array detector NICMOS 3 (256 256 pixels), and designed and built by Arcetri Observatory (Firenze, Italy) for the Infrared Telescope at Gornergrat in Switzerland. The ARNICA/NOT NIR images (, , ) cover 120, including the pair of interacting galaxies, NGC 5953 and NGC 5954, with a pixel size of 0546.
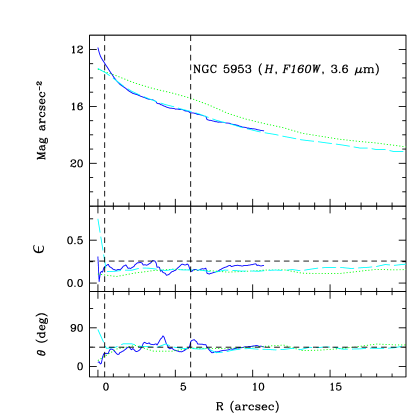
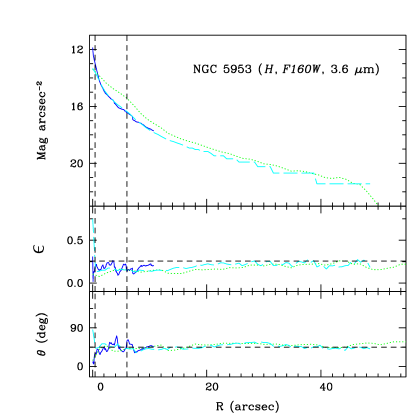
We compared the surface brightness profiles of the ground- and space-based images by extracting elliptically averaged profiles, centered on the brightness peaks. The position angle and ellipticity were allowed to vary in the ellipse fitting. These radial profiles are shown in Figure 3; the dashed horizontal lines in the lower panels correspond to the adopted position angle and inclination (see Sect. 4.1). The profiles agree quite well; in particular the ground-based -band and HST F160W show the same trend down to the nuclear regions where the ground-based atmospheric beam smearing leads to lower surface brightness. The -band/3.6 m color is relatively constant throughout the entire radial range shown, with slightly redder colors from 5-8′′.
3 Single dish results
The observations performed with the A and B receivers of the IRAM 30 m telescope in the two 12CO lines covered the inner 50′′, corresponding to the central 6.8 kpc (in diameter) of the galaxy (Fig. 4). The 25 observed positions show that the central region of NGC 5953 hosts extended molecular emission both in 12CO(1–0) and 12CO(2–1) emission (Fig. 4). The maximum detected is 0.18 K in 12CO(1–0) in the southwest corresponding to offset position (-7′′,-7′′), and 0.54 K in 12CO(2–1) at the same offset position (-7′′,-7′′).
Within the inner 50 we estimate a flux of 377 Jy km s-1, in good agreement with previous single dish flux determinations (Zhu et al. 1999; Young et al. 1995, see Table 2). From this 12CO(1–0) integrated flux assuming a H2-CO conversion factor / cm-2 (K km s-1)-1 (Solomon & Barrett 1991), we can derive the H2 mass within the observed region as:
| (1) |
We obtain M2.6, and including the mass of helium, the corresponding total molecular mass is M3.5.
 |
 |
The HCN(1–0) line has been observed for 9 positions with 7′′ spacing, covering the central 43″ (5.8 kpc). The HCN(1–0) emission is detected in the west part of the observed region, and the average spectrum over the 33 grid is shown in Fig. 5. The HCN(1–0) peak is at 0.005 K. The CO(1–0)/HCN(1–0) ratio is very high, equal to 20 on average over the center, where instead we would expect an enhanced HCN emission due to the AGN and thus a lower ratio. A high CO/HCN line ratio is rarely encountered in AGN but not completely unusual. NGC 6951 has a ratio of 30 in the starburst ring and 2.5 in the nucleus (Krips et al. 2007b), and NGC 3147 of 20 in the inner 4 kpc where the CO emission exhibits two ring-like structures around the nucleus (Casasola et al. 2008). On the other hand, the galaxy NGC 1097 has a CO/HCN ratio which ranges from 3 in the nucleus to 10 in the star-forming ring (Kohno et al. 2003). Since AGN activity implies an enhanced HCN emission relative to CO emission associated with the star-formation process, the high CO(1–0)/HCN(1–0) ratio observed in NGC 5953 implies that excitation by star-formation is dominant over AGN excitation in the circumnuclear region.
4 Interferometric results
4.1 Dynamical center and inclination
We assume that the dynamical center of NGC 5953 coincides with the position of the AGN “core” derived from radio observations (MERLIN/18 cm) by Krips et al. (2007a): =15h34m32.38s and =15∘11′3759. Since these coordinates are nearly coincident with those of the phase tracking center of our 12CO observations (see Table 1), in the following we assume that our observations are centered on the dynamical center of the galaxy.

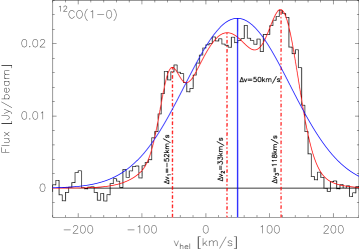
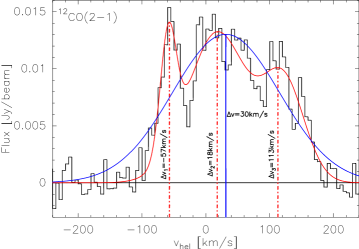
The spectral correlators were centered at 114.520 GHz and 229.037 GHz for the 12CO(1–0) and 12CO(2–1) line respectively, corresponding to = 1966 km s-1. The difference between LSR and heliocentric velocity is 16 km s-1, and therefore the observations were centered on = 1950 km s-1. In the inner 4″ the velocity centroid is 50 km s-1 redshifted with respect to the heliocentric velocity of the center of our 12CO(1–0) observations (Fig. 6, left panel, one component gaussian fit), and 30 km s-1 redshifted relative to 12CO(2–1) (Fig. 6, right panel, one component gaussian fit). We therefore estimate the systemic heliocentric velocity as the intermediate value between that determined for the 12CO(1–0) and that for the 12CO(2–1), = 1990 km s-1.
In Figs. 6, we fitted the emissions also considering three gaussian components, visible both in 12CO(1–0) and in 12CO(2–1). These (red) fits show that the wing components for the two 12CO lines are approximately at the same velocities within the noise (-52 km s-1 for the 12CO(1–0) vs. -57 km s-1 for the 12CO(2–1), and 118 km s-1 for the 12CO(1–0) vs. 113 km s-1 for the 12CO(2–1)). The major difference is present for the central gaussian component, 33 km s-1 for the 12CO(1–0) vs. 18 km s-1 for the 12CO(2–1), maybe due to the clumpy nature of the inner molecular gas. The line ratio () assumes the values of 1.2, 0.6, and 0.5 respectively for the three components passing from negative to positive velocities. The mean ratio of 0.8 is consistent with the line ratio discussed later in Sect. 4.3.
The systemic heliocentric velocity of 1990 km s-1 is 25 km s-1 redshifted with respect to the value determined from Hi observations (1965 km s-1, HyperLeda), and in agreement with the shift of 50 km s-1 inferred from previous 12CO(1–0) observations with OVRO (Iono et al. 2005). This discrepancy between systemic velocity derived from 12CO and Hi observations is not unusual, especially in galaxies with a lopsided Hi morphology. The NUGA galaxy NGC 4579 exhibits a difference of 50 km s-1, probably due to the interaction history of the galaxy and the different effect of the ram-pressure on the atomic and molecular gas (García-Burillo et al. 2009). Since the atomic gas is much more affected by ram-pressure (Kenney & Young 1986; Vollmer et al. 2001) than the molecular component, the Hi kinematics are more sensitive than the CO to the interaction history; NGC 5953 could present a similar scenario to NGC 4579. In fact, in NGC 5953 the Hi has been detected mainly in the outer parts where a big tidal tail connecting the two galaxies shifts the Hi barycenter with respect to the molecular gas that traces the less perturbed, inner parts of the galaxy.
We also derived the inclination of NGC 5953 by fitting the two-dimensional bulge/disk (B/D) decomposition on the ground-based -band image and the IRAC 3.6 m image (see Sect. 5.2). The best-fit inclinations are = 39∘ and 46∘, respectively; we therefore used a roughly intermediate value of 42∘, which approximates quite well the outer regions of the NIR images (see Fig. 3).
4.2 CO morphology and mass
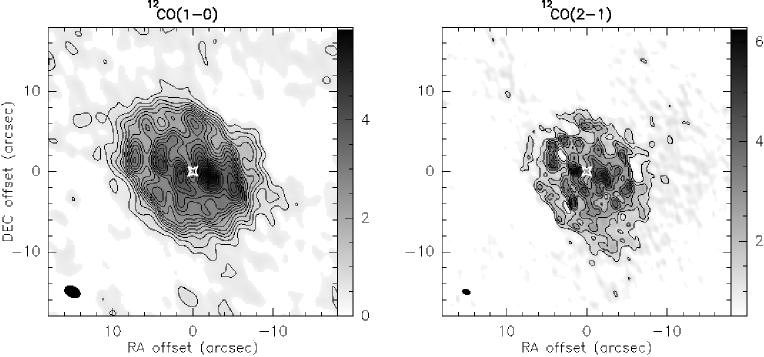
The 12CO(1–0) and 12CO(2–1) integrated intensity distributions are shown in Figure 7. The CO emission is distributed over a disk of 16″(2.2 kpc) diameter. Our 12CO(1–0) observations show several peaks, distributed more or less randomly, with the strongest one offset from the nucleus 2″ toward the west/southwest, away from NGC 5954. The 12CO(1–0) distribution is different from the Hi morphology, where the strongest emission has been detected mostly on the side nearer to NGC 5954 (e.g., Iono et al. 2005), although the Hi resolution is probably insufficient to resolve distinct peaks. In the 12CO(2–1) map the central emission is also clearly resolved and more clumpy than in 12CO(1–0). The strongest 12CO(2–1) peak is not that at 2-3″ in the west/southwest direction from the nucleus, like for 12CO(1–0), but that at 15 in the east direction from the nucleus.
The total H2 mass derived from our interferometric (PdBI+30 m) map within the 42″ primary beam field of the PdBI ( Jy km s-1, see Table 2) is M1.7 (Mmol2.3). Within a diameter of 22″ ( Jy km s-1, see Table 2), we derive a H2 mass of M1.3, 50% of the single dish 30 m H2 mass (see Sect. 3) corresponding to a region about 6.6 times larger in area. Hence, half of the molecular gas is concentrated in the central region of NGC 5953, as expected for spiral galaxies. The molecular gas distribution consists mainly of individual giant molecular cloud complexes, with the biggest one alone having a mass of M = 3.0 10, while the smaller ones have masses of a few 10.
NGC 5953 is quite massive in molecular gas compared to the other NUGA galaxies, where typically the mass is on the order of 3. Three galaxies of the NUGA sample, NGC 4569 (Boone et al. 2007), NGC 2782 (Hunt et al. 2008), NGC 3147 (Casasola et al. 2008), with molecular masses in the range of 1-3, are comparable with NGC 5953. The extraordinary case of NGC 1961 (Combes et al. 2009) is excluded from these considerations: NGC 1961 exhibits a H2 mass of 1.8, almost an order of magnitude more massive than any NUGA galaxy.
4.3 CO line ratio
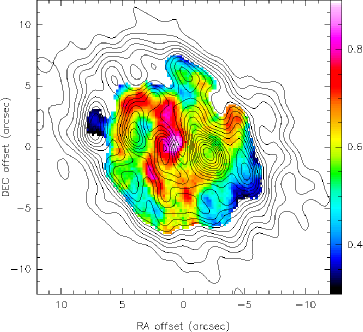
The comparison between the two 12CO maps, obtained after convolving the 12CO(2–1) map to the lower resolution of the 12CO(1–0) one and including short spacings for both maps, gives information about the local excitation conditions of the molecular gas. Figure 8 shows the ratio of the 12CO(1–0) to 12CO(2–1) convolved to the same resolution with 12CO(1–0) contours as in Fig. 7 (left panel). The line ratio ranges from 0.3 to 0.9 inside the observed region and the bulk of the emission has a ratio between 0.4 and 0.8, values consistent with optically thick emission in spiral disks (e.g., Braine & Combes 1992; García-Burillo et al. 1993). Ratio values of 0.9 are reached in some clumpy structures, randomly distributed inside the mapped region, especially those toward E/NE with respect to the nucleus, well visible in 12CO(2–1) emission (Fig. 7, right panel). A line ratio of 0.9 suggests a moderately high 12CO excitation consistently with Yao et al. (2003) who have detected the 12CO(3–2) line (345.80 GHz) with an intensity of K km s-1 and a line ratio =0.85 in the nucleus of NGC 5953. Different excitation conditions of the molecular gas appear to characterize the interacting companion galaxy NGC 5954, where the 12CO(3–2) line has been detected with a ratio of =0.37 (Yao et al. 2003).
4.4 Kinematics
The velocity-channel maps (see Figs. 1 and 2) show a general regularity of the large scale kinematics, typical for a rotating disk. Some local wiggles, not forming a coherent grand design, are superimposed on this regular pattern, both at negative and positive velocities especially to the west of the nucleus. These kinematic “glitches” are probably associated with the intensity peak toward the SW.
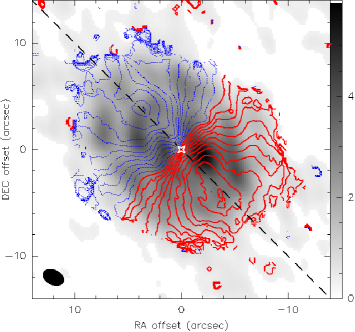
Figure 9 shows the 12CO(1–0) isovelocity contours (first-moment map) superposed on the 12CO(1–0) integrated intensity. The white star indicates the dynamical center of the galaxy assumed coincident with the phase tracking center of our observations, and the velocities are relative to the systemic heliocentric velocity, = 1990 km s-1. The dotted line traces the major axis of the galaxy determined from our observations (PA = 45∘ 1∘), by maximizing the symmetry in the position velocity diagrams. This value is also the best-fit PA given by the elliptically-averaged surface brightness profiles discussed in Sect. 2.3.
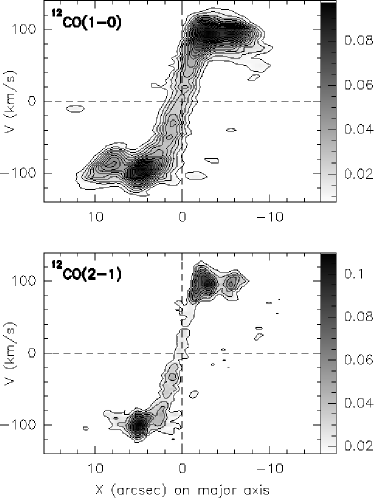
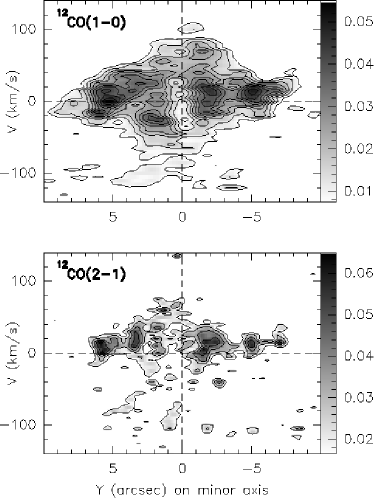
Position-velocity (p-v) cuts along the major (PA = 45∘) and minor axis (PA = 135∘) of NGC 5953 are shown in Figures 10 and 11, respectively. In both figures, the 12CO(1–0) emission is given in the top panel and the 12CO(2–1) one in the bottom panel. The p-v diagrams along the major axis reveal regular circular rotation and appear symmetric in the inner 10-11′′, both in 12CO(1–0) and 12CO(2–1). This regularity in the p-v diagram of NGC 5953, more typical for normal spiral galaxies than interacting ones, has also been found in the ionized gas, including H, (Gonzalez Delgado & Perez 1996), and (Hernández-Toledo et al. 2003). The kinematics shown by the minor-axis p-v diagrams (Fig. 11) are also quite regular, but show significant velocity dispersion for the 12CO(1–0) close to the nucleus. This effect can be attributed to beam smearing.
4.5 The rotation curve and dynamical mass
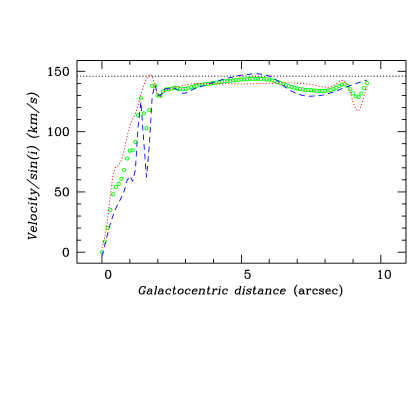
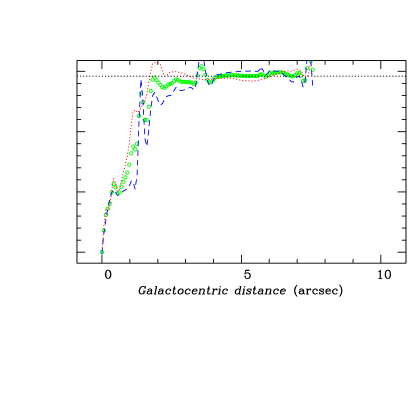
We have derived a rotation curve (RC) from the p-v diagram taken along the kinematic major axis of NGC 5953 at a PA = 45 ∘. The terminal velocities were derived by fitting multiple gaussian profiles to the spectra across the major axis. The fitted velocity centroids, corrected for (), give for each galactocentric distance.
For both lines the velocities (negative) to the northeast increase less steeply within 250 pc than those to the south (positive velocities). Nevertheless, they converge to the same value at greater distances, so we averaged together the two curves derived from either side of the major axis. Because data for both lines were consistent, we combined both curves into an average by spline interpolation. The RCs from the two 12CO transitions are shown in Figure 12. They are consistent with those found for the ionized gas, as reported by Gonzalez Delgado & Perez (1996) and Hernández-Toledo et al. (2003).
The 12CO RCs are very regular and apparently this behavior is expected more for normal spiral galaxies than interacting systems. NGC 5953 and the companion are clearly interacting and their outer parts are perturbed as shown by the presence of a tidal tail seen both in optical and in Hi emission (e.g., Hernández-Toledo et al. 2003; Haan et al. 2008). In NGC 5953, we are mapping the molecular gas in the inner parts that have a dynamical time-scale much shorter than the outer ones, and therefore they had the time to relax and reach an equilibrium state, perhaps after gas accretion/exchanges from/with NGC 5954. In other words, the regularity of the RCs in 12CO is not unexpected.
In the major-axis p-v diagrams, the velocity peaks at ) km s-1 at a radius of 2–4″ (400 pc); however, the bulk of the gas is rotating at ) km s-1 (see Fig. 12). This is roughly consistent with what is found for the ionized gas, ) km s-1 by Hernández-Toledo et al. (2003)555Taking into account their different adopted inclination.. The bulk velocity corrected for disk inclination, (we adopt , see Sect. 4.1), becomes 146 km s-1. From the corrected bulk velocity we can estimate the dynamical mass within a certain radius using the formula , where is in , in kpc, and in km s-1. Assuming the most flattened disk-like distribution (), the above formula gives a dynamical mass of M within a radius of 6″ (0.8 kpc).
Assuming a roughly flat rotation curve, the dynamical mass should be M within a radius of 21″ (2.9 kpc). In the same region, we estimate a total molecular gas mass of 1.7 (see Sect. 4.2), a fraction of % of the dynamical mass. Anyway, this percentage is subject to uncertainties. One of these could be due to the variation of the H2–CO conversion factor. In this work, as for similar studies of molecular gas, we assume a constant value for the conversion factor, for instance that determined for the Milky Way. However, the ratio is determined by various factors, such as the metallicity, the temperature, the cosmic ray density, and the UV radiation field (see Maloney & Black 1988; Boselli et al. 2002), and its value can change by a factor 4-15 (e.g., Wilson 1995; Casasola et al. 2007). The value also changes with galaxy morphological type: usually galaxies earlier than Scd show values comparable to, or lower than, the Galactic one, while extremely late-type spirals or irregular galaxies tend to show higher values (Nakai & Kuno 1995). Another possible uncertainty, but on the estimate of the dynamical mass, could be the suspected warp of the disk, discussed later in Sect. 5.3, that might give a wrong inclination of the disk, and so an incorrect rotation velocity.
5 Dust, stellar structure, and star formation
In this section we compare the 12CO distribution of NGC 5953 with observations at other wavelengths. These comparisons have a dual aim. First, they allow the study of possible correlations between different tracers of the ISM, such as between molecular clouds, considered the birth site of future generations of stars, and the light from the stellar component. The second aim is to determine the location of dynamical resonances, which greatly aid the determination of gas flow in the circumnuclear regions of the disk. However, in the case of NGC 5953, we find no evidence for any non-asymmetric component which could drive resonances.
5.1 Optical and near-infrared morphology
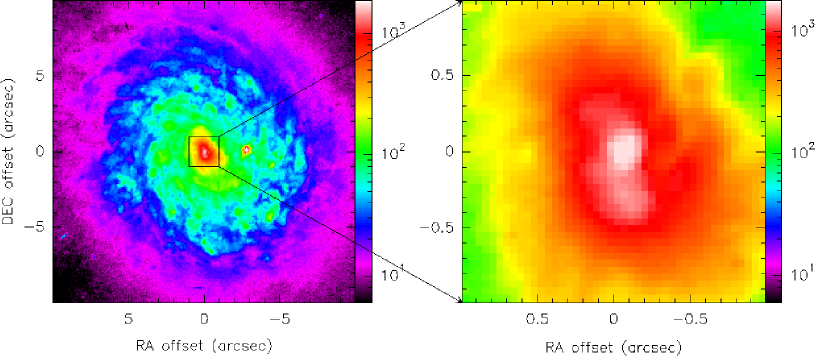
Figure 13 (left panel) displays a HST/NICMOS/F606W band image of the inner of NGC 5953, described in Sect. 2.3. We imposed that the brightness peak in this image coincides with the phase tracking center of our 12CO observations and therefore with the dynamical center, as discussed in Sect. 4.1. The small peak at 3″ west of center is almost certainly the foreground star identified in NGC 5953 by Rafanelli et al. (1990). Inspection of this figure shows a clearly-defined non-axisymmetric structure of 250 pc in size, similar in shape and size to the [Oiii] emission found by Gonzalez Delgado & Perez (1996). A close-up of the inner (Fig. 13, right panel) reveals an “S-shape” feature, perhaps associated with a nuclear bar (e.g., Hernández-Toledo et al. 2003). This bar-like signature is 60 pc in radius, with a PA17∘. Hernández-Toledo et al. (2003), by examining a contrast-enhanced -band image of NGC 5953 (the same image as used here), identified this structure at about the same PA as the global major axis of the galaxy. We find (see Fig. 13, right panel) instead a more vertical orientation, PA, depending on which features of the S-shape are used to define the PA. Rather than a nuclear bar, the S-shape structure could also be an optical counterpart of the radio jet (Krips et al. 2007a), because of the similar morphology, position angle, and size; this feature also seems to correspond to a higher excitation of the ionized gas (Gonzalez Delgado & Perez 1996).
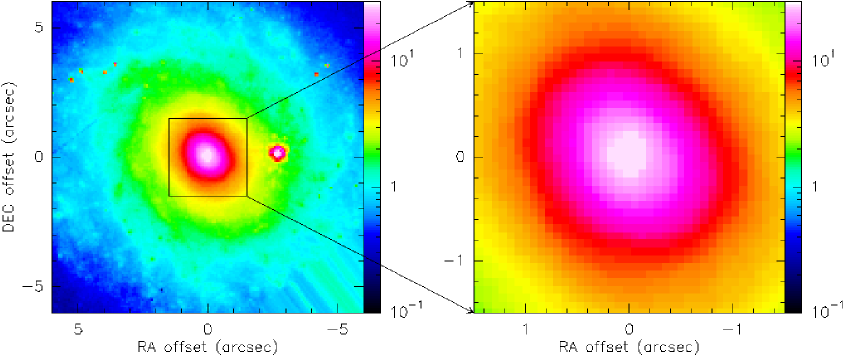
The inner morphology (HST/NICMOS/F160W) of NGC 5953 is shown in Figure 14. The foreground star to the 3″ to the west of the nucleus is clearly visible also at . The flocculent spiral structure clearly visible in the optical (Fig. 13) is not seen in the NIR emission; there is also no NIR counterpart to the S-shape feature seen in the optical.
The morphology of the warm dust in the circumnuclear regions of NGC 5953 is shown in Figure 15, where 12CO(1–0) and 12CO(2–1) intensities are contoured over the dust-only image described in Sect. 2.3. There is a dust emission peak to the SW, not exactly coincident with the 12CO emission peak but roughly in the same direction. The bulk of the (putative) dust emission is configured in a smooth featureless disk, similar to that seen in the 12CO emission.
5.2 Stellar structure
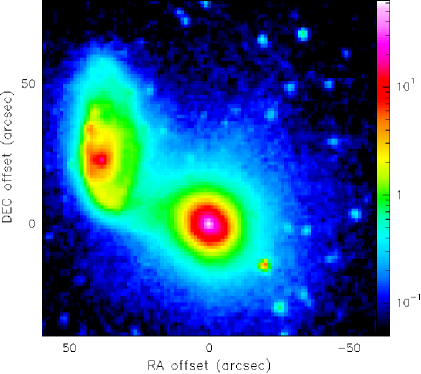
A large-scale view of the interacting companions NGC 5953 and NGC 5954 at 3.6 m is illustrated in Figure 16. Like the band, this image traces the massive component of the stellar populations in galaxies, but at 3.6 m the extinction is about 1/3 that of the band (Cardelli et al. 1989).
To investigate stellar structure, we performed a two-dimensional B/D decomposition with galfit (Peng et al. 2002) on both the ground-based -band image and IRAC 3.6 m image, fitting both galaxies (NGC 5953 and NGC 5954) simultaneously. In the fit, the models were convolved with the IRAC Point Response Function (PRF) or an approximation of the ground-based Point Spread Function, as appropriate. The best fit included a Sersic generalized exponential bulge, an exponential disk, and a nuclear point source for NGC 5953, and a Sersic generalized exponential bulge (but with index 1, so this is probably in reality a disk) and a nuclear point source for NGC 5954. The IRAC fit has a reduced of 4.2 (averaged over NGC 5953 and NGC 5954), roughly ten times smaller than that in the -band. Hence, in what follows, we mainly rely on the IRAC fit. The bulge comprises more than half (59%) of the total 3.6 m light, consistently with its early Hubble type, but has a small () Sersic index, unlike most early-type bulges with (Moriondo et al. 1998). The disk scalelength is 4 kpc, slightly larger than typical early-type spiral disks (e.g., Hunt et al. 2004); this could be due to the interaction and the proximity with NGC 5954.
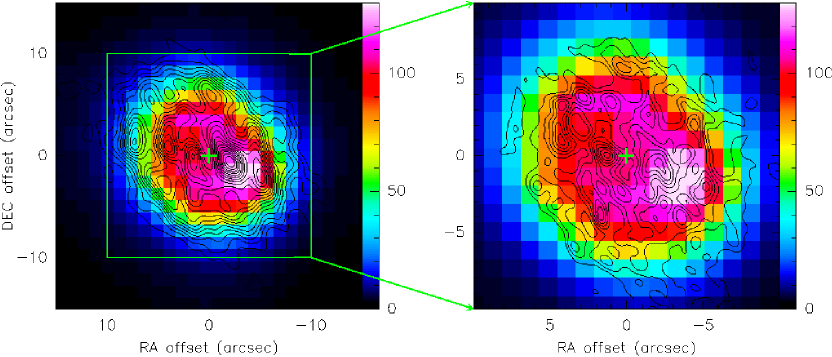
The IRAC 3.6 m residuals from the B/D decomposition are shown in Figure 17, with the 12CO(1–0) (left panel) and the 12CO(2–1) (right panel) in contours. The residuals show a low-amplitude circumnuclear “ring” with a radius of 5-7″. The 12CO(1–0) and 12CO(2–1) disks nearly coincide in size with the ring structure in the residuals.
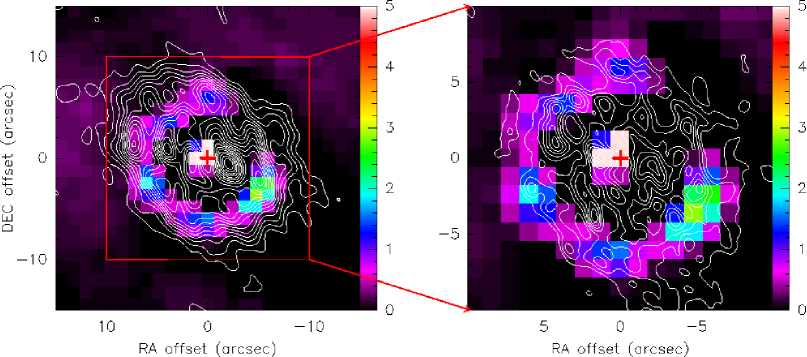
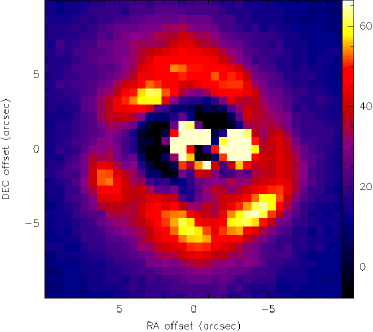
Because the size of the ring in the IRAC residuals is typical of small-scale “doughnuts” associated with the diffraction limit and PRF incompatibilities, we wanted to verify the reality of the ring-like feature seen in the 3.6 m residuals. If real, it should also appear in the -band residuals, which are shown in the left panel of Figure 18. Inspection of the figure shows that the ring is indeed present, delineated by a series of surface brightness excesses. The intensity contrast in these is around a factor of 10 relative to the regions external to the ring. The presence of the ring in both sets of residuals suggests that it is a real feature, rather than an artefact of IRAC PRF mismatching. Moreover, intensity peaks in the ring-like structure are also present in the un-sharp masked HST/NICMOS/F160W map (see Hunt & Malkan 2004). We therefore conclude that the ring in the NIR residuals is real, and probably stellar in nature, as we discuss below.
5.3 The stellar ring
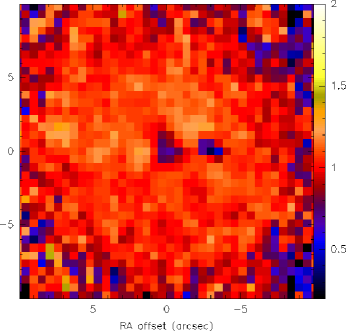
The right panel of Fig. 18 displays the ARNICA/NOT color image of NGC 5953. The nucleus of NGC 5953 and a small region to the west have extremely blue colors (0.7 and 0.3, respectively), while the disk has rather normal ones (1.0). The small knot 3″ west of center, visible also in the WFPC2/F606W (Fig. 13) and NICMOS/F160W (Fig. 14) images, coincides almost certainly with the star identified by Rafanelli et al. (1990). There may be a few isolated regions (1″) to the east of the nucleus with a red excess (1.3), but there is no evidence in the colors for the ring seen in the B/D residuals. This suggests that the excess residual ring is a stellar ring, with colors similar to the surrounding disk.
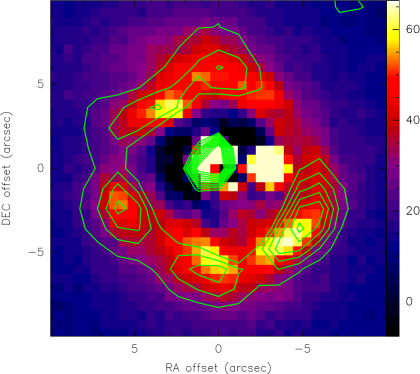
A hint of the circumnuclear ring in NGC 5953 also appears in previous optical observations of the ionized gas. With the integral-field spectrograph SAURON operating on the William Herschel Telescope, Falcón-Barroso et al. (2006) found recent star formation in a circumnuclear ring with a radius of 6–7″. The H emission is apparently distributed in a circumnuclear disk, roughly coincident with the CO one, but the H velocity dispersion and the [Oiii]/H ratio are lower in a ring-like structure than in the main circumnuclear disk. This could be because the nucleus excites gas in an extended region (Falcón-Barroso et al. 2006), or be due to a true ring in the dynamical sense of a resonance. Lower velocity dispersion and lower [Oiii]/H are both associated with enhanced star formation, leading Hernández-Toledo et al. (2003) to conclude that NGC 5953 hosts a circumnuclear ring. The size of this star-forming ring is coincident with that of the NIR ring in the residuals. Figure 19 shows the superposition of the 3.6 m residuals image (Fig. 17, left panel), represented in (green) contours, on the -band residuals image (Fig. 18, left panel). This figure clearly shows the coincidence in size between the two NIR rings, the same size of the star-forming ring seen in the ionized gas.
Because the ring is visible in ionized gas, but in the NIR appears as stars, with no sign of hot dust because of normal colors, we interpret it as an ongoing starburst, with a stellar Red Super Giant (RSG) population. This would imply that the ring feature is at least 10–15 Myr old, because RSGs onset at roughly that time (Leitherer et al. 1999). However, the presence of hydrogen recombination lines (e.g., Gonzalez Delgado & Perez 1996; Hernández-Toledo et al. 2003) means that star formation is still ongoing, although the exact age is difficult to determine (5-10 Myr).
In addition to the star-formingstellar ring, the observations of Falcón-Barroso et al. (2006) suggest that the stars in the outer regions of the circumnuclear disk are counter-rotating relative to stars in the inner disk and the ionized and molecular gas. In this (putative) kinematically decoupled component (KDC), the stars in the outer parts are redshifted toward the NE, while the ionizedmolecular gas and the stars in the inner parts are redshifted toward the SW. The separation between the two sets of kinematics is at roughly 7-8″ radius, so the ring could be the separation between the two regimes. The most likely explanation for this, as proposed by Falcón-Barroso et al. (2006), is that in NGC 5953 we are witnessing the formation of a decoupled component as a result of an ongoing interaction; the gas in the inner parts could have been accreted from the companion NGC 5954. The KDC could be in its early stages, as judged by our stellar population age estimate of 10-15 Myr. This age would be consistent with the onset of the interaction of 40 Myr ago, as suggested by Jenkins (1984); this age from the time of closest approach is almost independent of the details of the model. This kind of counter-rotation has been also studied with simulations (e.g., di Matteo et al. 2008), and the presence of the Hi tidal tail gives some hint that the interaction in the pair NGC 5953/5954 is prograde, i.e., that at least one of the disks involved has its spin axis parallel to the orbital velocity of the merger (Hibbard & van Gorkom 1996; Iono et al. 2005).
Alternatively, the observed counter-rotation could be only apparent and not real, due to a warped disk in the center. The inner disk is not highly inclined, and a small tilt of the plane starting at a radius close to that of the ring, is able, because of projection effects, to reverse the apparent sense of rotation, without the presence of a true counter-rotation. A warped inner disk is expected from the close tidal interaction between NGC 5953 with NGC 5954, and the obvious tidal tails in optical and Hi. The warped disk hypothesis is supported by the fact that the ionised gas also, and not only the stars, shows some hint of counter-rotation. The existence of two gas flows counter-rotating in the same disk, is a very unlikely situation, that could be at best transient. The gas counter-rotation just outside the ring is visible in the Sauron velocity maps of Falcón-Barroso et al. (2006). Indeed, the velocity maps in H, and even more the [Oiii] lines reveal on the NE part of the major axis that the velocity from blueshifted turns to redshifted again, by an amount of 40 km s-1. The apparent counter-rotation might look more striking on the stellar velocity maps, only because the stellar component is less rotation-dominated in the inner disk, because of the higher velocity dispersion. So the velocities on the major axis turn from -40 km s-1 to 40 km s-1, while the gas is turning from -100 km s-1 to 40 km s-1. But it is clear that in the NE part of the major axis, the stars and gas are co-rotating at the same velocities, and apparently counter-rotate relative to the inner disk. Since the gas cannot be counter-rotating with itself for a long time, the interpretation of a warp in the outer disk is probably more realistic. However, if the gas is actually counter-rotating at a radius of 1.6 kpc, then it could arise from external accretion at that radius. This gas is configured in a full gaseous disk, of about 8 kpc radius, as mapped in Hi by Chengalur et al. (1994). We then can only witness a transient phase of settling of the accreted gas, which will soon align its rotation with the main disk, rotating in the same sense as the CO gas and stars in the center.

5.4 Star formation in NGC 5953
Most of the star formation in NGC 5953 occurs in the circumnuclear region sampled by our 12CO observations. The star-formation rate (SFR) given by H within a FOV of 33″41″ is 0.6 M⊙ yr-1 (Falcón-Barroso et al. 2006). This corresponds to 0.024 M⊙ yr-1 kpc-2. We measure a molecular mass of M⊙ in a roughly similar region (see Sect. 4.2), which would give a molecular surface density of 60 M⊙ pc-2. In a Kennicutt-Schmidt (KS) law diagram without the neutral atomic gas component, this would place NGC 5953 in the transition region between normal spiral disks and circumnuclear starbursts (Kennicutt 1998). In fact, Hi observations show significant streaming motions over the inner 17 kpc inconsistent with global rotation (Iono et al. 2005; Haan et al. 2008). Hence, the Hi probably does not take part in the star formation activity in this region. It is probable that the enhanced star formation in NGC 5953 is caused by dynamical perturbations induced by the interaction.
In NGC 5953, the high H2 surface density and the low SFR imply that the distribution of molecular gas (traced by CO) does not correlate locally with the SFR; the large reservoir of molecular gas is not converted into stars proportionally to the KS law on small spatial scales. At present, the non-local correlation between SFR and gas is highly debated (Bigiel et al. 2008; Leroy et al. 2008). Other molecular transitions could be likely better indicators of SFR than the total H2 content traced by CO. Tracers of dense molecular gas, such as HCN(1–0) and HCO+(1–0) lines, are suspected to better correlate with the SFR (e.g., Gao & Solomon 2004a, b; Wu et al. 2005; Graciá-Carpio et al. 2008).
6 Gravitational torques on the molecular gas
In this section we study whether gravitational torques, derived from the stellar potential in the inner region of NGC 5953, can account for the gas kinematics derived from CO and examine the efficiency of gravitational torques exerted on the gas. As described in previous NUGA papers (e.g., García-Burillo et al. 2005), we assume that NIR images give the best approximation for the total stellar mass distribution, being less affected than optical images by dust extinction or stellar population bias.
6.1 Evaluation of the gravitational potential
We computed the torques using Spitzer/IRAC and ARNICA images. They both yield comparable results, but we use in the following only the NOT/ARNICA images which give more spatial resolution. We perform the subtraction of foreground stars, deprojection, and resampling, as described in other NUGA papers (e.g., García-Burillo et al. 2005).
We repeat here some definitions and assumptions used to evaluate the gravitational torques. The NIR image is completed in the vertical dimension by assuming an isothermal plane model with a constant scale height, equal to 1/12th of the radial scale-length of the image. The potential is derived by a Fourier transform method and assuming a constant mass-to-light (M/L) ratio whose value is chosen to better reproduce the observed 12CO rotation curve. Beyond a radius of 20″(or 5.4 kpc in diameter), the mass density is set to 0, thus suppressing any spurious terms. This assumption is sufficient to compute the potential over the PdBI 12CO(1–0) primary beam.
To characterize the non-axisymmetry of the potential, we expand its in Fourier components (-modes), following Combes & Sanders (1981):
where and are the amplitude and phase of the -mode, respectively.
The strength of each -Fourier component, , is defined by the ratio between tangential and radial forces, . The strength of the total non-axisymmetric perturbation is defined by:
where and represent the maximum amplitude of the tangential force and the mean axisymmetric radial force, respectively. Figures 20 show the strengths and phases vs. radius for the first components. There is only a weak perturbation; the strongest one is .
6.2 Evaluation of gravity torques
From the derivatives of on each pixel we obtain the forces per unit mass ( and ) and therefore the torques per unit mass can be computed by:
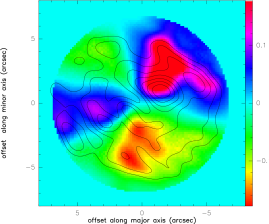
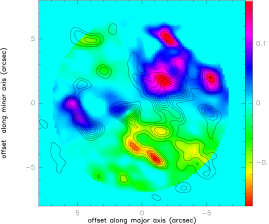
The torque map is oriented according to the sense of rotation in the plane of the galaxy, and the combination of the torque map and the gas density map allows us to derive the net effect on the gas at each radius. The gravitational torque map weighted by the gas surface density , normalized to its maximum value, is shown in Figures 21 and 22 for 12CO(1–0) and 12CO(2–1), respectively. The observed gas distribution is representative of the time spent by a molecular cloud on a typical orbit at this location.
To estimate the efficiency of the radial gas flow induced by the torques, we first compute the torque per unit mass averaged over azimuth, using as the actual weighting function:
where is, for definition, the time derivative of the specific angular momentum of the gas averaged azimuthally, =. Now to have dimensionless quantities, we normalize this variation of angular momentum per unit time to the angular momentum at this radius and to the rotation period. We then estimate the efficiency of the gas flow as the average fraction of the gas specific angular momentum transferred in one rotation () by the stellar potential, as a function of radius:
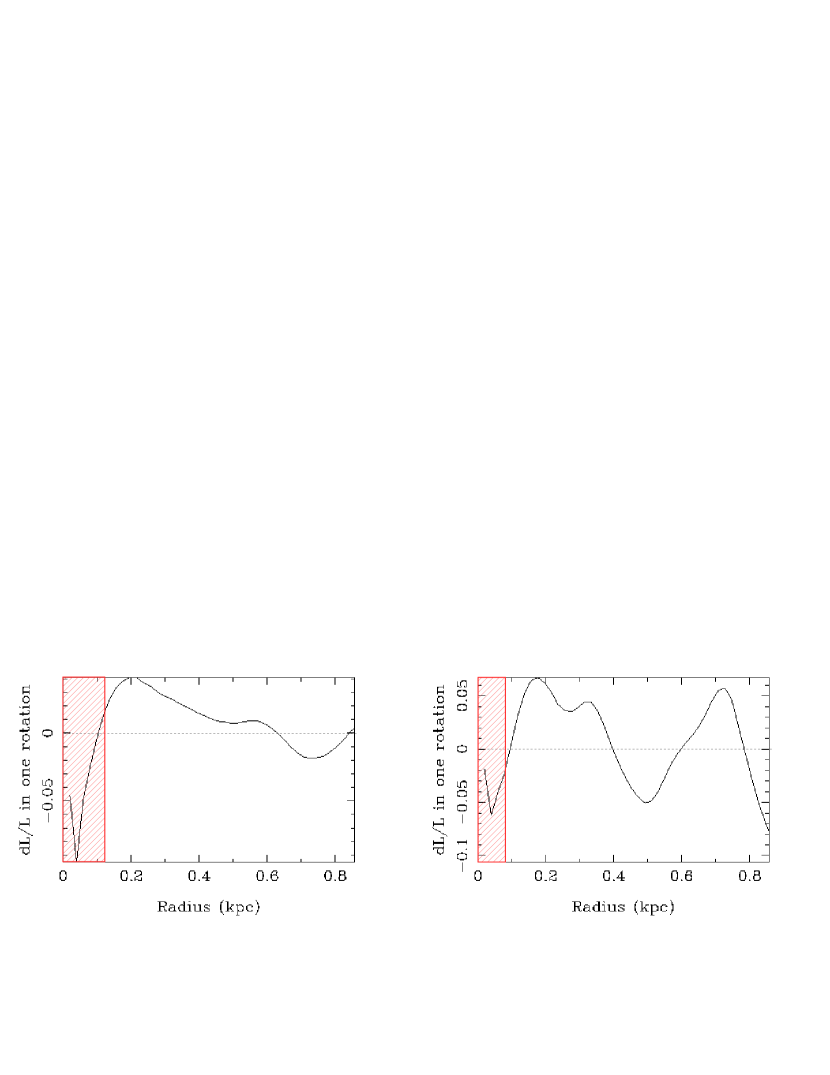
where is assumed to be well represented by its axisymmetric estimate, . Figures 23 show curves for NGC 5953 derived from the 12CO(1–0) (left) and the 12CO(2–1) (right) data. The (red) dashed area corresponds to the resolution limit of our observations. In the left panel, the CO(1–0) map resolution (120 pc) is the limiting factor, while, on the right, the CO(2–1) map resolution (60 pc) and the similar NIR image resolution (70 pc) are the constraining factors. This figure shows that the torques are weak and predominantly positive between 100–400 pc in both 12CO(1–0) and 12CO(2–1). Nothing can be said for the negative torques inside a radius of 120 pc for 12CO(1–0) and 70 pc, below our resolution. In 12CO(2–1) the torques are noisier than in 12CO(1–0), maybe because of a more clumpy emission.
In summary, torques are predominantly positive in the region 100–400 pc for both lines, and the gas is not apparently fueling the central 100 pc region down to the effective spatial resolution of our observations. In addition, the absolute value of the torques is very small, less than 5% of the gas angular momentum is exchanged in each rotation. This is due to the very regular and almost axisymmetric total mass and gas distributions in the center of the galaxy.
7 Summary and conclusions
The molecular gas in the Seyfert 2/LINER galaxy NGC 5953 has been mapped with high resolution (21 14 for the 12CO(1–0) line and 11 07 for the 12CO(2–1) line) inside a radius of 20″ (2.7 kpc). The 12CO emission is distributed over a disk of diameter of 16′′ with several peaks randomly distributed. The strongest intensity peak is not located in the center of the galaxy but shifted 2-3′′ toward the west/southwest. The kinematics of the molecular gas show a general regularity with some local wiggles especially to the west of the nucleus maybe associated with the intensity peak toward the SW.
By comparing the molecular gas distribution with observations at other wavelengths, we studied correlations between different tracers of the ISM. Optical and NIR morphology has been studied by analyzing different images. The F606W/HST broad-band optical image of NGC 5953 shows a flocculent spiral structure and an “S” like-bar of 250 pc and 60 pc in size, respectively. These structures are absent in the (HST/NICMOS/F160W) image and in the IRAC “dust-only” one; instead in the optical and at we identified at 3″ west of center the foreground star studied by Rafanelli et al. (1990). The stellar structure has been investigated by performing a two-dimensional B/D decomposition on the ground-based -band image and IRAC 3.6 m image. Both sets of residuals show a circumnuclear stellar ring with a radius of 5-7″, approximately coincident in size with the 12CO disk. The presence of the ring in both sets of residuals suggests that it is not the typical “doughnut” associated with the diffraction limit and IRAC PRF incompatibilities, but rather is a real feature. The size of this stellar ring is the same of the circumnuclear star-forming ring seen in H with previous observations. In addition, since this ring is visible in the NIR as stars but not as hot dust emission (), we interpret it as a RSG population at least 10 Myr old.
There is an apparent counter-rotation between gas and stars inside the ring, and stars outside. The ring could be the separation between the two kinematically decoupled components (KDC). The formation of a KDC could be explained as a result of the ongoing interaction, and could be in its early stages. Alternatively, this apparent counter-rotation could be due to a warp of the plane of the disk. The ring would then be the start of the warp.
Using NIR images we found that gravity torques acting on the gas are predominantly positive in the region 100–400 pc in both 12CO(1–0) and 12CO(2–1), indicating that the gas is not fueling the central 100 pc region, down to the effective spatial resolution of our observations. In addition, the absolute values of these torques are very small, certainly due to the almost axisymmetric total mass and gas distributions in the center of the galaxy. The AGN in NGC 5953 is apparently not being actively fueled in the current epoch.
Acknowledgements.
The authors would like to thank the anonymous referee, whose comments have been useful for improving the original version of the paper. We thank the scientific and technical staff at IRAM for their work in making our 30 m and PdBI observations possible. V. Casasola wishes to thank Riccardo Cesaroni and Claudio Codella for help provided during the data reduction. This research has made use of the NASA/IPAC Extragalactic Database (NED), HyperLeda Database, IRAS Catalog, Spitzer archive, and Hubble Legacy Archive.References
- Bigiel et al. (2008) Bigiel, F., Leroy, A., Walter, F., Brinks, E., de Blok, W. J. G., Madore, B., & Thornley, M. D. 2008, AJ, 136, 2846
- Boone et al. (2007) Boone, F., et al. 2007, A&A, 471, 113 (NUGA VII)
- Boselli et al. (2002) Boselli, A., Lequeux, J., & Gavazzi, G. 2002, Ap&SS, 281, 127
- Braine & Combes (1992) Braine, J., & Combes, F. 1992, A&A, 264, 433
- Cardelli et al. (1989) Cardelli, J. A., Clayton, G. C., & Mathis, J. S. 1989, ApJ, 345, 245
- Casasola et al. (2004) Casasola, V., Bettoni, D., & Galletta, G. 2004, A&A, 422, 941
- Casasola et al. (2007) Casasola, V., Combes, F., Bettoni, D., & Galletta, G. 2007, A&A, 473, 771
- Casasola et al. (2008) Casasola, V., Combes, F,. García-Burillo, S., Hunt, L. K., Léon, S., & Baker, A. J., 2008, A&A, 490, 61
- Chengalur et al. (1994) Chengalur, J. N., Salpeter, E. E., & Terzian, Y. 1994, AJ, 107, 1984
- Combes & Sanders (1981) Combes, F., & Sanders, R. H. 1981, A&A, 96, 164
- Combes & Gerin (1985) Combes, F., & Gerin, M. 1985, A&A, 150, 327
- Combes (2001) Combes, F. 2001, Advanced Lectures on the Starburst-AGN , 223
- Combes et al. (2004) Combes, F., et al. 2004, A&A, 414, 857 (NUGA II)
- Combes et al. (2009) Combes, F., et al. 2009, A&A, 503, 73 (NUGA XII)
- de Jong (1996) de Jong, R. S. 1996, A&A, 313, 377
- di Matteo et al. (2008) di Matteo, P., Combes, F., Melchior, A.-L., & Semelin, B. 2008, A&A, 477, 437
- Falcón-Barroso et al. (2006) Falcón-Barroso, J., et al. 2006, MNRAS, 369, 529
- Ferrarese et al. (2001) Ferrarese, L., Pogge, R. W., Peterson, B. M., Merritt, D., Wandel, A., & Joseph, C. L. 2001, ApJ, 555, L79
- Friedli & Martinet (1993) Friedli, D., & Martinet, L. 1993, A&A, 277, 27
- Gao & Solomon (2004a) Gao, Y., & Solomon, P. M. 2004a, ApJ, 606, 271
- Gao & Solomon (2004b) Gao, Y., & Solomon, P. M. 2004b, ApJS, 152, 63
- García-Burillo et al. (1993) Garcia-Burillo, S., Guelin, M., & Cernicharo, J. 1993, A&A, 274, 123
- García-Burillo et al. (2000) García-Burillo, S., Sempere, M. J., Combes, F., Hunt, L. K., & Neri, R. 2000, A&A, 363, 869
- García-Burillo et al. (2003) García-Burillo, S., et al. 2003, A&A, 407, 485 (NUGA I)
- García-Burillo et al. (2005) García-Burillo, S., Combes, F., Schinnerer, E., Boone, F., & Hunt, L. K. 2005, A&A, 441, 1011 (NUGA IV)
- García-Burillo et al. (2009) García-Burillo, S., et al. 2009, A&A, 496, 85 (NUGA XII)
- Graciá-Carpio et al. (2008) Graciá-Carpio, J., García-Burillo, S., Planesas, P., Fuente, A., & Usero, A. 2008, A&A, 479, 703
- Gonzalez Delgado & Perez (1996) Gonzalez Delgado, R. M., & Perez, E. 1996, MNRAS, 281, 781
- Guilloteau & Lucas (2000) Guilloteau, S., & Lucas, R. 2000, Imaging at Radio through Submillimeter Wavelengths, 217, 299
- Haan et al. (2007) Haan, S., Schinnerer, E., Mundell, C. G., Combes, F., Garcia-Burillo, S., & Emsellem, E. 2007, Astronomische Nachrichten, 328, 675
- Haan et al. (2008) Haan, S., Schinnerer, E., Mundell, C. G., García-Burillo, S., & Combes, F. 2008, AJ, 135, 232
- Heckman et al. (1986) Heckman, T. M., Smith, E. P., Baum, S. A., et al.: 1986, ApJ, 311, 526
- Heckman et al. (2004) Heckman, T. M., Kauffmann, G., Brinchmann, J., Charlot, S., Tremonti, C., & White, S. D. M. 2004, ApJ, 613, 109
- Helou et al. (2004) Helou, G., et al. 2004, ApJS, 154, 253
- Hernández-Toledo et al. (2003) Hernández-Toledo, H. M., Fuentes-Carrera, I., Rosado, M., Cruz-González, I., Franco-Balderas, A., & Dultzin-Hacyan, D. 2003, A&A, 412, 669
- Hibbard & van Gorkom (1996) Hibbard, J. E., & van Gorkom, J. H. 1996, AJ, 111, 655
- Hopkins & Hernquist (2006) Hopkins, P. F., & Hernquist, L. 2006, ApJS, 166, 1
- Hunt et al. (1999) Hunt, L. K., Malkan, M. A., Rush, B., Bicay, M. D., Nelson, B. O., Stanga, R. M., & Webb, W. 1999, ApJS, 125, 349
- Hunt & Malkan (2004) Hunt, L. K., & Malkan, M. A. 2004, ApJ, 616, 707
- Hunt et al. (2004) Hunt, L. K., Pierini, D., & Giovanardi, C. 2004, A&A, 414, 905
- Hunt et al. (2008) Hunt, L. K., et al. 2008, A&A, 482, 133 (NUGA IX)
- Iono et al. (2005) Iono, D., Yun, M. S., & Ho, P. T. P. 2005, ApJS, 158, 1
- Janiuk et al. (2004) Janiuk, A., Czerny, B., Siemiginowska, A., & Szczerba, R. 2004, ApJ, 602, 595
- Jenkins (1984) Jenkins, C. R. 1984, ApJ, 277, 501
- Jogee et al. (2005) Jogee, S., Scoville, N., & Kenney, J. D. P. 2005, ApJ, 630, 837
- Jogee (2006) Jogee, S. 2006, Physics of Active Galactic Nuclei at all Scales, 693, 143, (astro-ph/0408383)
- Kenney & Young (1986) Kenney, J. D., & Young, J. S. 1986, ApJ, 301, L13
- Kennicutt (1998) Kennicutt, R. C., Jr. 1998, ARA&A, 36, 189
- King & Pringle (2007) King, A. R., & Pringle, J. E. 2007, MNRAS, 377, L25
- Knapen et al. (2002) Knapen, J. H., Pérez-Ramírez, D., & Laine, S. 2002, MNRAS, 337, 808
- Kohno et al. (2003) Kohno, K., Ishizuki, S., Matsushita, S., Vila-Vilaro, B., Kawabe, R.: 2003, PASJ 55, L1
- Krips et al. (2005) Krips, M., et al. 2005, A&A, 442, 479 (NUGA III)
- Krips et al. (2007a) Krips, M., et al. 2007a, A&A, 464, 553
- Krips et al. (2007b) Krips, M., Neri R., García-Burillo, S.,: 2007b, A&A 468, L63, (NUGA VI)
- Leitherer et al. (1999) Leitherer, C., et al. 1999, ApJS, 123, 3
- Leroy et al. (2008) Leroy, A. K., Walter, F., Brinks, E., Bigiel, F., de Blok, W. J. G., Madore, B., & Thornley, M. D. 2008, AJ, 136, 2782
- Makovoz & Marleau (2005) Makovoz, D., & Marleau, F. R. 2005, PASP, 117, 1113
- Malkan et al. (1998) Malkan, M. A., Gorjian, V., & Tam, R. 1998, ApJS, 117, 25
- Maloney & Black (1988) Maloney, P., & Black, J. H. 1988, ApJ, 325, 389
- Marecki et al. (2003) Marecki, A., Spencer, R. E., & Kunert, M. 2003, Publications of the Astronomical Society of Australia, 20, 46
- Moriondo et al. (1998) Moriondo, G., Giovanardi, C., & Hunt, L. K. 1998, A&AS, 130, 81
- Mulchaey & Regan (1997) Mulchaey, J. S., & Regan, M. W. 1997, ApJ, 482, L135
- Nakai & Kuno (1995) Nakai, N., & Kuno, N. 1995, PASJ, 47, 761
- Narayanan et al. (2006) Narayanan, D., et al. 2006, ApJ, 642, L107
- Paturel et al. (2003) Paturel, G., Petit, C., Prugniel, P., Theureau, G., Rousseau, J., Brouty, M., Dubois, P., & Cambrésy, L. 2003, A&A, 412, 45
- Peng et al. (2002) Peng, C. Y., Ho, L. C., Impey, C. D., & Rix, H.-W. 2002, AJ, 124, 266
- Rafanelli et al. (1990) Rafanelli, P., Osterbrock, D. E., & Pogge, R. W. 1990, AJ, 99, 53
- Rampazzo et al. (1995) Rampazzo, R., Reduzzi, L., Sulentic, J. W., & Madejsky, R. 1995, A&AS, 110, 131
- Regan & Mulchaey (1999) Regan, M. W., & Mulchaey, J. S. 1999, AJ, 117, 2676
- Sakamoto et al. (1999) Sakamoto, K., Okumura, S. K., Ishizuki, S., & Scoville, N. Z. 1999, ApJ, 525, 691
- Schinnerer et al. (2000a) Schinnerer, E., Eckart, A., & Tacconi, L. J. 2000a, ApJ, 533, 826
- Schinnerer et al. (2000b) Schinnerer, E., Eckart, A., Tacconi, L. J., Genzel, R., & Downes, D. 2000b, ApJ, 533, 850
- Shu et al. (1990) Shu, F. H., Tremaine, S., Adams, F. C., & Ruden, S. P. 1990, ApJ, 358, 495
- Solomon & Barrett (1991) Solomon, P. M., & Barrett, J. W. 1991, Dynamics of Galaxies and Their Molecular Cloud Distributions, 146, 235
- Veilleux et al. (1995) Veilleux, S., Kim, D.-C., Sanders, D. B., Mazzarella, J. M., & Soifer, B. T. 1995, ApJS, 98, 171
- Vollmer et al. (2001) Vollmer, B., Braine, J., Balkowski, C., Cayatte, V., & Duschl, W. J. 2001, A&A, 374, 824
- Wilson (1995) Wilson, C. D. 1995, ApJ, 448, L97
- Wu et al. (2005) Wu, J., Evans, N. J., II, Gao, Y., Solomon, P. M., Shirley, Y. L., & Vanden Bout, P. A. 2005, ApJ, 635, L173
- Yao et al. (2003) Yao, L., Seaquist, E. R., Kuno, N., & Dunne, L. 2003, ApJ, 588, 771
- Young et al. (1995) Young, J. S., et al. 1995, ApJS, 98, 219
- Zhu et al. (1999) Zhu, M., Seaquist, E. R., Davoust, E., Frayer, D. T., & Bushouse, H. A. 1999, AJ, 118, 145