Intrinsic colors and ages of extremely red elliptical galaxies at high redshift
Abstract
In order to know the formation epoch of the oldest elliptical galaxies as a function of mass and observed redshift, a statistical analysis for 333 extremely red objects (EROs) classified as old galaxies (OGs) at is carried out. Once we get and at rest for each galaxy, we calculate the average variation of this intrinsic color with redshift and derive the average age through a synthesis model (the code for the calculation of the age has been made publicly available). The average gradient of the color at rest of EROs/OGs is 0.07–0.10 Gyr-1 for a fixed luminosity. The stars in these extremely red elliptical galaxies were formed when the Universe was Gyr old on average. We have not found a significant enough dependence on the observed redshift and stellar mass: , Gyr. This fits a scenario in which the stellar formation of the objects that we denominate as EROs-OGs is more intense at higher redshifts, at which the stellar populations of the most massive galaxies form earlier than or at the same time as less massive galaxies.
1 Introduction
It is usually sustained that galaxies at high redshift are intrinsically bluer than at low redshift (e.g., Dickinson et al. 2003; Rudnick et al. 2006; Labbé et al. 2007), as would expected if their populations were younger and with lower mass/luminosity ratios. However, analysis of this intrinsic color evolution is not free from caveats, due mainly to the difficulty in disentangling selection effects. For instance, Dickinson et al. (2003, Fig. 2) showed a clear lack of red objects between with , while there were many of these red objects at ; so they consequently claimed that there is an evolution in color. However some red galaxies were probably missed in that analysis. As a matter of fact, if we take the subsample of old elliptical galaxies without extinction () with from Miyazaki et al. (2003) ( galaxies) we find that all of them have with an average of 3.6. Miyazaki et al.’s galaxies are much redder than Dickinson et al.’s, which shows that the Dickinson et al. (2003) sample does not contain the reddest galaxies.
On the question of the ages of galaxies and when were they formed, there also some uncertainties. There are many observations at different redshifts of galaxies nearly as old as the Universe, although the density of those galaxies at high redshift is significantly lower (Renzini 2006; Abraham et al. 2007). Early-type massive galaxies with early formation were found at (di Serego Alighieri et al. 2006; 2007), (Spinrad et al. 1997; Daddi et al. 2005; Longhetti et al. 2005; Toft et al. 2005; Trujillo et al. 2006), (Daddi et al. 2005; Labbé et al. 2005; Cassata et al. 2008, Kriek et al. 2008, 2009), (Toft et al. 2005; Chen & Marzke 2004), (Chen & Marzke 2004; Rodighiero et al. 2007) and (Wiklind et al. 2008). Most of this information is obtained from photometry, but there are also some spectra massive elliptical galaxies at (Cimatti et al. 2008, Kriek et al. 2009) revealing them to be old galaxies. Semi-analytical CDM models (De Lucía et al. 2006) claim that the formation of low mass galaxies is first to give way to mergers of very massive galaxies, which is apparently at odds with observation of these massive galaxies at high redshift, even if they were formed through dry mergers in a downsizing scenario. Ferreras et al. (2009) also found that very massive galaxies do not have significant evolution at . However, Schiavon et al. (2006), who have taken spectra of red galaxies () at , derived their age to be on average 1.2 Gyr, which means that some galaxies were formed at lower redshifts. Arnouts et al. (2007) also show evidence for a major build up of the red sequence between and .
In this paper, we pay further attention to the determination of intrinsic color and age variation for different redshifts in a statistical way for two different samples of very red elliptical galaxies in order to constraint their formation epoch.
2 Data
We select galaxies classified as Extremely Red Objects (EROs) within the redshift range and, within this group, those classified as Old Galaxies (OGs) with negligible intrinsic extinction; that is, passively evolving populations of elliptical galaxies. The different methods of selecting OGs are quite consistent with each other (Fang et al. 2009). Galaxies will be selected with available fluxes in the three near infrared filters (JHK), plus at least two filters in the optical for which the flux signal/noise is greater than 3. We use two sources of publicly available data:
-
1.
ECDFS catalog (Taylor et al. 2009a), which gives photometry in ten filters: U, U38, B, V, R, I, z’, J, H, Ks from ISAAC(VLT)+Hubble data. For the selection of EROs-OGs, we adopt the color criterion (EROs), (Fang et al. 2009). We do not have the magnitude at but we get this with the corresponding color correction using the adjacent filters. A total of 276 galaxies.
-
2.
Miyazaki et al. (2003) give photometry in eight filters: B, V, R, i’, z’, J, H, Ks from Subaru/XMM-Newton+UH2.2m. Their sample of EROs-OGs was selected using (EROs), and within these sources, by means of spectrum fitting, as OGs without extinction with a fraction of old population . A total of 57 galaxies.
Estimating roughly the average intrinsic color/age of EROs/OGs is our aim here. The term “ERO” reflects the observed characteristic color of a galaxy, not its intrinsic properties. For this reason, and because of using magnitude-limited samples, they have different ranges of stellar masses, M/L ratios and intrinsic colors at different redshifts. It is not a homogeneous sample of galaxies with the same intrinsic characteristics at all redshifts; there are biases. Nonetheless, throughout the paper we shall separate the dependence on redshift from the dependence on luminosity/mass.
3 Color at rest
We take AB apparent magnitudes, corrected for Galactic extinction (although negligible), for different wavelengths, , , for , with the corresponding error bars (in our case in optical and near infrared). As has already been said, we consider only the points with a flux signal/noise above 3. We will use data with available redshifts, most of them photometric. The average systematic error of the photometric redshifts is for ECDFS (Taylor et al. 2009a, §7.3), which is small, so we do not take it into account here; similarly for the Miyazaki sample. There is a statistical error for each photometric redshift, but we expect that these uncertainties will nearly cancel in the statistical analysis.
With this, we calculate the rest luminosities in two filters. This is done through spectral energy distribution (SED) fitting using templates of galaxies with the software Interrest v2.0 (Taylor et al. 2009a). The calculations for the sample ECDFS have already been carried out by Taylor et al. (2009a). The calculation for Miyazaki et al. (2003) was carried out by us with the Interrest v2.0 software, by changing to the Subaru filters. In this paper, we do the calculations only with a pair of filters at rest (Johnson B and V), applying the correction to convert AB into the Vega calibration: (Frei & Gunn 1994). The color is not used in this paper because it is more sensitive to redshift uncertainties and uncertainties in the emission-line corrections (Rudnick et al. 2006). Moreover, the color depends more strongly than on metallicity for a given age; it is also more sensitive to -enhancement (Cassisi et al. 2004).
There are uncertainties in the rest color, due to the error bars of the apparent magnitudes, the deviation of the assumed shape from the true SED (spectral features which move through the filter bands), errors in the photometric redshifts, etc. In any case, we do not expect important systematic errors, and the statistical errors can be reduced when we calculate the average for bins with a large number of galaxies.
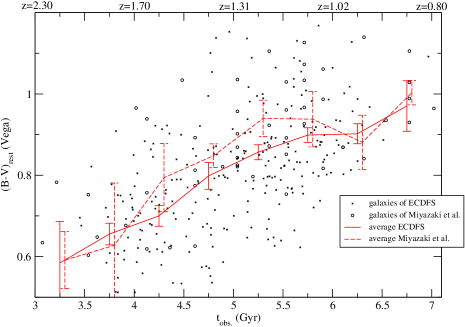
In Fig. 1, we give the results of the average colors as a function of the age of the Universe when the galaxy is observed,
| (1) |
with km/s/Mpc, , . Both samples give approximately the same results; thus the selection of OGs among EROs is shown to be quite consistent with both independent methods. There is a significant average gradient in color of and Gyr-1 respectively for samples ECDFS and Miyazaki et al.
Note that the galaxy gap in the lower right corner of Fig. 1 is at least partially an artifact of the sample intrinsic color bias as a function of the redshift. This is expected because at the lowest redshift, the and limits used will pick out only the very oldest and reddest galaxies, whereas, at higher redshifts, younger and bluer galaxies will be included. Note even that at the very lowest redshifts in Fig. 1 the much smaller Miyazaki sample dominates; this is because the ECDFS criterion is a bit more strigent, so it eliminates even the oldest passive galaxies at . One must therefore interpret Fig. 1 as the intrinsic color as a function of redshift of the objects selected as EROs/OGs, not of a general characterization for elliptical galaxies.
If we do a bi-linear fit of the colors as a function of two independent variables and , we get:
| (2) |
with , , for ECDFS; , , for Miyazaki. This bi-linear fitting allows us to separate the evolution from the biases in absolute magnitudes; so the second term (0.084 or 0.087) gives us the average evolution in color for a fixed luminosity. Galaxies are redder for lower observed redshift and for lower luminosity. The first fact indicates older galaxies at lower redshift, and the second fact is probably related to a higher luminosity for younger populations. Other authors, for instance Labbé et al. (2007) have found however that the most luminous galaxies have redder colors, with a slope of (Labbé et al. 2007). Our guess is that we do not find the same luminosity dependence because we have preselected massive galaxies with the constraint that they be EROs/OGs, and within a different range of redshifts. In Taylor et al. (2009b, Fig. 4), we see that is negative for ; however, the trend changes for and this variation of average color with absolute magnitude is null or even slightly positive.
4 Age estimation for early-type galaxies
NOTE: A FORTRAN code to carry out the calculations explained in this section is available at http://www.iac.es/galeria/martinlc/codes.html
As has been said, we have selected old massive elliptical galaxies with negligible internal extinction, i.e. without gas and dust. We can therefore connect the color and luminosity in V-rest of the galaxy with the average age of the stellar population and its metallicity. There may be some wrong identification of OGs among our galaxies selected with the color method for the ECDFS sample (Miyazaki et al. 2003 and Fang et al. 2009 estimate it to be %), and consequently there may be some case of dusty galaxies among our ECDFS sample, but the statistical comparison with the SED fitting method of the Miyazaki et al. sample in Fig. 1 shows that there are neither significant differences nor systematic effects with redshift. Only perhaps in the range might there be some small difference, where the starburst contamination might be higher (Fang et al. 2009).
In order to estimate the average age corresponding to our galaxies, we use a synthesis model: Vazdekis et al. (1996; hereafter V96); see also Vazdekis (1999). There is an age–metallicity degeneracy, but this can be broken approximately with the use of the mass–metallicity correlation. Another way to break the degeneracy would be by using two colors (Li & Han 2007, and references therein), but we have only one reliable color at rest and we do not have rest near-infrared colors as necessary in Li & Han (2007).
We must also bear in mind that synthesis models return the mean value of a distribution, and a perfect fit to observational data to infer the age is only correct on average, since the individual cases may present some dispersion with respect to the average (Cerviño & Luridiana 2006). For this reason, and because of the large errors in the color of each galaxy, we do not calculate the age of each galaxy separately but the average age of each bin of galaxies (11 in our case) with the same redshift.
For each bin of galaxies, the steps are as follows:
-
1.
We assume zero metallicity and derive the age () of the galaxy which is given by the V96 model for the given of the galaxy.
-
2.
Given the age and the zero metallicity, we derive with the V96 model the stellar mass-to-light ratio in the V filter [].
-
3.
Since we know the luminosity at rest in the V filter (), we can derive the stellar mass of the galaxy:
(3) -
4.
Given the stellar mass of the galaxy, we estimate the metallicity . We use the correlations of metallicity and -enhancement given by Thomas et al. (2005). The average relation is:
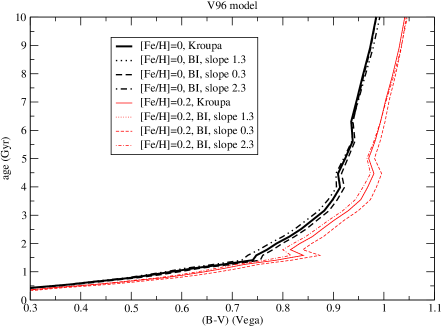
(4) with and uncertainty of including the scatter of the correlations and the variations with the environment (low or high densities) of the galaxies. The correlation of mass (or velocity dispersion) with metallicity is also observed in Yamada et al. (2007). There is also a dependence on age, but it is only important for low mass galaxies of velocity dispersion less than 100 km/s (Yamada et al. 2007), which is not the case of our galaxies. It is assumed that the relationship of mass and metallicity does not evolve with redshift in a passive evolution (di Serego Alighieri et al. 2006). A metallicity evolution in galaxies of the same mass is not observed (Cimatti et al. 2008) so, provided that mass does not correlate with the age, the mass–metallicity relationship should not change too much at high redshift. As is observed in Fig. 2, the accuracy in the metallicity determination mainly affects the reddest (oldest) galaxies. For the youngest galaxies ( Gyr) the errors in metallicity are not very important, so a possible evolution in the relationship of Eq. (4) at high redshift would not affect the results.
-
5.
We derive again the age with the color and metallicity .
-
6.
We repeat steps 2–5, which gives an age . Since , we do not need to do further iterations and we have got the convergence of the metallicity, mass and age with only three iterations. If were significantly different from , we would continue to iterate to get , ,… until the convergence is obtained.
There is some dependence with the IMF (initial mass function) slope. In Fig. 2, we plot age vs. color for metallicities and and different slopes in the bimodal IMF, as defined in V96, or Kroupa IMF using V96 model. Slope 1.3 in the bimodal IMF is the standard value and is nearly coincident with the Kroupa case. Within variations of of the slope the variations of the age are fitted from Fig. 2 for null metallicity by:
| (5) |
These variations produce some error in the age determination. However, this error is smaller than that produced by the uncertainty in the color or the metallicity. In any case, they are taken into account.
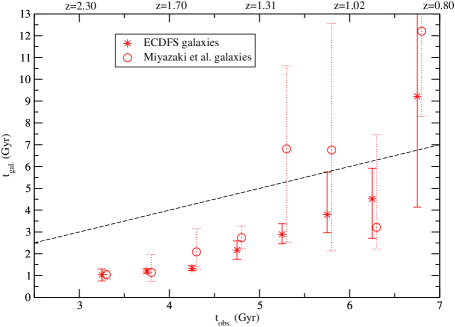
The age of the early-type galaxies is plotted in Fig. 3. The vertical bars include the errors due to uncertainties in the colors, the uncertainty of 0.11 in the mass-metallicity relationship of Eq. (4) and the variations due to the IMF slope change within a range of given by Eq. (5). There is no zero-point calibration problem except perhaps for the last bin because this affects mainly galaxies older than 5 Gyr (Vazdekis et al. 2001). We must also bear in mind that we are neglecting the systematic errors in the photometric redshifts; were they non-negligible, we would have extra systematic errors in the calculated ages.
Figure 3 represents the average age of the given sample among the ERO/OGs, with all the selection effects associated with each redshift. If we separate the dependence on mass from its evolution, subdividing each redshift bin into sub-bins with different luminosity (), and we do over them a bilinear fit weighted with the square inverse of relative errors, both for average color and average age, we get
| (6) |
| (7) |
with and in units of Gyr, in units of ; , , , , , for ECDFS; and , , , , , for Miyazaki. Average stellar masses in the bins range between and . Kriek et al. (2008) found in the same range of redshifts a Gyr-1 for the red sequence at a given mass of M⊙, equivalent (with ; V96 at [Fe/H]=0, ) to Gyr-1, a smaller color evolution but for larger masses than our sample.
5 Discussion on their formation epoch
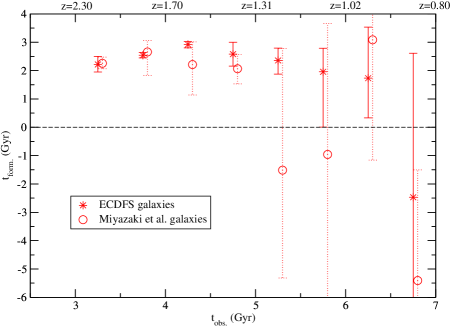
The average epoch of star formation (the epoch of formation of the first stars, might be lower) is , shown in Fig. 4. Separating the evolution from the mass dependence,
| (8) |
with , , on average for the ECDFS+Miyazaki samples. The observed EROs/OGs are all formed within a narrow range of epochs, when the Universe was less than 4 Gyr old (). The present fit is compatible with all EROs/OGs formed at the same time at, on average, Gyr (). Again, we remind the reader that the criterion to select EROs/OGs is more restrictive at lower redshift, picking out only very old galaxies, while at higher redshift the range of allowed ages is wider. We might therefore expect that the oldest EROs at high (low ) will have an even lower formation age. The age Gyr is a conservative lower limit representing the average sample; there must be some EROs/OGs formed beforehand. Given that for a given stellar mass, this means that the galaxies of the present sample are not formed continuously with the same rate, but more intensely at higher redshifts.
The stellar populations of most massive galaxies are not formed much later than the less massive ones (). This agrees the results mentioned in the introduction that very massive evolved galaxies detected at redshifts 1.5–6 were formed in the very early Universe (Daddi et al. 2005: Chen & Marzke 2004; Rodighiero et al. 2007; Wiklind et al. 2008). This might appear in contradiction with the result of §3 that galaxies are redder for lower luminosities, but it does not. As said, the mass–luminosity ratio does not remain constant giving higher luminosity for younger objects so it is not contradictory that older/redder objects correspond to lower luminosities and higher masses. It is in fact observed if we compare Figs. 4 and 5 of Taylor et al. (2009b) for : clearly, a strong dependence on stellar mass does not mean a strong dependence on luminosity.
Acknowledgments: I thank the anonymous referee for helpful comments in correcting and improving this paper, to A. Vazdekis (IAC) for helpful suggestions on the use of his V96 model and comments on a draft of this paper, and to T. J. Mahoney (IAC) for proof-reading this paper. The author was supported by the Ramón y Cajal Programme of the Spanish Ministry of Science.
References
- (1) Abraham, R. G., Nair, P., McCarthy, P. J., et al. 2007, ApJ 669, 184
- (2) Arnouts, S., Walcher, C. J., Le Fèvre, O., et al. 2007, A&A 476, 137
- (3) Cassata, P., Cimatti, A., Kurk, J., et al. 2008, A&A 483, L39
- (4) Cassisi, S., Salaris, M., Castelli, F., & Pietrinferni, A. 2004, ApJ 616, 498
- (5) Cerviño, M., & Luridiana, V. 2006, A&A 451, 475
- (6) Chen, H.-W., & Marzke, R. O. 2004, ApJ 615, 603
- (7) Cimatti, A., Cassata, P., Pozzetti, L., et al., 2008, A&A, 482, 21
- (8) Daddi, E., Renzini, A., Pirzkal, N., et al. 2005, ApJ 626, 680
- (9) De Lucía, G., Springel, V., White, S. D. M., Croton, D., & Kauffmann, G. 2006, MNRAS 366, 499
- (10) di Serego Alighieri, S., Bressan, A., Pozzetti, L. 2007, in: From Stars to Galaxies: Building the Pieces to Build Up the Universe (ASP Conf. Ser. 374), A. Vallenari, R. Tantalo, L. Portinari, A. Moretti, ASP, S. Francisco, Eds, p. 449
- (11) di Serego Alighieri, S., Lanzoni, B., Jorgensen, I. 2006, ApJ 647, L99. Erratum at: 2006, ApJ 652, L145
- (12) Dickinson, M., Papovich, C., Ferguson, H. C., Budavári, T. 2003, ApJ, 587, 25
- (13) Fang, G.-W., Kong, X., & Wang, M. 2009, Res. Astron. Astrophys. 9, 59
- (14) Ferreras, I., Lisker, T., Pasquali, A., Khochfar, S., & Kaviraj, S. 2009, MNRAS 396, 1573
- (15) Frei, Z., & Gunn, J. E. 1994, AJ 108, 1476
- (16) Kriek, M., van der Wel, A., van Dokkum, P. G., Franx, M., & Illingworth, G. D. 2008, ApJ 682, 896
- (17) Kriek, M., van Dokkum, P. G., Labbe, I., Franx, M., Illingworth, G. D., Marchesini, D., & Quadri, R. F. 2009, ApJ 700, 221
- (18) Labbé, I., Franx, M., Rudnick, G., et al. 2007, ApJ 665, 944
- (19) Labbé, I., Huang, J., Franx, M., et al. 2005, ApJ 624, L81
- (20) Li, Z., & Han, Z. 2008, MNRAS 385, 1270
- (21) Longhetti, M., Saracco, P., Severgnini, P., et al. 2005, MNRAS, 361, 897
- (22) Miyazaki, M., Shimasaku, K., Kodama, T., et al. 2003, PASJ 55, 1079
- (23) Renzini, A. 2006, ARA&A 44, 141
- (24) Rodighiero, G., Cimatti, A., Franceschini, A., Brusa, M., Fritz, J., & Bolzonella, M. 2007, A&A 470, 21
- (25) Rudnick, G., Labbé, I., Förster Schreiber, N. M., et al. 2006, ApJ 650, 624
- (26) Schiavon, R. P., Faber, S. M., Konidaris, N., et al. 2006, ApJ 651, L93
- (27) Spinrad, H., Dey, A., Stern, D., Dunlop, J., Peacock, J., Jiménez, R., & Windhorst, R. 1997, ApJ 484, 581
- (28) Taylor, E. N., Franx, M., van Dokkum, P. G., et al. 2009a, ApJS 183, 295
- (29) Taylor, E. N., Franx, M., van Dokkum, P. G., et al. 2009b, ApJ 692, 1
- (30) Thomas, D., Maraston, C., Bender, R., & Mendes de Oliveira, C. 2005, ApJ 621, 673
- (31) Toft, S., van Dokkum, P., Franx, M., Thompson, R. I., Illingworth, G. D., Bouwens, R. J., & Kriek, M. 2005, ApJ 624, L9
- (32) Trujillo, I., Feulner, G., Goranova, Y., et al. 2006, MNRAS 373, L36
- (33) Vazdekis, A. 1999, ApJ 513, 224
- (34) Vazdekis, A., Casuso, E., Peletier, R. F., & Beckman, J. E. 1996, ApJS 106, 307 (V96)
- (35) Vazdekis, A., Salaris, M., Arimoto, N., & Rose, J. A. 2001, ApJ 549, 274
- (36) Wiklind, T., Dickinson, M., Ferguson, H. C., Giavalisco, M., Mobasher, B., Grogin, N. A., & Panagia, N. 2008, ApJ, 686, 781
- (37) Yamada, Y., Arimoto, N., Vazdekis, A., & Peletier, R. F. 2006, ApJ, 637, 200