COSMIC EVOLUTION OF BLACK HOLES AND SPHEROIDS. IV. THE - RELATION
Abstract
From high-resolution images of 23 Seyfert-1 galaxies at z=0.36 and z=0.57 obtained with the Near Infrared Camera and Multi-Object Spectrometer on board the Hubble Space Telescope (HST), we determine host-galaxy morphology, nuclear luminosity, total host-galaxy luminosity and spheroid luminosity. Keck spectroscopy is used to estimate black hole mass (). We study the cosmic evolution of the -spheroid luminosity () relation. In combination with our previous work, totaling 40 Seyfert-1 galaxies, the covered range in BH mass is substantially increased, allowing us to determine for the first time intrinsic scatter and correct evolutionary trends for selection effects. We re-analyze archival HST images of 19 local reverberation-mapped active galaxies to match the procedure adopted at intermediate redshift. Correcting spheroid luminosity for passive luminosity evolution and taking into account selection effects, we determine that at fixed present-day V-band spheroid luminosity, / . When including a sample of 44 quasars out to taken from the literature, with luminosity and BH mass corrected to a self-consistent calibration, we extend the BH mass range to over two orders of magnitude, resulting in / . The intrinsic scatter of the relation, assumed constant with redshift, is 0.30.1 dex (0.6 dex at 95% CL). The evolutionary trend suggests that BH growth precedes spheroid assembly. Interestingly, the -total host-galaxy luminosity relation is apparently non-evolving. It hints at either a more fundamental relation or that the spheroid grows by a redistribution of stars. However, the high-z sample does not follow this relation, indicating that major mergers may play the dominant role in growing spheroids above .
1 INTRODUCTION
Supermassive black holes (BHs) seem to be ubiquitous in the center of spheroids – elliptical galaxies and classical bulges of spirals (e.g., Kormendy & Richstone, 1995; Ferrarese & Ford, 2005). In the local Universe, tight empirical relations have been found between the mass of the BH () and the properties of the spheroid, i.e. stellar velocity dispersion (Ferrarese & Merritt, 2000; Gebhardt et al., 2000), stellar mass (e.g., Marconi & Hunt, 2003), and luminosity (e.g., Häring & Rix, 2004). The tightness of these relations is surprising, given the very different scales involved – from accretion onto the BH (pc scale), the dynamical sphere of influence of the BH (pc scale) to the size of the spheroid (kpc scale) – and poses a challenge to any theoretical model explaining their origin. In general, the correlations are believed to indicate a close connection between galaxy formation and evolution and the growth of the BH. A variety of theoretical models have been developed to explain the observed relations, involving galaxy mergers and nuclear feedback through quenching of star formation (e.g., Kauffmann & Haehnelt, 2000; Volonteri et al., 2003; Ciotti & Ostriker, 2007; Hopkins et al., 2007; Di Matteo et al., 2008; Hopkins et al., 2009b).
Measuring the evolution with redshift of these correlations constrains theoretical interpretations and provides important insights into their origin (e.g., Croton, 2006; Robertson et al., 2006; Hopkins et al., 2007). For quiescent galaxies, the biggest challenge is to measure the BH mass, given the pc-scale sphere of influence of the BH which needs to be resolved spatially through either gas or stellar dynamics (see Gültekin et al. 2009 and Graham 2008 for a recent compilation and references therein; for a review see Ferrarese & Ford 2005 and references therein) or from X-ray spectroscopy probing the existence of a central temperature peak of the interstellar medium (e.g., Brighenti & Mathews, 1999; Humphrey & Buote, 2006; Humphrey et al., 2008). With current technology, direct quiescent black hole mass measurements are thus limited to nearby galaxies.
For active galaxies, for which nuclear luminosity is comparable to or larger than that of the host galaxy, the situation is virtually the opposite. Estimating BH masses within a factor of 2-3 is fairly straightforward through empirically calibrated relations based on spectroscopic data measuring the kinematics of the broad-line region (BLR) (e.g., Wandel et al., 1999; Woo & Urry, 2002; Vestergaard, 2002; Vestergaard & Peterson, 2006; McGill et al., 2008). Unfortunately, the active galactic nuclei (AGN) often outshines the host galaxy, making it difficult to disentangle nuclear and host-galaxy light for an accurate measurement of the spheroid luminosity. Also, measuring from stellar absorption lines is hampered by the contaminating AGN continuum and emission lines. Different groups have tackled these problems in distinct ways, e.g. by using the [O III] emission line width as surrogate of (e.g., Shields et al., 2003), or by using gravitational lensing to super-resolve the host galaxies of quasars (e.g., Peng et al., 2006a, b). Our group (Treu et al., 2004; Woo et al., 2006; Treu et al., 2007; Woo et al., 2008) has focused on Seyfert-1 galaxies - for which the nucleus is not as bright as for quasars - at moderate redshifts ( and , corresponding to look-back times of 4-6 Gyrs). The non-negligible stellar light produces strong enough absorption lines to measure from unresolved spectra, as shown by Treu et al. (2004) and Woo et al. (2006, 2008, hereafter Paper I & III). At the same time, high resolution Hubble Space Telescope (HST) imaging allows for an accurate determination of the AGN luminosity (for an unbiased estimate of nuclear luminosity and hence ) and spheroid luminosity (to create the - relation; Treu et al. 2007, hereafter Paper II). We are thus able to simultaneously study both the - and - relations, allowing us to distinguish mechanisms causing evolution in (e.g., dissipational merger events) and (e.g. through passive evolution due to aging of the stellar population, or dissipationless mergers).
Results presented in Paper I, II, and III suggest an offset with respect to the local relationships, which cannot be accounted for by known systematic uncertainties. At a given , in the range 108-109 M⊙, spheroids had smaller velocity dispersion and spheroid mass 6 Gyrs ago (, consistent with recent growth and evolution of intermediate-mass spheroids. Paper II concludes that the distant spheroids have to grow by 60% in stellar mass ( = 0.20 0.14) at fixed black hole mass in the next 4 billion years to obey the local scaling relations if no significant BH growth is assumed, consistent with the relatively low Eddington ratios. Indeed, the HST images reveal a large fraction of merging or interacting systems, suggesting that gas rich mergers will be responsible for the spheroid growth.
Although tantalizing, the results presented in our previous papers suffer from several limitations. Samples were small, and the local comparison sample of Seyferts measured in a self-consistent manner was even smaller than the distant sample, thus contributing substantially to the overall error budget. The limited range in black hole mass was insufficient to determine independently the offset of the scaling relation and its scatter, while taking into account selection effects. If the - and - relations of active galaxies were not as tight as those for quiescent ones, selection effects could be mimicking evolutionary trends (Treu et al., 2007; Lauer et al., 2007; Peng, 2007).
To overcome these limitations, we have now doubled the sample size (from 20 in Paper II to 40 total here) and expanded the covered range of BH masses to lower masses (from / in Paper II to / here). We focus on the resulting BH mass - spheroid luminosity relation. The BH mass - relation will be presented in a separate paper (Woo et al. 2009, in preparation). We also analyze archival HST images of the sample of local Seyferts with reverberation-mapped (RM) in the same way as our intermediate-z objects, to eliminate possible systematic offsets. Finally, we combine our results with data compiled from the literature and treated in a self-consistent manner to extend the redshift range over which we study evolution. For conciseness the three samples will be referred to as “intermediate-redshift” sample, “local” sample, and “high-redshift” sample, respectively.
The paper is organized as follows. We summarize the properties of our intermediate-redshift Seyfert sample, observations, data reduction, and analysis in § 2, 3, and 4. § 5 summarizes the derived quantities, including the derivation of from Keck spectra. In § 6, we describe the local comparison sample consisting of reverberation-mapped AGNs, re-analyzed here, as well as the high-redshift comparison sample taken from the literature, calibrated for consistency with the other samples. We present our results in § 7, including host-galaxy morphology and merger rates, the evolution of the - relation, a full discussion and treatment of selection effects, and a relation between BH mass and host-galaxy luminosity. We discuss the possible implications of our findings for the origin and evolution of the BH mass scaling relation in § 8. A summary is given in § 9. In Appendix A, we describe Monte Carlo simulations used to probe our analysis and determine errors. Appendix B discusses the choice of the Sérsic index in the adapted 2D surface-brightness fitting procedure. Details on the re-analysis of the HST images of the local RM AGNs are given in Appendix C. Throughout the paper, we assume a Hubble constant of = 70 km s-1 Mpc-1, = 0.7 and = 0.3. Magnitudes are given in the AB system (Oke, 1974).
2 SAMPLE SELECTION
The selection of the sample of intermediate-redshift Seyfert-1 galaxies is similar to the one in Paper I, II, and III, with the goal to extend the sample to (a) lower BH masses at and (b) higher redshifts of . We here briefly summarize the procedure. All objects were selected from the Sloan Digital Sky Survey Data Release 7 (SDSS DR7) archive according to the following criteria: (1) redshift in either the 0.35 0.37 bin or the 0.56 0.58 bin, (2) H equivalent width and Gaussian width 5Å in the rest frame. Objects with were selected to extend the BH mass scaling relations presented in Paper I, II, and III to the low-mass range. They meet the additional criterion (3) as determined from the width of the H line and the luminosity measured from the SDSS spectra and assuming the calibration given by McGill et al. (2008).
For two objects in Paper II (0107 and 1015) the ACS images revealed dust lanes. Thus, Near Infrared Camera and Multi-Object Spectrometer (NICMOS) images were additionally obtained to correct for extinction. Table 1 summarizes the sample properties of all 23 objects.
3 OBSERVATIONS AND DATA REDUCTION
The sample was observed using the NIC2 camera and the broad filter F110W ( -band) of NICMOS on board HST. The 17 objects at = 0.36 were observed for a total exposure time of 2560 seconds per object (11 as part of GO 11208, PI Woo; 6 as part of GO 11341, PI Gallagher); the 6 objects at = 0.57 were observed for a total exposure time of 5120 seconds per object (GO 11208; PI Treu). Four separate exposures were obtained per object, dithering by semi-integer pixel offsets to recover resolution lost to under-sampling and to improve cosmic-ray and defect removal.
The individual exposures were first processed with the NICMOS CALNICA pipeline (Version 4.4.0), and then dither-combined using a custom-made pipeline written in IRAF111IRAF (Image Reduction and Analysis Facility) is distributed by the National Optical Astronomy Observatories, which are operated by AURA, Inc., under cooperative agreement with the National Science Foundation./STSDAS dither package (Version 3.4.2). The pipeline relies on the package drizzle and takes care of aligning the images, removing sky background, correcting for the pedestal effect (the variable quadrant bias present in NICMOS images) using “pedsky”222Note that our fields are quite empty and enough blank sky is available for an accurate determination of sky and pedestal., and the NICMOS non-linearity using “rnlincor”, identifying and removing cosmic rays and defect pixels and finally drizzling all input images together. For our final drizzle iteration we chose a drizzle.pixfrac parameter of 0.9 and a drizzle.scale parameter of 0.5, which resulted in a final scale of 0.038 arcsec/pixel. In Figure 1, postage stamp images of all 23 objects are shown. (We refer the reader to Paper II for the ACS images of those 2 objects in our sample, 0107 and 1015, for which we have both ACS and NICMOS images.)
4 SURFACE PHOTOMETRY
To decompose nuclear and host-galaxy light (spheroid and potentially bar or disk), we used GALFIT, a 2D galaxy fitting program that can simultaneously fit one or more objects in an image choosing from a library of functional forms (e.g., Sérsic, 1968; de Vaucouleurs, 1948, exponential, etc.) (Peng et al., 2002). Decomposition of complex images in multiple components is a difficult statistical challenge due the degeneracies involved, and the highly non-linear dependency of the likelihood on a large number of parameters. To deal with this problem, we develop a methodology based on physical assumptions to reduce the number of free parameters and extensive trial and error exploration of the multidimensional space to avoid local minima of the posterior probability. This section describes our fitting procedure in detail.
4.1 PSF & Noise Image
For convolution with the point-spread function (PSF) of the HST NICMOS optics, and to fit the central point source of the AGN, we created PSFs using TinyTim (Version 6.3). Compared to other cameras onboard HST, TinyTim produces fairly good PSFs for NICMOS (and especially NIC2) because the PSF is less sensitive to aberrations in the infrared (Krist & Hook, 2004); generally, TinyTim PSFs are considered an adequate alternative when well-matched stellar PSFs are not available (Kim et al., 2008).
To minimize PSF mismatch due to spatial distortion, we simulated PSFs at the location of the objects. We created a library of 17 PSFs using a wide range of different stellar templates (F6V to K7V) and power-law functions ( with to in increments of 0.5) at the four different chip positions of the individual exposures of the science targets. These four images were then dither-combined using the same procedure as for the science targets. To account for breathing, we additionally created PSF models for the above range with focus values of 5 m around the nominal focus (Rhodes et al., 2007).
We created noise images by dither-combining the necessary extension files provided in the image block (the output of the CALNICA pipeline; see NICMOS data handbook Version 7.0) in the same way as the associated science image.
4.2 Fitting Procedure & Uncertainties
For each object, we assumed the following AGN/host galaxy fitting procedure using GALFIT.333Note that this procedure is in agreement with the one used in Paper II and the comparison is therefore straightforward. We first fitted the central AGN component with a PSF, and thus determined the center of the system, which was subsequently assumed to be common to all components and fixed. We then modeled the spheroid component with a de Vaucouleurs (1948) profile. We carefully checked the images and the residuals for evidence of a disk component and added an exponential disk if required by the images, residuals, and the statistics. The same approach was used to determine the need for an additional bar component, but unlike in Paper II (where seven out of 17 objects required the fitting of a bar), we did not find evidence for a bar in any of the objects in our sample. Neighboring objects were fitted simultaneously. Note that the sky was determined independently and subtracted out during pipeline reduction (see above) which is preferable when using GALFIT, as the sky background is not only degenerate with the extended wing of the galaxy, but it might also be used by GALFIT to compensate a mismatch between intrinsic and fitted galaxy profile (Peng et al., 2002; Kim et al., 2008).
To ensure that the best resulting fit indeed corresponds to the true global minimum of the over the parameter space, we performed a careful inter-comparison between different fits with a variety of initial parameters and combinations of components. Finally, each galaxy was fitted with all PSFs in the library to find the best-fitting PSF and thus, the best-fitting parameters, and to estimate uncertainties due to PSF mismatch. The differences in derived spheroid and PSF magnitudes using different PSFs in our library are small ( mag) and negligible compared to other systematic errors. To understand these systemic errors, we simulated artificial images spanning the same parameter space as our objects and tested how reliably GALFIT can retrieve the different components (see Appendix A). We use the results to estimate our uncertainties and adopt a conservative total uncertainty on the spheroid luminosity of 0.5 mag (i.e., 0.2 dex). The AGN luminosity is uncertain to within 0.2 mag. The dominating error when constructing the BH mass - spheroid luminosity relation is the uncertainty of BH masses from single-epoch measurements, 0.4 dex.
A PSF+spheroid decomposition gives a satisfactory fit to the host galaxies of ten out of the 23 objects (see Table 2). The remaining 13 objects show evidence for a disk component in both the residual image and in the statistics and thus, an additional exponential disk component was added. However, in ten of the 13 objects, the addition of a disk component results in a vanishingly small spheroidal component. In these cases, we fixed the spheroidal half-light radius to the minimum resolvable size of 2.5 pixels (0.1″), as determined by simulations, and consider the measured spheroid luminosity an upper limit. For one object (1501), even fitting a single spheroid component had the same effect.444Note, however, that fitting this source is particularly complicated as it is in the process of merging with a neighboring galaxy. Below, we discuss how we combined these upper limits with informative priors on the spheroid-to-total luminosity ratio for galaxies to estimate spheroid luminosities.
Note that compared to the ACS images studied in Paper II, NICMOS images are less sensitive to a potential disk component, dominated by young, blue stars.555At the same time, NICMOS images have the advantage of being less affected by dust. We cannot exclude to have missed a disk component in some of the objects for which we only fit a spheroidal component. However, this is a conservative approach, i.e. reducing any potential offset in the - relation. This is true in general for our procedure: We only fit a two component model consisting of disk+bulge, if there is irrefutable evidence for a disk component (see e.g. Fig. 1). Without such evidence, using only one component is conservative in the same sense above.
In Figs. 2 and 3, we show surface-brightness profiles derived using the IRAF program “ellipse”, for the data as well as each component that was fitted using GALFIT. As the fitting was done in two dimensions, these figures should be considered as illustrations only, showing the relative contributions of the different components to the total fit as a function of radius. We divide the sample in two groups, based on the quality of the fit: In Fig. 2, we show all objects that were fitted by a resolved spheroid component; in Fig. 3, we show objects with an unresolved spheroid component, i.e. those for which GALFIT ran into the size limit of the spheroid of 2.5 pixels.
4.3 Estimating Spheroid Luminosities from Upper Limits Using Informative Priors
As described above, for ten objects the addition of a disk component resulted in a vanishingly small spheroidal component. For one object (1501), even a single spheroid component had the same effect.666As pointed out before, fitting this source is particularly complicated as it is in the process of merging with a neighboring galaxy. Thus, for these 11 objects, we fixed the spheroidal half-light radius to the minimum resolvable size of 2.5 pixels and inferred an upper limit to the bulge luminosity. The same is true for five objects in Paper II and we thus include them in the analysis described here. In brief, we combine the upper limit on spheroid magnitude with prior knowledge on bulge-to-total luminosity ratios (B/T) as a function of total host-galaxy magnitude. In terms of Bayes’ Theorem, we derive the posterior on B/T by combining our likelihood – in the form of a step function limited to the measured upper limit from GALFIT – with a prior taken from the literature.
The prior is determined from quantitative measurements of the distribution of spheroid-to-total luminosity ratios (Benson et al., 2007), derived for a sample of 8800 galaxies from SDSS, using the 2D fitting code GALACTICA (Benson et al., 2002). The galaxy redshifts span a range of 0.02 z 0.3 with an average of 0.09. The absolute R magnitudes of these galaxies are comparable to our sample (80% of the Benson et al. (2002) galaxies are within our range of ).777Note that we do not correct for any evolution in luminosity here, as the effect is within the errors.
For each object in our sample, we performed the following steps. First, we selected only objects from Benson et al. (2007), for which the total galaxy magnitude is within 0.5 mag of the Seyfert total host-galaxy magnitude (which is typically accurate to 0.1 mag). Then, we created a histogram over the B/T values of the Benson et al. galaxies within this magnitude range (step size of 0.1) and cut this histogram at the upper limit of B/T we derived for the Seyfert galaxies. Finally, we calculated the mean and sigma of the remaining B/T values and used this value to derive the spheroid luminosity for the Seyfert galaxies. In Fig. 4, we show the prior, likelihood, and posterior distribution functions for all 16 objects. The upper limit and mean posterior B/T ratio is also shown.
4.4 Dust Correction
For two objects (0107 and 1015), the ACS F775W images studied in Paper II reveal dust lanes in the host galaxy, preventing an accurate measurement of the AGN and spheroid luminosity from the ACS images alone. Thus, NICMOS F110W images were obtained, which we use here for dust correction. Briefly, the color excess is measured from the two colors and used to correct for dust extinction assuming an extinction law. The procedure we adapt is similar to the one described in Koopmans et al. (2003).
First, we deconvolved the ACS image using the ACS PSF from Paper II and a Lucy-Richardson algorithm (IRAF program “lucy”). Then, the F775W image was rotated to match the orientation of the NICMOS image and drizzled to the same pixel scale. We assume that the centroids are unaffected by the dust lane – an assumption supported by the distribution of the dust seen in the images – and we thus centered both images on their peaks. In the next step, the F775W image was convolved by the NICMOS PSF (IRAF program “imconvolve”) to match the resolution of the F110W image. Then, a color map was created from the ratio of these matched images and the intrinsic color was assumed to correspond to the minimum of the color and to be spatially uniform. Finally, the color excess was converted into extinction assuming , (corresponding to rest-frame F814W), and (corresponding to rest-frame F555W). The extinction-corrected NICMOS image was used for fitting with GALFIT.
5 DERIVED QUANTITIES
5.1 Rest-Frame V-Band Luminosities
We applied correction for Galactic extinction, assuming and (Schlegel et al., 1998). The values for were taken from Schlegel et al. (1998). The F110W AB magnitudes were transformed to rest-frame optical bands by performing synthetic photometry on an early-type galaxy template spectrum, a procedure traditionally referred to as k-correction. The template spectrum initially has arbitrary units, and these units were adjusted so that the synthetic observed frame F110W magnitudes match the magnitudes from our photometry. We then evaluated the V-band magnitudes at the rest-frame of the template; luminosities were determined by correcting for the distance modulus given our adopted cosmology. The errors on extinction and rest-frame transformation are a few hundredths of a magnitude. We note that the F110W band roughly corresponds to the R and I bands for our two intermediate-redshift samples; considering the small scatter in the red colors of bulges (that is, the V-R and V-I colors) we are able to determine robust estimates of the V-band magnitude. We estimate an uncertainty of 0.05 mag (using the scatter in 20 single stellar population templates with ages ranging from 2 Gyr to 8 Gyr).
5.2 Luminosity Evolution
To allow a direct comparison of the observed relation in the more distant universe and local samples, we evolved the spheroid luminosity according to the evolution measured from the evolution of the fundamental plane by Treu et al. (2001):
| (1) |
This corrects pure passive luminosity evolution, i.e. the decrease in spheroid luminosity due to an aging stellar population. We used the same correction for our intermediate-z Seyfert sample and for the local RM AGNs which will be discussed in § 6.1. However, equation 1 is only valid below and an equivalent measurement is not available at higher redshift. Therefore, for the high-z sample we adopt a conservative correction based on the predicted evolution for a maximally old stellar population (see § 6.2).
5.3 Black Hole Mass
As in Paper I, II, and III of this series, black hole masses were estimated using the empirically calibrated photo-ionization method (e.g., Wandel et al., 1999; Vestergaard, 2002; Woo & Urry, 2002; Vestergaard & Peterson, 2006; McGill et al., 2008, for a detailed discussion see Paper II). Briefly, the method (sometimes called the “virial” method) assumes that the kinematics of the gaseous region in the immediate vicinity of the BH, the broad line region (BLR), traces the gravitational field of the BH. The width of the broad emission lines (e.g. H) gives the velocity scale, while the BLR size is given by the continuum luminosity through application of an empirical relation found from reverberation mapping (RM) (e.g., Wandel et al., 1999; Kaspi et al., 2000, 2005; Bentz et al., 2006). Combining size and velocity gives the BH mass, assuming a dimensionless coefficient of order unity to describe the geometry and kinematics of the BLR (sometimes known as the “virial” coefficient). This coefficient can be obtained by matching the - relation of local active galactic nuclei (AGNs) to that of quiescent galaxies (Onken et al., 2004; Greene & Ho, 2006). Alternatively, the coefficient can be postulated under specific assumptions on the geometry and kinematics of the BLR. We note that the exact value of the virial factor does not affect our results since the relative offset between local and higher redshift AGNs should be independent of the virial factor.
We use the following formula which includes calibrations of the BLR size-luminosity relation (after subtraction of host galaxy light; Bentz et al. 2006) and a virial coefficient taken from Onken et al. (2004):
| (2) |
with the second moment of the broad H emission line and the observed nuclear luminosity at 5100Å.
To obtain the 5100Å continuum luminosity of the AGN, we extrapolated the extinction-corrected PSF AB magnitude in F110W to restframe 5100Å, assuming the power law . The power-law index -0.50.15 is the average derived for the majority (24/40) of our sample from SDSS photometry in the restframe wavelength range 5000Å-6600Å (as covered by SDSS for z=0.36) after subtraction of host-galaxy light contribution (Szathmary et al., in preparation). Within the errors, this slope is in agreement with other studies (see Vanden Berk et al. 2001 and references therein). The uncertainties on the slope lead to an uncertainty of 10% in and 5% in , i.e. negligible compared to the uncertainty of 0.4 dex when deriving BH masses from single-epoch spectra.
The line width was derived from spectra obtained with the Keck telescope, using the longslit spectrograph LRIS to measure the stellar velocity dispersion (see Paper I and Woo et al. 2009, in preparation, for details). We assume a nominal uncertainty of the BH masses measured from single-epoch spectra of 0.4 dex.
Note that we do not correct for possible effects of radiation pressure (e.g., Marconi et al., 2008, 2009, see, however, Netzer 2009). First, the role of radiation pressure on the measurement of BH masses is still discussed controversially and second, neglecting its effects is a conservative approach: If radiation pressure does affect the motion of the BLR clouds, not taking it into account would lead to an underestimation of the BH mass. Thus, including radiation pressure, the observed offset would further increase.
All results are summarized in Table 2. In addition to the 23 objects in the sample studied here, we give the results for the sample in Paper II, which changed slightly (0.15 mag) due to a small error in the extinction correction in Paper II (consequently, also the derived BH masses changed slightly). Also, we determined spheroid luminosities for those objects in Paper II that only had upper limits by applying the informative prior. Moreover, Paper II used the B-band luminosity of the spheroid component (for comparison with inactive galaxy samples in the local Universe). We here give the V-band luminosity of the spheroid component.
6 COMPARISON SAMPLES
6.1 Local Comparison Sample
Interpreting the - relation for the distant Seyfert samples studied here and any possible evolution with redshift requires a robust local baseline – ideally of Seyfert galaxies with comparable BH masses and spheroid luminosities to avoid selection biases as much as possible. The most appropriate local comparison sample for our study is the reverberation-mapped sample of 35 AGN hosts. This sample has the great advantage that the BH mass is derived directly via RM and does not depend on the BLR size-luminosity relation and its uncertainties. A detailed analysis of HST images of the RM sample to derive AGN and spheroid luminosities was recently completed by Bentz et al. (2009b). However, a comparison with our study is not straightforward due to their very different approach which aims to get the best estimate of AGN-to-host-galaxy luminosity ratio. In particular, while we use the simplest decomposition possible, i.e. PSF, spheroid (modeled as simple de Vaucouleurs (1948) profile) plus possible exponential disk, Bentz et al. (2009b) allow the Sérsic index to vary, sometimes include more than one PSF for the same galaxy (to compensate for PSF mismatch), and up to three different spheroid components.
We thus decided to perform an independent analysis of the HST archival images, for a homogeneous treatment of all the data, using the same approach as for our distant Seyfert galaxies. Our robust subsample of the RM AGNs consists of 19 objects (10 PG quasars and 9 Seyfert-1 galaxies). In Appendix C, we summarize the details of the analysis, and show, that our results are in overall agreement with those of Bentz et al. (2009b). However, the spheroid luminosities we derive are often brighter than in Bentz et al. (2009b), especially in those cases where we fit a spheroid component only and not spheroid+disk as in Bentz et al. (2009b), since we did not find evidence for a disk component.
As for the more distant sample, we correct for passive luminosity evolution to zero redshift (§ 5.2). This is important as the most massive black holes in the RM sample are systematically found at higher redshift (up to z=0.29, look-back time 3.3 Gyrs), which changes the best fit - with respect to that presented by Bentz et al. (2009a, b), who did not take luminosity evolution into account.
To compare our local relation to that of Bentz et al. (2009a), we fitted the data using the BCES algorithm (Akritas & Bershady, 1996), which takes into account the effects of errors on both coordinates using bivariate correlated errors. Following Bentz et al. (2009a), we adopt the bootstrap of the BCES bisector value with = 1000 iterations. We give the different fits in Table 4 in the form of
| (3) |
However, in line with the Bayesian approach followed in this paper, instead of using the BCES fitting routine to determine our standard local baseline, we apply our own fitting routine. Following standard procedures, gaussian errors on both variables are taken into account. The intrinsic scatter is a free parameter and is modeled as a gaussian distribution. Uniform priors are assumed on each free parameter. The inferred slope and intercept after marginalizing over the intrinsic scatter are given in Table 4. As can be seen, the resulting slope can range from = 0.67 to = 0.81, depending on the evolutionary correction and on the fitting technique.
For comparison, we transformed the B-band magnitudes of the local inactive comparison sample from Marconi & Hunt (2003) (group 1 only) to V-band (assuming an elliptical template and B-V=0.96 mag; Fukugita et al. 1995). Using again our linear fitting routine including gaussian errors and intrinsic scatter gives a steeper slope of =1.110.13 (K=0.070.08; scatter=0.380.07). For a discussion of the difference in slope between AGN sample and inactive galaxy sample, see Bentz et al. (2009a).
6.2 High-z Comparison Sample
To study the evolution of the - relation, we selected a high-redshift comparison sample from Peng et al. (2006b), consisting of a total of 31 gravitationally lensed quasars and 20 non-lensed quasars at redshifts of 0.66 4.5. It includes 15 non-lensed (radio-loud and radio-quiet) quasars taken from the literature (Kukula et al., 2001; Ridgway et al., 2001). We exclude four objects which were also excluded from the analysis in Peng et al. (2006b), one object, for which the BH mass is only a lower limit888Assuming Eddington-limited accretion (PSS 2322+1944), as well as two extreme outliers in with high uncertainties (B2045+265 and HE 2149-2745), leaving us with a sample of 44 QSOs (17 non lensed and 27 lensed objects). BH masses were estimated from single epoch spectra using the broad lines C IV, Mg II, or H. The luminosity was derived from two-dimensional surface brightness fitting (GALFIT). Note that the Peng et al. (2006b) measurements comprise the total host-galaxy luminosity instead of spheroid luminosity alone, as only one component was fitted. However, there is no evidence for any of the objects to have two components, indicating that the host galaxies are ellipticals. (Note that even if there was a disk component present, fitting only one component is a conservative approach in the sense that the offset from the local relation is the smallest.)
To allow for a homogeneous treatment of the data, we corrected the BH mass estimation based on the Mg II line for normalization differences using the recipe by McGill et al. (2008). Note that for H and C IV, Peng et al. (2006b) used a comparable normalization factor and the difference is negligible. For objects for which both C IV and Mg II measurements are available, we use the latter line, as determining based on the former may have larger uncertainties: The C IV line is often found to be blueshifted with a strong blue excess asymmetry indicating an outflow component (see e.g. Baskin & Laor, 2005).
To correct for luminosity evolution, but lacking direct determinations of passive evolution out to these redshifts, we apply a conservative evolution correction based on maximally old stellar populations. Specifically, we assume that the single burst occurred at . We use a Salpeter initial mass function with solar metallicity and stellar populations synthesis models from Bruzual & Charlot (2003) to compute the evolutionary correction.999We used an Sbc template for obtaining V-band rest-frame magnitudes (instead of an elliptical template used for the intermediate- and low-z sample), as it is closer to the colors predicted by our model. Note that assuming a younger stellar population which might be present (e.g. Martel et al., 1999; Canalizo & Stockton, 2001; Evans et al., 2001; Scoville et al., 2003; Kauffmann et al., 2003; Sánchez et al., 2004; Tadhunter et al., 2005; Canalizo et al., 2006; Barthel, 2006; Jahnke et al., 2007) – for example due to triggering of SF from a merger event that also triggered the AGN activity – we would infer faster passive evolution and therefore more pronounced evolution in at fixed present-day luminosity. Thus, our approach is conservative.
7 RESULTS
7.1 Host-Galaxy Morphology And Merger Rates
From the final reduced images (see Fig. 1), we derive the overall host-galaxy morphology. At least five of the 23 objects show a clear large spiral disk (0804, 1043, 1046, 1352, 2340) and one object has an extended disk-like structure (1007). Including the sample from Paper II, a significant fraction of the host galaxies (15/40) have morphologies of Sa or later.
In the NICMOS images, seven objects show evidence for tidal interactions and merging such as tidal tails and other morphological disturbances (0934, 1021, 2158, 0155, 0342) or nearby companions connected by tidal features (1501, 1526). Half (3/6) of the objects at z=0.57 show signs of mergers/interactions (0155, 0342, 1526). In some cases, it is difficult to clearly distinguish between the presence of a spiral disk and tidal tails; we cannot exclude the presence of a tidally disrupted disk (e.g. 1352, 0342). Combined with the objects in Paper II, 13 of 40 objects show some sign of tidal disturbance. When considering only objects at z=0.36, 10/34 objects are in apparently disturbed systems (0.290.1). This agrees with the fraction of disturbed systems found for a control sample of GOODS galaxies: Selecting all galaxies within GOODS with comparable stellar luminosity and a redshift range of and performing the same visual classification lead to 12/42 disturbed systems (0.28 0.08; Paper II). This fraction is somewhat larger than observed in the local universe (e.g., Patton et al., 2002, see, however, Tal et al. 2009).
7.2 BH Mass - Spheroid Luminosity Relation
The resulting - relation is shown in Fig. 5 (upper left panel). Objects with signs of tidal interaction or merger are marked by open black circles; they are not significant outliers. In the upper middle panel of Fig. 5, the high-z sample is included. Fig. 5 (upper right panel) shows the distribution of the residuals in with respect to the fiducial local relation. If we treat the intrinsic scatter of the relation as a free parameter and marginalize over it, the offset we derive with respect to the local relation (solid black lines in Fig. 5, upper left panel) is = 0.14 0.07 0.20 (statistical and systematic error; w.r.t. including the full sample at both and ). For comparison, in Paper II we found = 0.51 0.14 0.19 (i.e. when considering only the blue data points in Fig. 5, upper left panel). Although the numbers are consistent within the errors, we note that they cannot be compared directly due to the radically different selection function in , for the two samples (see § 7.3). Expressed as offset in spheroid luminosity, = -0.19 0.08 0.21.
Studying the evolution with redshift of the offset in BH mass, with respect to the fiducial local relation, we fit a linear relation of the form and include the intrinsic scatter in as a free parameter. We assume negligible errors on the redshifts and a standard error of 0.4 dex for . We find = . Note that this fit does not take into account systematic errors nor selection effects. Adding the higher redshift comparison sample from Peng et al. (2006b), we extend our redshift baseline, decreasing the error on the slope, resulting in = (Fig. 6, left panel). We also plot the evolution as a function of look-back time (Fig. 6, right panel). However, we stress that the figures and the fits discussed in this section are for illustration only as they ignore selection effects. The correct quantitative results taking into account selection effects are given in § 7.3.
Note that without correction for passive luminosity evolution, there is little to no offset for any of the distant objects. A similar result has already been found by Peng et al. (2006b), who show that host galaxies harboring BHs of the same mass were as luminous at a redshift out to =4.5 as they are today, up to 12 Gyrs later (see also Decarli et al., 2009).
7.3 Selection Effects
As discussed in Paper II, by selecting targets based on their nuclear properties and in particular on the presence of a broad line AGN, we may be biasing our inferred offset (see also Lauer et al., 2007), an effect analogous to the Malmquist (1924) bias. The magnitude and sign of the bias depends on the errors, on the selection function, on the spheroid luminosity function and on the intrinsic scatter of the correlation with host-galaxy luminosity. Here, we exploit the larger sample to correct the offset and infer for the first time the intrinsic scatter of the relation. The slope is assumed to be fixed to the local value, given that the dynamic range of the data is not sufficient for an independent determination of its evolution.
Briefly, we use a Monte Carlo approach to simulate the observations including selection effects and compute the likelihood and posterior distribution function as a function of the two free parameters: slope of the relation = at fixed zero redshift spheroid luminosity, and intrinsic scatter of the - relation which is assumed to be non evolving. First, we populate the local - correlation according to the spheroid luminosity function taken from Driver et al. (2007) (their Table 1, Sample “Ellipticals + bulges”). Second, for each value of the free parameters and , and for each object in the distant sample, we generate a simulated observed sample, assuming gaussian errors on both axes, with amplitude equal to the observational errors. Third, we model the selection effect by hard thresholds in , as appropriate for each sample: For the initial samples of Seyferts introduced in Papers I and II, as well as for the sample at , we adopt the interval [7.5,9] (lower and upper value of ); for the sample introduced here – which was selected to have small black hole masses and was thus restricted to 8.2 – we use [7.5,8.2]; for the high-z sample we assume [7.5,10]. It is important to notice that both the upper and lower limits are relevant for the analysis, as they bias the results in opposite directions. For each object in the distant sample, we select simulated objects with consistent spheroid luminosity within the error, generate a one dimensional simulated distribution in , and compute the likelihood. To compute the posterior, we adopt a uniform prior on and two choices of prior for : i) uniform, appropriate when the parameter is unknown but believed to be of order unity; and ii) , as determined by Gültekin et al. (2009) for a local sample of inactive galaxies. The latter is the most informative prior, although it comes with the price of assuming that the scatter of the - relation is the same for active and inactive galaxies. The results are shown in Fig. 7. If the high-z sample is included, is well determined regardless of the assumed prior on . For a uniform prior on , the inferred scatter is 0.30.1 dex (0.6 dex at 95% CL). If the high-z sample is not included, the baseline in redshift is not sufficient to determine and simultaneously for a uniform prior. Adopting the prior by Gültekin et al. (2009) to break the degeneracy, we find =2.81.2. This is consistent with the trend observed for the complete sample although the bounds are weaker due to the smaller baseline in redshift.
When excluding those 16 objects in our sample for which we estimated spheroid luminosities from upper limits using informative priors (§ 4.3), we obtain =1.30.3 (including the high-z sample) and =1.81.4 (without the high-z sample using the same prior as above), i.e. consistent within the errors. If we exclude all objects for which was estimated based on the C IV line (which may be more uncertain; § 6.2), the evolution is less well constrained, since half of the high-z objects are excluded. Using again a prior on as above, it results in =1.10.3. The slope also gets shallower when using the local inactive galaxy sample from Marconi & Hunt (2003) (group 1 only, transformed to V-band magnitude, see § 6.1): =0.90.2.
7.4 BH Mass - Host-Galaxy Luminosity Relation
We calculate the total host-galaxy luminosity for both our intermediate-redshift Seyfert sample and the local RM AGNs and show the - relation in Fig. 5 (lower left panel). Note that, for consistency and lack of additional information, we assume the same k-correction template and passive luminosity evolution for the total host galaxy as for the spheroid luminosity (see § 5.2). Conservatively, we also assume the same error on the total luminosity as on the spheroid luminosity of 0.5 mag, although, generally, the error on the total luminosity is smaller.
Compared to the - relation, the - relation is apparently non-evolving: If we again treat the intrinsic scatter of the relation as a free parameter and marginalize over it, the offset we derive with respect to the local relation (solid black lines in Fig. 5, lower left panel) is = -0.03 0.09 0.04 (w.r.t. ; including the full sample at both and ). Expressed as offset in spheroid luminosity, = 0.04 0.09 0.04.
The best fit to the local RM AGNs (black solid line in Fig. 5, lower left panel) gives a marginally steeper slope than for the - relation ( vs ; Table 4). Overplotting the high-z comparison sample (Fig. 5 lower middle panel), their luminosity remains the same as in the upper middle panel: The objects were fitted by Peng et al. (2006b) by only one component (without any evidence of a second component) and thus =. Apparently, the high-z comparison sample does not follow the same - relation, instead the offset remains. The distribution of the residuals in of the distant AGNs with respect to this fiducial local relation is shown in Fig. 5 (lower right panel).
8 DISCUSSION
8.1 The role of mergers
Theoretical studies generally invoke mergers to explain the observed scaling relations between BH mass and host-galaxy spheroid properties – a promising way to grow both spheroid and BH. In a simple scenario, spheroids grow by (i) the merging of the progenitor bulges (assuming that both progenitors have a spheroidal component), (ii) merger-triggered starbursts in the cold galactic disk, and (iii) by transforming stellar disks into stellar spheroids (e.g., Barnes, 1992; Mihos & Hernquist, 1994; Cox et al., 2004), thus increasing the spheroid luminosity and stellar velocity dispersion. The fueling of the BH, on the other hand, is triggered by the merger event as the gas loses angular momentum, spirals inward and eventually gets accreted onto the BH, giving rise to the bright AGN or ’quasar’ period in the evolution of galaxies (e.g., Kauffmann & Haehnelt, 2000; Di Matteo et al., 2005). Eventually, if BHs are present in the center of both progenitor galaxies, they may coalesce. In such a simple scenario, an evolution in the BH mass - spheroid luminosity relation is not necessarily expected: Both spheroid and BH grow from the same gas reservoir, and bulge stars added to the final spheroid followed the BH mass - spheroid luminosity relation prior to merging, so the relation will be preserved when the BHs coalesce. However, while mergers provide a way to grow both spheroids and BHs, they may do so on very different timescales. Moreover, the merger history of galaxies varies, depending e.g. on formation time and environment. Different types of merger, for example with a different relative role of dissipation (e.g., Hopkins et al., 2009) have different effects on the growth of spheroid and BH: For a gas-rich major merger between an elliptical galaxy and a spiral galaxy - the latter without a (massive) BH – the bulge grows more efficiently than the BH by the disruption of the stellar disk (Croton, 2006).
In general, our images of the intermediate-z Seyfert galaxies support the merger scenario (see Fig. 1 and § 7.1). However, objects with evidence for merger/interaction do not form any particular outliers in the BH mass - spheroid luminosity relation (Fig. 5). This may not be too surprising: For those objects for which we still see two separate galaxies in the process of merging, we fitted both separately and the bulge luminosity of the AGN host has not yet increased from the process of merging. Other objects with signs of interaction may be in a later evolutionary stage where the bulge luminosity has already increased and thus, the object falls closer to the local relation. Finally, mergers between similar objects would only move the system parallel to the local relation. In general, the effect of mergers on the measured bulge luminosity of an object depends on the type of the merger, the evolutionary stage of the merger, and the timescales involved to grow spheroid and BH. Such a detailed comparison of merger type and age with theoretical predictions is beyond the scope of this paper, given the small sample of merging objects and the limited information at hand.
Note that the fraction of apparently disturbed systems we find is not higher than that of a comparison sample of inactive galaxies at the same redshift (§7.1). Thus, from our images alone, we cannot infer a causal link between a merger/interaction event and the AGN activity we observe. Instead, “normal” galaxies may have the same merger history, and ongoing interactions are not necessarily predictive of AGN activity. The role of mergers for the fueling of AGNs is debated in the literature (e.g. Sanders et al., 1988; Heckman et al., 1984; Hutchings et al., 1988; Disney et al., 1995; Bahcall et al., 1997; McLure et al., 1999; Canalizo & Stockton, 2001; Dunlop et al., 2003; Floyd et al., 2004; Canalizo et al., 2007; Urrutia et al., 2008; Bennert et al., 2008; Veilleux et al., 2009; Tal et al., 2009). While there is little doubt that mergers are helpful, they are certainly not a sufficient condition, considering the numerous inactive interacting galaxies.101010However, this might also be due to the timescales involved, with the signs of interaction outliving the AGN activity (see also the case of present-day Type II AGNs; Choi et al. 2009, e.g.). Also, mergers may be necessary for the high-luminosity QSOs only while for Seyfert galaxies, secular evolution through processes such as bar instabilities may be the dominant effect in the evolution of these galaxies. We will come back to this issue in § 8.3.
8.2 BH Mass - Spheroid Luminosity Relation
Combining results of low-z, intermediate-z and high-z AGNs, treated in a self-consistent manner, we can estimate the intrinsic scatter of the - scaling relation and correct evolutionary trends for selection effects. We discuss scatter and evolution in the next two subsections.
8.2.1 Scatter of -
The intrinsic scatter we find (0.30.1 dex; 0.6 dex at 95% CL) is non-negligible. However, we assume the intrinsic scatter of the - relation to be non evolving. While it would be desirable to directly study the evolution of the scatter with redshift, this requires a larger sample than the one we have at hand. Actually, we might expect a larger intrinsic scatter at higher redshifts, given the different ways and timescales involved when growing spheroids and BHs through mergers. Indeed, for the local Universe, the observed tightness in the relations has been a challenge for theoretical studies. It has been explained by self-regulated models of BH growth (Hopkins et al., 2009b) in which the energetic feedback of the AGN eventually halts accretion, preventing the BH from further growth and quenches star formation (e.g., Ciotti & Ostriker, 1997, 2001; Silk & Rees, 1998; Murray et al., 2005; Di Matteo et al., 2005; Sazonov et al., 2005; Hopkins et al., 2005; Springel et al., 2005; Di Matteo et al., 2008).
Also, a significant fraction of the host galaxies of both our local RM AGN sample (9/19) and our intermediate-z sample (15/40) are prominent late-type spirals of type Sa or later which have been found to have a larger intrinsic scatter than elliptical galaxies (e.g., Gültekin et al., 2009, for the - relation: 0.44 dex when including all galaxies vs. 0.31 for elliptical galaxies only). As already discussed in paper II, the intermediate-z late-type spirals may eventually fall on the local relation later, through merging, in line with “downsizing” (e.g. Cowie et al., 1996; Brinchmann & Ellis, 2000; Kodama et al., 2004; Bell et al., 2005; Noeske et al., 2007): Less massive, blue galaxies merge at later times and arrive at the local relation by becoming larger, bulge-dominated red galaxies. Also, at least some spiral galaxies may not have classical bulges, but pseudobulges which are characterized by surface-brightness profiles closer to exponential profiles, ongoing star formation or starbursts, and nuclear bars or spirals. It is generally believed that they have evolved secularly through dissipative processes rather than being formed by mergers (see e.g. review in Kormendy & Kennicutt, 2004). BHs have been found to reside in galaxies without classical bulges which may not follow the same scaling relations (e.g., Greene et al., 2008).
8.2.2 Evolution of - with redshift
To generalize our results and to facilitate comparison with theoretical and observational works, it is useful to estimate the evolution of the - spheroid stellar mass relation. We can convert the observed evolution of - spheroid luminosity into that between and spheroid mass, if we assume that – after correction for luminosity evolution – the mass-to-light ratio does not change from sample to sample111111Unfortunately, spatially resolved color information for a more sophisticated estimation of the stellar mass of the bulge is currently not available.. Under this assumption, an offset of at fixed equals that at fixed and thus, / .
We are now in a position to make a broad range of comparisons. In the literature, the BH mass evolution is discussed quite controversially. Shields et al. (2003) study the - relation out to , estimating from H and from [O III] and find that the QSOs and their host galaxies follow the local relation. (Note, however, that using [O III] as a surrogate for can be problematic as [O III] is known to often have an outflow component; for a discussion see e.g. Greene & Ho (2005); Komossa & Xu (2007).) A similar conclusion has been reached by Shen et al. (2008) who study over 900 broad-line AGNs out to from SDSS. Adelberger & Steidel (2005) use the correlation length of 79 quasar hosts at to estimate the virial mass of the halo and the C IV line width and UV flux at 1350Å to estimate . When comparing the resulting - relation to the local one (Ferrarese, 2002), they find no evidence for evolution. In particular, they can rule out evolution of the form / with at 90% CL, given their error bars.
Other observational studies find the same trend in evolution as we do, i.e. that BHs are too massive for a given bulge mass or velocity dispersion at higher redshifts (Walter et al., 2004; Shields et al., 2006; McLure et al., 2006; Peng et al., 2006b; Salviander et al., 2007; Weiss et al., 2007; Riechers et al., 2008, 2009; Gu et al., 2009). McLure et al. (2006), for example, study radio-loud AGN () and find /. Peng et al. (2006b), whose data, treated in a consistent manner to match our data set, are included in this study, rule out pure luminosity evolution and find that the ratio between and was four times larger at than today. For 89 broad-line AGNs between in the zCOSMOS survey, Merloni et al. (2009) find /. However, this fit refers to the total host galaxy instead of the spheroid component alone. At least some galaxies will have a non-negligible disk fraction, which, when taken into account, would result in a larger offset (see also Jahnke et al., 2009). For a sample of 100 quasars selected to reside in elliptical hosts, Decarli et al. (2009) estimate that / was 8 times larger at than today, i.e. /. The evolution we find is also consistent with our previous results, within their much larger errors: / from the - relation in Paper II, whose data are included here, and from the - relation in Paper III.
From a theoretical perspective, the discussion on the evolution of the BH mass scaling relations is not any less controversial. Shankar et al. (2009), for example, use the local velocity dispersion function (VDF) of spheroids, together with their inferred age distributions, to predict the VDF at higher redshifts. Using the - relation with a normalization allowed to evolve with redshift (), they infer the BH mass density and compare it to the accumulated BH mass density derived from the time integral of the AGN LF. They find a mild redshift evolution (), excluding at more than 99% CL (with the possibility of a stronger evolution for the more massive BHs). Another study using fully cosmological hydrodynamic simulations of CDM following the growth of galaxies and supermassive BHs, as well as their associated feedback processes, finds only limited evolution in with a steepening at z=2-4 (Di Matteo et al., 2008). Merloni et al. (2004) expect a weak evolution of / (1+z)0.4-0.6, when fitting the total stellar mass and star formation rate density as a function of redshift and comparing that to the hard X-ray selected quasar luminosity function, assuming that BHs only grow through accretion. Such a slope is in agreement with work by Hopkins et al. (2009) who combine prior observational constraints in halo occupation models with libraries of high-resolution hydrodynamic simulations of galaxy mergers. Using semi-analytic models, Croton (2006) predicts an evolution of / (1+z)0.4-1.2. A more rapid evolution is predicted by Wyithe & Loeb (2003) who assume a self-regulated BH growth model and find / (1+z)1.5, similar to our observational result.
However, the great advantage of the study presented here are the high-quality images at hand, allowing for a detailed bulge-to-disk decomposition of the host galaxy of the low- and intermediate-z Seyfert-1 galaxies. Combining data from a large sample of active galaxies, covering a redshift range from the local Universe out to z=4.5, all treated in a consistent manner, results in smaller error bars on the predicted evolution than previous studies. Moreover, it allows, for the first time, to correct evolutionary trends for selection effects. The evolution we find (/) is indicative of BH growth preceding host-spheroid assembly.
Still, we did not take into account that the evolution may depend on BH mass (see also Paper III). Indeed, there are theoretical predictions that objects with higher BH (or bulge) masses evolve faster (e.g., Hopkins et al., 2009). For example, Di Matteo et al. (2008) find that when restricting their fits to objects with , the relation has a slope of at z=3-4 and at z=2. Unfortunately, our sample is too small to allow us to address this possibility. There may indeed be some evidence that the offset in BH mass is larger for objects with more massive BHs (Fig. 5, upper left panel and Fig. 6, right panel).
8.3 BH Mass - Galaxy Luminosity Relation
A different scenario seems to emerge when considering the relation between and total host-galaxy luminosity (Fig. 5, lower left panel). This relation is almost non-evolving within the last six billion years.121212Note that there is insufficient information to constrain the intrinsic scatter. Recently, Jahnke et al. (2009) found qualitatively similar results for a small sample of ten AGNs at redshifts between 1 2: They derive host-galaxy masses from colors based on ACS and NICMOS imaging, finding that they lie on the - relation in the local Universe (Häring & Rix, 2004).
Such a non-evolving - relation can be interpreted twofold.
(a) The amount by which some of the more distant objects have to grow their spheroid is already contained within the galaxy itself, and the growth can be achieved by the redistribution of stars, i.e. transforming disk stars into bulge stars. Such a redistribution can be the result of mergers or secular evolution, e.g. bar instabilities (e.g., Combes & Sanders, 1981; van den Bosch, 1998; Avila-Reese et al., 2005; Debattista et al., 2006) and torque-driven accretion (see e.g. review in Kormendy & Kennicutt, 2004) which may coincidentally be also the triggering mechanism for the BH activity we observe (e.g., Shlosman & Noguchi, 1993; Athanassoula et al., 2003; Dumas et al., 2007; Haan et al., 2009). While not every object in the intermediate-z sample will experience a major merger in the last 4-6 billion years, secular evolution is a promising alternative way to grow the spheroidal components in these objects. But even if they do experience a major merger (as indeed evidenced for at least some objects in our sample), the role of the merger depends on the merger type as discussed above (e.g. a merger between similar objects will simply move the system along the local relation). There may again be a dependency on BH mass: For the low-mass objects, the offset becomes almost negative, indicating that in the low-mass range, either the BH is, at the same time, still growing by a non-negligible amount (consistent with the higher Eddington ratio in the low-mass regime131313Of course, we may be biased against low-mass objects with low Eddington ratios.) or that not all of the stellar mass will end up in the spheroid component. Indeed, for local RM AGNs, at least 6/19 objects reside in late-type host galaxies (preferentially those with lower BH masses).
(b) The relation between BH mass and host-galaxy luminosity (or mass) may be the more fundamental one. Indeed, this is predicted by Peng (2007): In his thought experiment, he shows that a tight linear relation between and host-galaxy mass can evolve – if the galaxy mass function declines with increasing mass – due to “a central-limit-like tendency for galaxy mergers, which is much stronger for major mergers than for minor mergers, and a convergence toward a linear relation that is due mainly to minor mergers”. Also, it is possible that BHs in late-type galaxies or galaxies without classical bulges, while not following the same scaling relations as spheroids (see discussion in § 8.2.1), they instead obey a more fundamental relation between BH mass and host-galaxy mass.
However, the relation between host-galaxy luminosity and seems to exist only up to z1: The offset for the high-z comparison sample does not decrease as the luminosity given by Peng et al. (2006b) is already the total host-galaxy luminosity (the same is true also for the results by Merloni et al., 2009; Decarli et al., 2009). Along the line of argument of (a) above, the growth of the spheroid above a redshift of cannot simply be achieved through secular evolution (with quasars being predominantly hosted by ellipticals), but instead, major mergers are needed. A major merger is more likely to happen for the high-z sample given the longer time span. Or, following (b), a relation between BH mass and host galaxy is already at place at , but still evolving at earlier times. However, we cannot exclude that part of the difference is due to the difference in BH mass between the samples, with the high-z objects generally having larger BH masses.
In the end, the discussion boils down to the following question: What is the dominant mechanism that grows spheroids, and does it depend on spheroid mass and/or redshift? This is debated controversially in the theoretical literature. For example, based on their semi-analytic models, Parry et al. (2009) find that the majority of ellipticals and spirals never experience a major merger but rather, that they acquire their spheroid stellar mass through minor mergers or disc instabilities. Hopkins et al. (2009c), on the other hand, combine empirically constrained halo occupation distributions with high-resolution merger simulations, and find that major mergers dominate the formation of bulges and systems with higher B/T, but that lower-mass or lower B/T systems are preferentially formed by minor mergers. They predict that the major merger rate increases with redshift. Qualitatively, we can reconcile such a scenario with our results: Higher-mass objects and those at higher redshifts (i.e. the majority of the high-z sample) form their spheroids preferentially through major mergers and are thus still evolving toward a - relation, while lower-mass and lower-z objects (i.e. our intermediate-z sample) grow their spheroids through minor mergers or disk instabilities that redistribute the stars and thus, they fall on the - relation.
9 SUMMARY
We study the evolution and intrinsic scatter of the BH mass - spheroid luminosity relation, taking into account selection effects, by combining three different samples of AGNs. Our intermediate-redshift sample comprises 40 Seyfert-1 galaxies at two different redshift bins (34 objects at z=0.36, and 6 objects at z=0.57; look-back time 4-6 Gyr) for which we measure the BH mass from single-epoch Keck spectra. The sample spans more than one order of magnitude in BH mass (log /=7.5-8.8). 2D surface-brightness photometry using GALFIT is carried out on high-resolution HST images to decompose the image into AGN and host-galaxy components. The low-z comparison sample consists of 19 local AGNs (; ) with reverberation BH masses (Bentz et al., 2009b). We re-analyzed the archival HST images in a way comparable to our intermediate-z Seyfert galaxies to eliminate possible systematic offsets. Finally, we combine our results with high-z data (44 quasars from 0.66 4.5; ) compiled from the literature, mainly consisting of gravitationally-lensed AGNs (Peng et al., 2006b) that were treated in a self-consistent manner. For all objects, the spheroid luminosity is corrected for passive luminosity evolution. Our main results can be summarized as follows.
-
•
We determine the evolution in with an unprecedented accuracy, taking into account selection effects. Our result, /, indicates that BH growth precedes host-spheroid assembly. The intrinsic scatter, assumed to be non-evolving, is non-negligible (0.30.1 dex; 0.6 dex at 95% CL). It may reflect the different ways and timescales involved when growing spheroids or may partially be due to a high fraction of spirals and/or potential pseudobulges in our sample.
-
•
The local and intermediate-z sample follow an apparently non-evolving -host-galaxy luminosity relation. Either the spheroid grows by a redistribution of stars, or the relation between BH mass and host galaxy is more fundamental. Above , the relation seems to be still forming, e.g. through major mergers.
We are currently studying the evolution of the BH mass - spheroid velocity dispersion relation (Woo et al. 2009, in preparation), which should allow us to tighten the error bars on evolution given that velocity dispersion can be measured more precisely than host luminosity. Studying this independent relation will also enable us to distinguish between different evolutionary scenarios, probe the “fundamental plane” between , , and (e.g., Hopkins et al., 2007), and perform further tests for systematics. Due to the failure of NICMOS in Fall 2008, nine objects at and three objects at were not observed. Instead, we were recently allocated time with WFC3 to complete the full sample of Seyfert-1 galaxies. We will present results for this extended sample in another paper. At the same time, increasing the local AGN comparison sample would be desirable (and indeed an HST proposal for the eight nearest RM AGNs by Bentz et al. is in the queue). Understanding slope and scatter of the local relations for active galaxies is crucial to study their evolution.
References
- Adelberger & Steidel (2005) Adelberger, K. L., & Steidel, C. C. 2005, ApJ, 627, L1
- Akritas & Bershady (1996) Akritas, M. G., & Bershady, M. A. 1996, ApJ, 470, 706
- Andredakis & Sanders (1994) Andredakis, Y. C., & Sanders, R. H. 1994, MNRAS, 267, 283
- Athanassoula et al. (2003) Athanassoula, E. 2003, MNRAS, 341, 1179
- Avila-Reese et al. (2005) Avila-Reese, V., Carrillo, A., Valenzuela, O., & Klypin, A. 2005, MNRAS, 361, 997
- Bahcall et al. (1997) Bahcall, J. N., Kirhakos, S., Saxe, D. H., & Schneider, D. P. 1997, ApJ, 479, 642
- Barnes (1992) Barnes, J. E., 1992, ApJ, 393, 484
- Barthel (2006) Barthel, P. D. 2006, A&A, 458, 107
- Baskin & Laor (2005) Baskin, A., & Laor, A. 2005, MNRAS, 356, 1029
- Bell et al. (2005) Bell E. F. et al., 2005, ApJ, 625, 23
- Bennert et al. (2008) Bennert, N., Canalizo, G., Jungwiert, B., Stockton, A., Schweizer, F., Peng, C. Y., Lacy, M. 2008, ApJ, 677, 846
- Benson et al. (2002) Benson, A. J., Frenk, C. S., & Sharples, R. 2002, ApJ, 574, 104
- Benson et al. (2007) Benson, A. J., Danović, D., Frenk, C. S., & Sharples, R. 2007, MNRAS, 379, 841
- Bentz et al. (2006) Bentz, M. C., Peterson, B. M., Pogge, R. W., Vestergaard, M., & Onken, C. A. 2006, ApJ, 644, 133
- Bentz et al. (2009a) Bentz, M. C., Peterson, B. M., Pogge, R. W., & Vestergaard, M. 2009a ApJ, 694, 166
- Bentz et al. (2009b) Bentz, M. C., Peterson, B. M., Netzer, H., Pogge, R. W., & Vestergaard, M. 2009a, ApJ, 697, 160
- Brinchmann & Ellis (2000) Brinchmann J., Ellis R. S., 2000, ApJ, 536, L77
- Brighenti & Mathews (1999) Brighenti, F., & Mathews, W. G. 1999, ApJ, 527, L89
- Bruzual & Charlot (2003) Bruzual, G., & Charlot, S. 2003, MNRAS, 344, 1000
- Canalizo & Stockton (2001) Canalizo, G., & Stockton, A. 2001, ApJ, 555, 719
- Canalizo et al. (2006) Canalizo, G., Stockton, A., Brotherton, M. S., & Lacy, M. 2006, NewAR, 50, 650
- Canalizo et al. (2007) Canalizo, G., Bennert, N., Jungwiert, B., Stockton, A., Schweizer, F., Lacy, M., & Peng, C. 2007, ApJ, 669, 801
- Ciotti & Ostriker (1997) Ciotti, L., & Ostriker, J. P. 1997, ApJ, 487, L105
- Ciotti & Ostriker (2001) Ciotti, L., & Ostriker, J. P. 2001, ApJ, 551, 131
- Ciotti & Ostriker (2007) Ciotti, L., & Ostriker, J. P. 2007, ApJ, 665, L5
- Choi et al. (2009) Choi, Y.-Y., Woo, J.-H., & Park, C. 2009, ApJ, 699, 1679.
- Combes & Sanders (1981) Combes, F., & Sanders, R. H. 1981, A&A, 96, 164
- Cowie et al. (1996) Cowie L. L., Songaila A., Hu E. M., Cohen J. G., 1996, AJ, 112, 839
- Cox et al. (2004) Cox, T. J., Primack, J., Jonsson, P., Somerville, R. S. 2004, ApJ, 607, L87
- Croton (2006) Croton, D. J. 2006, MNRAS, 369, 1808
- Debattista et al. (2006) Debattista, V. P., Mayer, L., Carollo, C. M., Moore, B., Wadsley, J., & Quinn, T. 2006, ApJ, 645, 209
- Decarli et al. (2009) Decarli, R., Falomo, R., Treves, A., Labita, M., Kotilainen, J. K., & Scarpa, R. 2009, MNRAS, submitted
- de Vaucouleurs (1948) de Vaucouleurs, G. 1948, Ann. d’Astrophys., 11, 247
- Di Matteo et al. (2005) Di Matteo, T., Springel, V., & Hernquist, L. 2005, Nature, 433, 604
- Di Matteo et al. (2008) Di Matteo, T., Colberg, J.,; Springel, V., Hernquist, L., & Sijacki, D. 2008, ApJ, 676, 33
- Disney et al. (1995) Disney, M. J., et al. 1995, Nature, 376, 150
- Driver et al. (2007) Driver, S. P., Allen, P. D., Liske, J. & Graham, A. W. 2007, ApJ, 657, L85
- Dumas et al. (2007) Dumas, G., Mundell, C. G., Emsellem, E., & Nagar, N. 2007 MNRAS, 379, 1249
- Dunlop et al. (2003) Dunlop, J. S., McLure, R. J., Kukula, M. J., Baum, S. A., O’Dea, C. P., & Hughes, D. H. 2003, MNRAS, 340, 1095
- Evans et al. (2001) Evans, A. S., Frayer, D. T., Surace, J. A., & Sanders, D. B. 2001, AJ, 121, 1893
- Ferrarese & Merritt (2000) Ferrarese, L., & Merritt, D. 2000, ApJ, 539, L9
- Ferrarese (2002) Ferrarese, L. 2002, ApJ, 578, 90
- Ferrarese & Ford (2005) Ferrarese, L., & Ford, H. 2005, Space Science Reviews, Volume 116, Issue 3-4, pp. 523-624
- Ferrarese et al. (2006) Ferrarese, L. et al. 2006, ApJS, 164, 334
- Fisher & Drory (2008) Fisher, D. B., & Drory, N. 2008, AJ, 136, 773
- Floyd et al. (2004) Floyd, D. J. E., Kukula, M. J., Dunlop, J. S., McLure, R. J., Miller, L., Percival, W. J., Baum, S. A., & O’Dea, C. P. 2004, MNRAS, 355, 196
- Fukugita et al. (1995) Fukugita, M., Shimasaku, K. & Ichikawa, T. 1995, PASP, 107, 945
- Gallo et al. (2008) Gallo, E., Treu, T., Jacob, J., Woo, J.-H., Marshall, P. J., & Antonucci, R. 2008, ApJ, 680, 154
- Gebhardt et al. (2000) Gebhardt, K. et al. 2000, ApJ, 539, L13
- Gu et al. (2009) Gu, M., Chen, Z., & Cao, X. 2009, MNRAS, 397, 3
- Gültekin et al. (2009) Gültekin, K. et al. 2009, ApJ, 698, 198
- Graham (2001) Graham, A. W. 2001, AJ, 121, 820
- Graham (2008) Graham, A. W. 2008, PASA, 25, 167
- Greene & Ho (2005) Greene, J. E., & Ho, L. C. 2005, ApJ, 627, 721
- Greene & Ho (2006) Greene, J. E., & Ho, L. C. 2006, ApJ, 641, L21
- Greene et al. (2008) Greene, J. E., Ho, L. C., & Barth, A. J. 2005, ApJ, 688, 159
- Haan et al. (2009) Haan, S., Schinnerer, E., Emsellem, E., García-Burillo, S., Combes, F., Mundell, C. G., & Rix, H.-W. 2009, ApJ, 692, 1623
- Häring & Rix (2004) Häring, N. & Rix, H.-W. 2004, ApJ, 604, L89
- Heckman et al. (1984) Heckman, T. M., Bothun, G. D., Balick, B., & Smith, E. P. 1984, ApJ, 89, 7
- Hopkins et al. (2005) Hopkins, P. F., Hernquist, L., Martini, P., Cox, T. J., Robertson, B., Di Matteo, T., & Springel, V. 2005, ApJ, 625, L71
- Hopkins et al. (2007) Hopkins, P. F., Hernquist, L., Cox, T. J., Robertson, B., Krause, E. 2007, ApJ, 669, 45
- Hopkins et al. (2009) Hopkins, P. F., Hernquist, L., Cox, T. J., Keres, D., & Wuyts, S. 2009, ApJ, 691, 1424
- Hopkins et al. (2009b) Hopkins, P. F., Murray, N., Thompson, T. A. 2009, MNRAS, 398, 303
- Hopkins et al. (2009c) Hopkins, P. F., Bundy, K., Croton, D., Hernquist, L., Keres, D., Kochfar, S., Stewart, K., Wetzel, A., & Younger, J. D. 2009, MNRAS, submitted (arXiv:0906.5357)
- Hu (2008) Hu, J. 2008, MNRAS, 386, 4
- Humphrey & Buote (2006) Humphrey, P. J., & Buote, D. A. 2006a, ApJ, 639, 136
- Humphrey et al. (2008) Humphrey, P. J., Buote, D. A., Brighenti, F., Gebhardt, K., & Mathews, W. G. 2008 ApJ, 683, 161
- Hutchings et al. (1988) Hutchings, J. B., Johnson, I., & Pyke, R. 1988, ApJS, 66, 361
- Jahnke et al. (2007) Jahnke, K., Wisotzki, L., Courbin, F. & Letawe, G. 2007, MNRAS, 378, 23
- Jahnke et al. (2009) Jahnke, K., et al. 2009, ApJL submitted (arXiv:0907.5199)
- Kauffmann & Haehnelt (2000) Kauffmann & Haehnelt 2000, MNRAS, 311, 576
- Kauffmann et al. (2003) Kauffmann, G., et al. 2003, MNRAS, 346, 1055
- Kim et al. (2008) Kim, M., Ho, L. C., Peng, C. Y., Barth, A. J., & Im, M. 2008a, ApJS, 179, 283
- Kaspi et al. (2005) Kaspi, S., Maoz, D., Netzer, H., Peterson, B. M., Vestergard, M. & Jannuzi, B. T. 2005, ApJ, 629, 61
- Kaspi et al. (2000) Kaspi, S., Smith, P. S., Netzer, H., Maoz, D., Jannuzi, B. T. & Giveon, U. 2000, ApJ, 533, 631
- Kodama et al. (2004) Kodama T. et al., 2004, MNRAS, 350, 1005
- Komossa & Xu (2007) Komossa, S. & Xu, D. 2007, ApJ, 667, 33
- Koopmans et al. (2003) Koopmans, L. V. E., Treu, T., Fassnacht, C. D., Blandford, R. D., & Surpi, G. 2003, ApJ, 599, 70
- Kormendy & Bruzual (1978) Kormendy, J., & Bruzual, A. G. 1978, ApJL, 223, L63
- Kormendy & Richstone (1995) Kormendy, J., & Richstone, D. 1995, ARA&A, 33, 581
- Kormendy & Kennicutt (2004) Kormendy, J., & Kennicutt, R. C., Jr. 2004, ARA&A, 42, 603
- Krist & Hook (2004) Krist, J. & Hook, R., 2004, The Tiny Tim User’s Guide, Version 6.3
- Kukula et al. (2001) Kukula, M., Dunlop, J. S., McLure, R. J., Miller, L., Percival, W. J., Baum, S. A., & O’Dea, C. P. 2001, MNRAS, 326, 1533
- Lauer et al. (2007) Lauer, T. R., Tremaine, S., Richstone, D., Faber, S. M. 2007, ApJ, 670, 249L
- MacArthur et al. (2008) MacArthur, L. A., Ellis, R. S., Treu, T., U, V., Bundy, K., & Moran, S. 2008, ApJ, 680, 70
- Malmquist (1924) Malmquist, K. G. 1924, Medd. Lund Astron. Obs. II, 32, 64
- Marconi & Hunt (2003) Marconi, A., & Hunt, L. K. 2003, ApJ, 589, L21
- Marconi et al. (2008) Marconi, A., Axon, D. J., Maiolino, R., Nagao, T., Pastorini, G., Pietrini, P., Robinson, A., & Torricelli, G. 2008, ApJ, 678, 693
- Marconi et al. (2009) Marconi, A., Axon, D. J., Maiolino, R., Nagao, T., Pietrini, P., Robinson, A., & Torricelli, G. 2009, ApJ, 698, 103
- Martel et al. (1999) Martel, A. R., et al. 1999, ApJS, 122, 81
- McGill et al. (2008) McGill, K. L., Woo, J.-H., Treu, T., & Malkan, M. A. 2008, ApJ, 673, 703
- McLure et al. (1999) McLure, R. J., Kukula, M. J., Dunlop, J. S., Baum, S. A., O’Dea, C. P., & Hughes, D. H. 1999, MNRAS, 308, 377
- McLure et al. (2006) McLure, R. J., Jarvis, M. J., Targett, T. A., Dunlop, J. S. & Best, P. N. 2006, MNRAS, 368, 1395
- Merloni et al. (2009) Merloni, A., et al. 2009, submitted
- Merloni et al. (2004) Merloni, A., Rudnick, G., & DiMatteo, T. 2004, MNRAS, 354, L37
- Mihos & Hernquist (1994) Mihos, J., C., Hernquist, L. 1994, ApJ, 425, L13
- Murray et al. (2005) Murray, N., Quataert, E., & Thompson, T. A. 2005, ApJ, 618, 569
- Netzer (2009) Netzer, H. 2009, ApJ, 695, 793
- Nipoti et al. (2008) Nipoti, C., Treu, T., & Bolton, A. S. 2008, MNRAS, 390, 349
- Noeske et al. (2007) Noeske K. G. et al., 2007, ApJ, 660, L47
- Oke (1974) Oke, J. B. 1974, ApJS, 27, 21O
- Onken et al. (2004) Onken, C. A., Ferrarese, L., Merritt, D., Peterson, B. M., Pogge, R. W., Vestergaard, M., & Wandel, A. 2004, ApJ, 615, 645
- Parry et al. (2009) Parry, O. H., Eke, V. R., & Frenk, C. S. 2009 MNRAS, 396, 1972
- Patton et al. (2002) Patton, D. R., et al. 2002, ApJ, 565, 208
- Peng (2007) Peng, C. Y. 2007, ApJ, 671, 1098
- Peng et al. (2002) Peng, C. Y., Ho, L. C., Impey, C. D., & Rix, H.-W. 2002, AJ, 124, 266
- Peng et al. (2006a) Peng, C. Y., Impey, C. D., Ho, L. C., Barton, E. J., & Rix, H.-W. 2006a, ApJ, 640, 114
- Peng et al. (2006b) Peng, C. Y., Impey, C. D., Rix, H.-W., Kochanek, C. S., Keeton, C. R., Falco, E. E., Lehár, J., & McLeod, B. A. 2006b, ApJ, 649, 616
- Rhodes et al. (2007) Rhodes, J. D., et al. 2007, ApJS, 172, 203
- Ridgway et al. (2001) Ridgway, S. E., Heckman, T. M., Calzetti, D., & Lehnert, M. 2001, ApJ, 550, 122
- Riechers et al. (2009) Riechers, D. A., Walter, F., Carilli, C. L., & Lewis, G. F. 2009, ApJ, 690, 463
- Riechers et al. (2008) Riechers, D. A., Walter, F., Brewer, B. J., Carilli, C. L., Lewis, G. F., Bertoldi, F., & Cox, P. 2008, ApJ, 686, 851
- Robertson et al. (2006) Robertson, B., Hernquist, L., Cox, T. J., Di Matteo, T., Hopkins, P. F., Martini, P. & Springel, V. 2006, ApJ, 641, 90
- Salviander et al. (2007) Salviander, S., Shields, G. A., Gebhardt, K., & Bonning, E. W. 2007, ApJ, 662, 131
- Sánchez et al. (2004) Sánchez, S. F., et al. 2004, ApJ, 614, 586
- Sanders et al. (1988) Sanders, D. B., Soifer, B. T., Elias, J. H., Madore, B. F., Matthews, K., Neugebauer, G., & Scoville, N. Z. 1988, ApJ, 325, 74
- Sazonov et al. (2005) Sazonov, S. Y., Ostriker, J. P., Ciotti, L., & Sunyaev, R. A. 2005, MNRAS, 358, 168
- Schlegel et al. (1998) Schlegel, D. J., Finkbeiner, D. P., & Davis, M. 1998, ApJ, 500, 525
- Scoville et al. (2003) Scoville, N. Z., Frayer, D. T., Schinnerer, E., & Christopher, M. 2003, ApJ, 585, L105
- Sérsic (1968) Sérsic, J. L. 1968, Atlas de galaxias australes (Cordoba, Argentina: Observatorio Astronomico, 1968)
- Shankar et al. (2009) Shankar, F., Bernardi, M., & Haiman, Z. 2009 ApJ, 694, 867
- Shaw & Gilmore (1989) Shaw, M. A., & Gilmore, G. 1989, MNRAS, 237, 903
- Shields et al. (2003) Shields, G. A., Gebhardt, K., Salviander, S., Wills, B. J., Xie, B., Brotherton, M. S., Yuan, J., & Dietrich, M. 2003, ApJ, 583, 124
- Shields et al. (2006) Shields, G. A., Menezes, K. L., Massart, C. A., & Vanden Bout, P. 2006, ApJ, 641, 683
- Shen et al. (2008) Shen, J., Vanden Berk, D. E., Schneider, D. P., & Hall, P. B. 2008, AJ, 135, 928
- Shlosman & Noguchi (1993) Shlosman, I. & Noguchi, M. 1993, ApJ, 414, 474
- Silk & Rees (1998) Silk, J. & Rees, M. J. 1998, A&A, 331, L1
- Springel et al. (2005) Springel, V., Di Matteo, & Hernquist, L. 2005, ApJ, 620, L79
- Tadhunter et al. (2005) Tadhunter, C., Robinson, T. G., González Delgado, R. M., Wills, K., & Morganti, R. 2005, MNRAS, 356, 480
- Tal et al. (2009) Tal, T., van Dokkum, P. G., Nelan, J., & Bezanson, R. 2009 AJ, 138, 1417
- Treu et al. (2001) Treu, T., Stiavelli, M., Bertin, G., Casertano, S., Moller, P. 2001 MNRAS, 326, 237
- Treu et al. (2004) Treu, T., Malkan, M. A., & Blanford, R. D. 2004, ApJ, 615, L97
- Treu et al. (2007) Treu, T., Woo, J.-H., Malkan, M. A., & Blanford, R. D. 2007, ApJ, 667, 117 (Paper II)
- Urrutia et al. (2008) Urrutia, T., Lacy M., & Becker, R. H. 2008, ApJ, 674, 80
- Vanden Berk et al. (2001) Vanden Berk, D. E. et al. 2001, AJ, 122, 549
- van den Bosch (1998) van den Bosch, F. C. 1998, ApJ, 507, 601
- Veilleux et al. (2009) Veilleux, S. et al. 2009, ApJ, 701, 587
- Vestergaard (2002) Vestergaard, M. 2002, ApJ, 571, 733
- Vestergaard & Peterson (2006) Vestergaard, M. & Peterson, B. M. 2006, ApJ, 641, 689
- Volonteri et al. (2003) Volonteri, M., Haardt, F., Madau, P. 2003, ApJ, 582, 559
- Walter et al. (2004) Walter, F., Carilli, C., Bertoldi, F., Menten, K., Cox, P., Lo, K. Y., Fan, X., & Strauss, M. A. 2004, ApJ, 615, L17
- Wandel et al. (1999) Wandel, A., Peterson, B. M., & Malkan, M. A. 1999, ApJ, 526, 579
- Weiss et al. (2007) Weiss, A., Downes, D., Neri, R., Walter, F., Henkel, C., Wilner, D. J., Wagg, J. & Wiklind, T. 2007, A&A, 467, 955
- Wyithe & Loeb (2003) Wyithe, J. S., B., & Loeb, A., 2003, ApJ, 595, 614
- Woo & Urry (2002) Woo, J.-H., & Urry, C. M. 2002, ApJ, 579, 530
- Woo et al. (2006) Woo, J.-H., Treu, T., Malkan, M. A., & Blandford, R. D. 2006, ApJ, 645, 900 (Paper I)
- Woo et al. (2008) Woo, J.-H., Treu, T., Malkan, M. A., & Blandford, R. D. 2008, ApJ, 681, 925 (Paper III)
Appendix A MONTE CARLO SIMULATIONS
To probe the reliability of GALFIT to derive the AGN and host-galaxy properties accurately and to estimate the systematic uncertainties involved in the fitting, we ran Monte Carlo simulations of a set of different galaxy models. A comparable procedure was carried out by Kim et al. (2008).
In particular, we used GALFIT to simulate galaxies, consisting of (a) PSF plus spheroid, and (b) PSF plus spheroid plus disk using a range of typical galaxy properties of our sample. In both cases, the total magnitude was set to either 18 or 19 mag. For case (a), we assumed the effective radius of the spheroid to be = 4 pix, 6 pix, 8 pix, and an AGN-to-total luminosity ratio of 0.05, 0.1, 0.2, 0.5, 0.8, 0.9, 0.95. In case (b), the effective radius of the spheroid was set to = 3 pix, 4 pix, 6 pix, 8 pix (to additionally probe the lower limit which can be a problem when fitting spheroid plus disk). For an AGN-to-total luminosity ratio of 0.8 (0.5), the spheroid-to-disk ratio was 0.5 (0.2, 0.5), and for an AGN-to-total luminosity ratio of 0.2 and 0.1, a spheroid-to-disk ratio of 0.1, 0.2, 0.5 was used.
Note that this is a conservative approach, focusing on the parameter space for which the detection of the spheroid component is most difficult, i.e. a small spheroid size, a small spheroid-to-disk luminosity ratio and a large AGN-total galaxy luminosity ratio. The galaxies were simulated with a given PSF and noise was added based on a typical observed signal-to-noise (SN) ratio in a Monte Carlo fashion creating 100 artificial images which were then fitted by GALFIT. In a first run, the simulated galaxies were fitted with the same PSF that was used to create the artificial images, in subsequent runs with different PSFs from our PSF library to simulate PSF mismatch.
For case (a), GALFIT can easily recover the sizes and magnitudes, even when the spheroid reaches sizes close to the minimum size that can be resolved given the PSF (here assumed to be 2.5 pixels). In Fig. 8, we show the resulting offsets for the smallest spheroid ( = 4 pix). However, more caution needs to be exercised for a three-component fit (PSF, spheroid, and disk), probed in case (b). In Fig. 9, we show the resulting offsets for the smallest spheroid ( = 3 pix), i.e. the most difficult scenario for retrieving the spheroid parameters accurately. The derived spheroid magnitude can differ up to 0.5 mag in the worst case, while the difference in PSF magnitude is less than 0.2 mag. We adopt these values as conservative measures of our errors, i.e. 0.2 mag for AGN luminosity and 0.5 mag for spheroid luminosity.
As the estimation of errors is the main purpose of this analysis, we do not further discuss the results of these simulations. The overall trend is the same as in Kim et al. (2008), i.e. the scatter in all derived parameters is largest when the AGN is dominant, and when is small and difficult to distinguish from the nucleus or large with low surface brightness. Spheroid-to-disk-to-AGN decompositions are much more difficult than spheroid-to-AGN as they involve 6 additional free parameters (if the spheroid is fitted by a de Vaucouleurs (1948) profile) and can only be done if the S/N is high.
Appendix B CHOICE OF SÉRSIC INDEX
A general profile to fit galaxies is the so-called Sérsic (1968) power law, which is defined as
| (B1) |
where is the pixel surface brightness at the effective radius , and is the Sérsić index. In this generalized form, an exponential disk profile has = 1, a de Vaucouleurs (1948) profile has = 4, and a Gaussian has = 0.5 (which was used in Paper II to fit a bar component). While de Vaucouleurs (1948) profiles are traditionally and widely used to fit spheroidal components, recent studies show that spheroids can have Sérsic indices ranging between 0.5 and 6. Disk galaxies typically have a bulge component with , with classical bulges having and pseudobulges having (Fisher & Drory, 2008). Moreover, there seems to be a relation between the Sérsić index and the spheroid luminosity or host-galaxy luminosity (e.g., Kormendy & Bruzual, 1978; Shaw & Gilmore, 1989; Andredakis & Sanders, 1994; Graham, 2001; Peng et al., 2002; Nipoti et al., 2008; MacArthur et al., 2008).
The objects we are fitting are complex in nature, in particular due to the presence of the AGN, a very luminous point source in the center for which a perfectly matching PSF fit cannot always be achieved. Thus, we cannot use a fit with the Sérsic index as a free parameter, as it would add yet another free component to an already difficult fit and increase degeneracies between PSF, bulge, and disk. Such an approach could easily lead to an unphysical fit, if GALFIT is trying to fit any remaining PSF mismatch with such a component. In such a situation, an alternative approach to estimate the best fitting Sérsic exponent is to use a range of Sérsic indices, keep them fixed at each step and then obtain the best from the resulting the statistics. This approach is generally recommended when attempting galaxy decompositions of faint or difficult to model galaxies like AGN host galaxies (Peng et al., 2002; Kim et al., 2008).
To test the systematic uncertainties in derived spheroid and PSF magnitude depending on the adopted Sérsic index, we re-ran our models using to fit the spheroid component. At each step, we kept fixed to the chosen value but allowed all other parameters to vary, including the disk component. For those objects that were initially (i.e. when using =4) fit by a spheroid component only, we carefully checked the residuals of the resulting best fit for any evidence of an additional disk component. For only one source (1501) is the quality of the fit increased significantly by the addition of a disk component.141414Note, however, that fitting this source is particularly complicated as it is in the process of merging with a neighboring galaxy. Note that using the best-fitting instead of =4 does not in general solve the problem of a a vanishingly small bulge component for some objects. For 11 of the 16 objects discussed in § 4.3, nothing changes. For five objects, the effective radius of the bulge component is no longer smaller than the FWHM of the PSF; however, for two different objects, the bulge component then becomes vanishingly small.
The results are shown in Fig. 10, separating objects for which the host galaxy was fitted by a spheroid component only (left panel) and those for which the host was fitted by a spheroid plus disk component (right panel). While the overall trend is the same, fitting the host galaxy by two components results in a larger scatter because the disk magnitude can also vary. The results can be summarized as follows: Decreasing from 4 to 3 (2, 1, 0.5) decreases the spheroid luminosity – on average by 0.08 (0.23, 0.41, 0.54) mag – and increases the nuclear luminosity – on average by -0.07 (-0.24, -0.37, -0.4) mag. Increasing from 4 to 5 (6) on the other hand increases the spheroid luminosity on average by -0.07 (-0.13) mag and decreases the nuclear luminosity on average by 0.1 (0.22) mag. For all but the most extreme indices, potential systematics related to the choice of Sérsic index are small compared to the adopted uncertainty on the spheroid luminosity (0.5 mag) and on (0.4 dex).
Another approach is to calculate the best Sérsic index we would expect based on the measured host-galaxy magnitude using the relation in Nipoti et al. (2008), derived from surface-photometry of ACS images of the well-defined Virgo cluster sample (Ferrarese et al., 2006; Gallo et al., 2008)
| (B2) |
For the 23 objects studied here, we estimate a Sérsic index ranging from 4.0 to 5.9, on average 4.9 0.5. For the sample studied in Paper II, the Sérsic index ranges from 4 to 6.8, with an average of 5.5 0.6. Within the errors, these values are in agreement with estimates using the relation between Sérsic index and bulge B-band magnitude for a local sample from Graham (2001) (their Figure 14, middle panel). Note that in both cases, the estimated Sérsic index remains the same within the errors when using the host-galaxy luminosity (for n-L relation from Nipoti et al. 2008) or bulge luminosity (for n-L relation from Graham 2008) as derived from the best fit with a free Sérsic index instead of the one derived from =4. As the relation between Sérsic index and host-galaxy magnitude has its own uncertainties and scatter, and as our average value is close to 4, we adopted the simpler solution of fixing to 4 for all objects as our default choice. This also allows a better comparison with other AGN host-galaxy studies.
To ultimately probe the potential systematics related to the choice of Sérsic index, we performed the same analysis as for =4, but this time using the best derived from the procedure described above (i.e. as chosen based on the statistics when performing a variety of fits with fixed to 0.5, 1, 2, 3, 4, 5, 6) both for the intermediate-z and the local sample. The same approach was followed for the local sample of RM AGNs. None of the results stated in the paper change: The resulting fits, offsets, and predicted evolutionary trends remain the same within the errors. More precisely, for the evolution in (/), including selection effects, we obtain (instead of for ) for the full sample with an intrinsic scatter 0.7 dex at 95% CL (0.40.1 dex for a uniform prior on ) and (instead of for ) for the intermediate sample alone, adopting again the prior by Gültekin et al. (2009).
Appendix C SURFACE PHOTOMETRY OF RM AGNs
For an homogeneous treatment of all data, we performed an independent analysis of the HST archival images presented in Bentz et al. (2009b), using the same approach as for our distant Seyfert galaxies (§ 4). Details of the observations can be found in Bentz et al. (2009b).
We disregarded the five objects observed with WFPC2/PC due to the low quality of the data, the PSF mismatch when using a synthetic PSF created by TinyTim and the lack of stellar PSFs on the images. These problems made it difficult to achieve satisfactory fits. The spheroid radius found with GALFIT was either in the lower limit of 2.5 pixels (=FWHM of PSF) – probably because it was fitting a PSF mismatch – or was unphysically large. Thus, we here focus on the ACS/HRC data alone.
From the remaining 30 objects imaged with ACS/HRC, we first excluded all NGC objects (8/30) which are nearby and extended and for which the field-of-view is too small to measure the sky background. Also, they are often affected by dust lanes. The latter is also the case for IC 4239A (plus an unreliable BH mass). For the same reasons, these objects were also excluded in the further analysis by Bentz et al. (2009a). We decided to additionally exclude Fairall 9 due to a dust lane crossing the spheroid and PG0953+414 for which no reasonable fit could be achieved. Thus, our final robust sample consists of 19 objects.
We used the pipeline-processed data and combined them using multidrizzle, to remove cosmic rays and defects and correct for distortion. (Note that multidrizzle takes into account the saturated pixels of the longer exposures and combines the images accordingly.) As the data were not dithered, no improvement of sampling was achieved and the final scale is 0.025 arcsec/pixel (pixfrac=0.9). For these ACS/HRC data imaged in the F550M filter, the PSF created by TinyTim is not as good a match as it is for the NICMOS images. We therefore additionally created a PSF from a star observed in one of the images (Mrk 110) and performed extensive tests to compare their quality. As the TinyTim PSF typically gave a bad fit in the core, but the stellar PSF had too low S/N in the wings, we decided to combine both PSFs (the synthetic PSF for the wings, the stellar PSF in center out to = 2 FWHM), which significantly improved the quality of the fits. This PSF enabled us to fit the AGN with only one PSF without the need of corrections of PSF mismatch (e.g. by using an additional PSF as done by Bentz et al. (2009b)). We used the same criteria as for our distant Seyfert sample to decide whether we need to fit an additional disk component (see § 4). For four objects, Bentz et al. (2009b) fitted both a spheroidal and disk component, while we decided that fitting a spheroidal component alone is sufficient. One object has a saturated PSF (PG1226+023) and we masked out the saturated center to fit the PSF to the wings only. For three objects (Ark 120, Mrk 279, and PG 1211+143), we out-masked the very center of the PSF and fitted the PSF to the wings only due to remaining PSF mismatch.
We compare the results in Fig. 11. For this comparison, we add the different PSF components and the different spheroid components of Bentz et al. (2009b) to a “total” PSF magnitude and “total” spheroid magnitude, respectively. While the PSF and total magnitudes generally agree well, the spheroid magnitudes we derive are often brighter than in Bentz et al. (2009b), especially in those cases where we fit a spheroid component only and not spheroid+disk as in Bentz et al. (2009b) (4 objects).
As for our intermediate redshift sample (see Appendix B), we also calculated the best Sérsic index we would expect based on the measured host-galaxy magnitude using the relation in Nipoti et al. (2008). The average value of =5.2 1.6 is in agreement within the errors with the average derived when using the relation between Sérsic index and bulge B-band magnitude from Graham (2001). It also agrees well with the average estimated for the intermediate-z sample, with a larger scatter due to the larger spread in luminosities. We carefully checked whether when using the best-fitting Sérsic index, there is the need of adding a disk component for those objects for which the host galaxy was originally fitted by a =4 component only; we do not find such evidence in any of the objects.
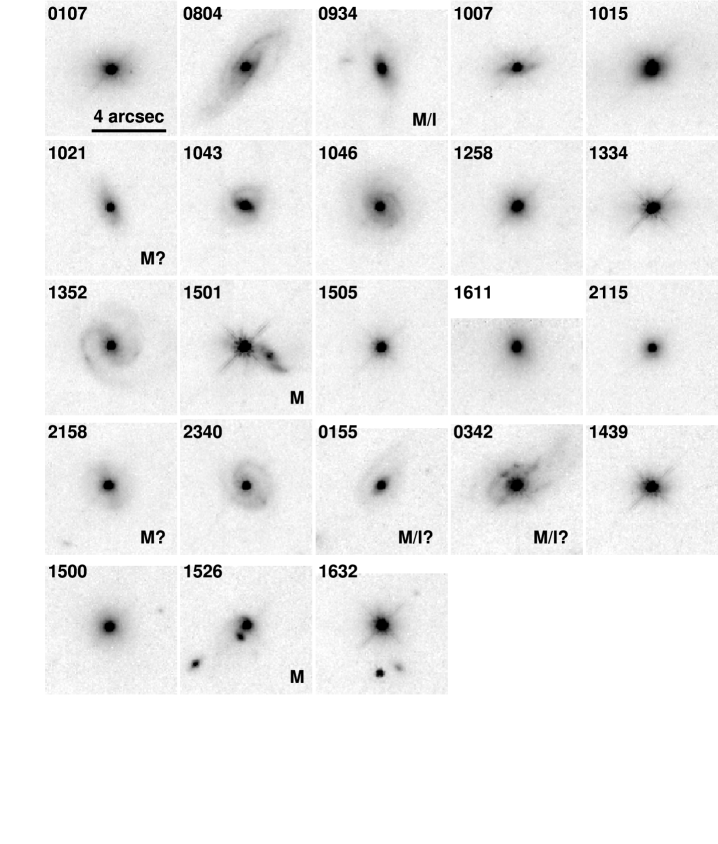
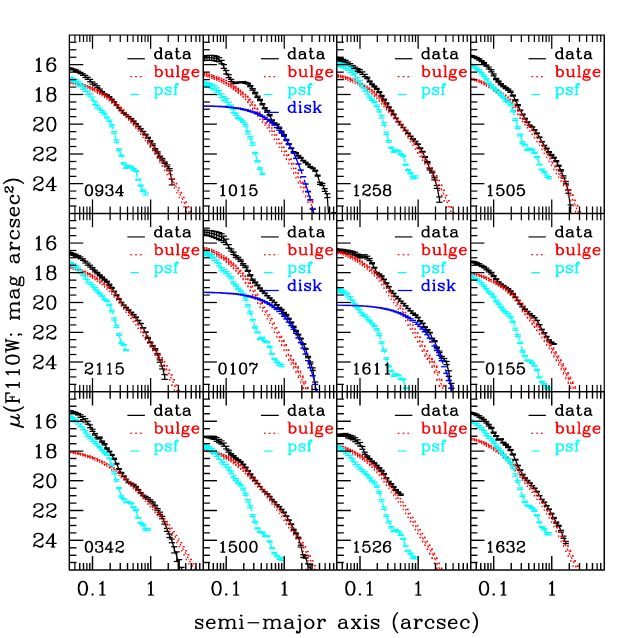
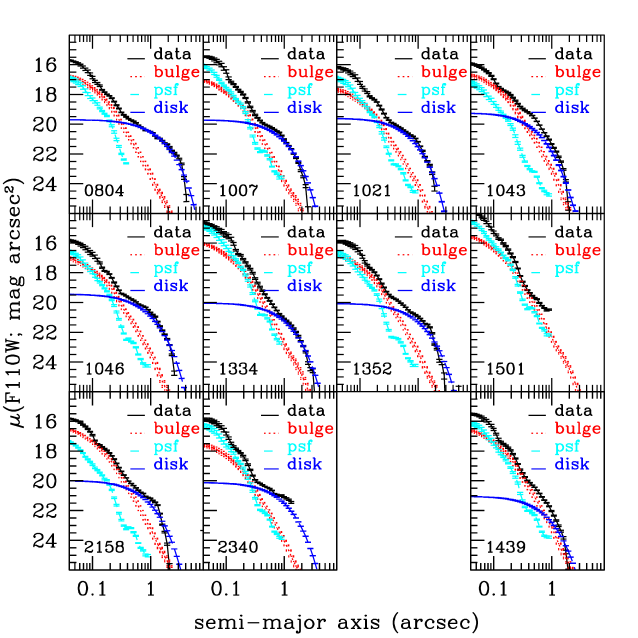
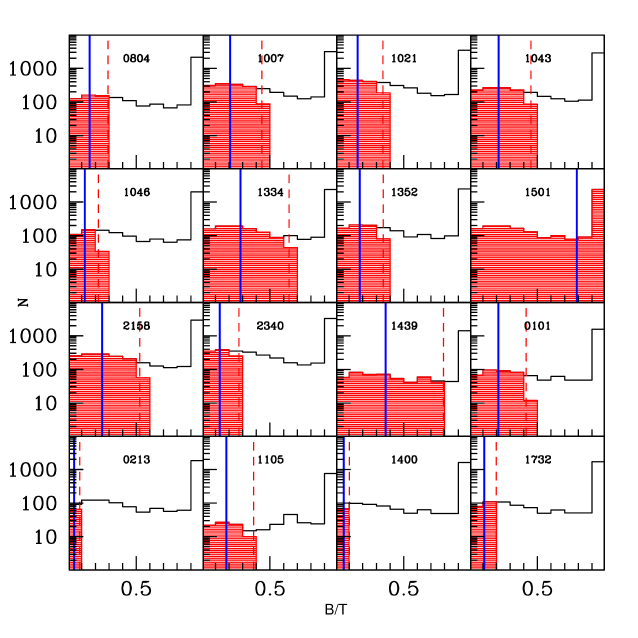
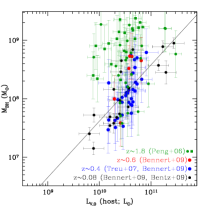
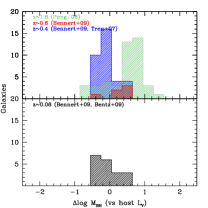
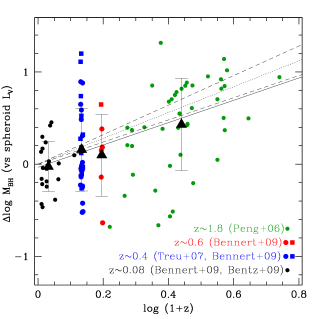
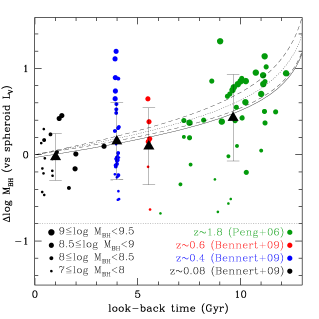
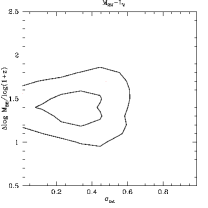
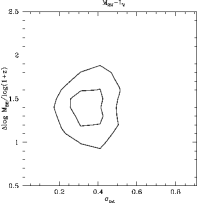
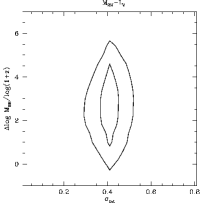
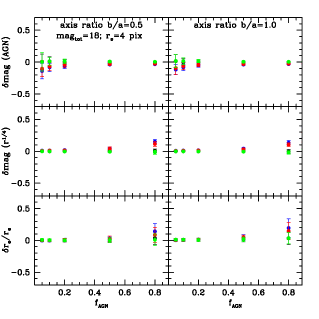
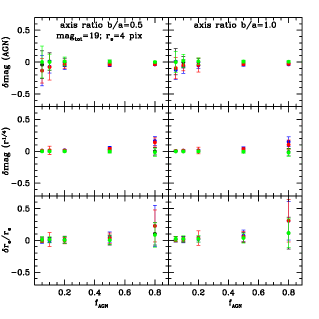
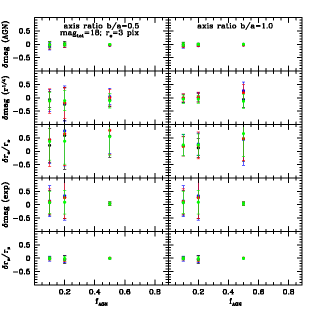
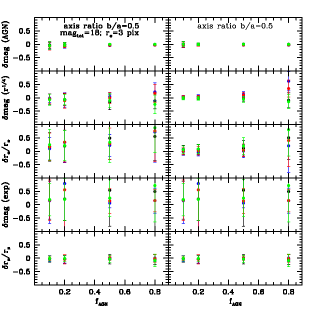
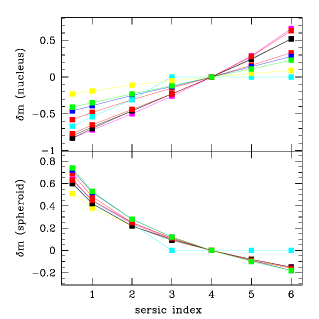
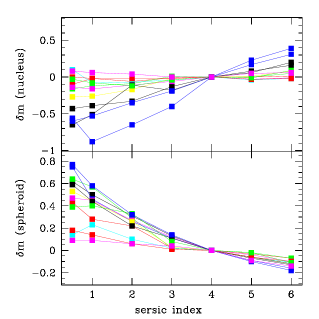


| Name | RA (J2000) | DEC (J2000) | |||
|---|---|---|---|---|---|
| Mpc | mag | ||||
| (1) | (2) | (3) | (4) | (5) | (6) |
| 0107 (S11) | 0.3558 | 1892.9 | 01 07 15.97 | –08 34 29.4 | 18.47 |
| 0804 (SS1) | 0.3566 | 1897.9 | 08 04 27.99 | +52 23 06.2 | 18.55 |
| 0934 (SS2) | 0.3672 | 1964.1 | 09 34 55.60 | +05 14 09.1 | 18.82 |
| 1007 (SS5) | 0.3733 | 2002.5 | 10 07 06.26 | +08 42 28.4 | 18.69 |
| 1015 (S31) | 0.3505 | 1860.0 | 10 15 27.26 | +62 59 11.5 | 18.15 |
| 1021 (SS6) | 0.3584 | 1909.1 | 10 21 03.58 | +30 47 55.9 | 18.92 |
| 1043 (SS7) | 0.3618 | 1930.3 | 10 43 31.50 | –01 07 32.8 | 18.82 |
| 1046 (SS8) | 0.3656 | 1954.1 | 10 46 10.60 | +03 50 31.2 | 18.45 |
| 1258 (SS9) | 0.3701 | 1982.3 | 12 58 38.71 | +45 55 15.5 | 18.56 |
| 1334 (SS10) | 0.3658 | 1955.4 | 13 34 14.84 | +11 42 21.5 | 17.83 |
| 1352 (SS11) | 0.3732 | 2001.8 | 13 52 26.90 | +39 24 26.8 | 18.39 |
| 1501 (SS12) | 0.3625 | 1934.7 | 15 01 16.83 | +53 31 02.4 | 17.80 |
| 1505 (SS13) | 0.3745 | 2010.0 | 15 05 41.79 | +49 35 20.0 | 18.73 |
| 1611 (S28) | 0.3679 | 1968.5 | 16 11 56.30 | +45 16 11.0 | 18.63 |
| 2115 (SS14) | 0.3706 | 1985.5 | 21 15 31.68 | –07 26 27.5 | 19.24 |
| 2158 (S29) | 0.3575 | 1903.5 | 21 58 41.93 | –01 15 00.3 | 18.95 |
| 2340 (SS18) | 0.3582 | 1907.9 | 23 40 50.52 | +01 06 35.5 | 18.50 |
| 0155 (W11) | 0.5634 | 3270.9 | 01 55 16.18 | –09 45 56.0 | 20.09 |
| 0342 (W22) | 0.5648 | 3280.8 | 03 42 29.70 | –05 23 19.5 | 18.70 |
| 1439 (W12) | 0.5623 | 3263.2 | 14 39 55.11 | +35 53 05.4 | 19.02 |
| 1500 (W20) | 0.5753 | 3354.7 | 15 00 14.81 | +32 29 40.4 | 19.60 |
| 1526 (W16) | 0.5782 | 3375.2 | 15 26 54.93 | –00 32 43.3 | 19.99 |
| 1632 (W8) | 0.5703 | 3319.4 | 16 32 52.42 | +26 37 49.1 | 18.70 |
Note. — Col. (1): Target ID (RA: hhmm). In brackets, the name used in other publications. Col. (2): Redshift from SDSS-DR7. Col. (3): Luminosity distance in Mpc, based on redshift and the adapted cosmology. Col. (4): Right Ascension. Col. (5): Declination. Col. (6): Extinction-corrected AB magnitude from SDSS-DR7 photometry (“modelMag_i”).
| Name | Total | Host | Spheroid | / | comp. | |||||
|---|---|---|---|---|---|---|---|---|---|---|
| mag | mag | mag | kpc | 1044 erg s-1 | ||||||
| (1) | (2) | (3) | (4) | (5) | (6) | (7) | (8) | (9) | (10) | (11) |
| 0059+1538 (S09; M) | 18.24 | 18.51 | 19.080.50 | 10.91 | 10.68 | 3.24 | 0.71 | 0.22 | 8.13 | 3 |
| 0101–0945 (S10) | 18.03 | 18.37 | 19.320.58 | 10.95 | 10.28(10.57) | 0.49 | 1.03 | 0.27 | 8.25 | 3 |
| 0213+1347 (S12) | 18.20 | 18.56 | 21.230.60 | 10.90 | 9.56(9.83) | 0.54 | 0.97 | 0.28 | 8.67 | 3 |
| 1105+0312 (S21; M) | 17.49 | 17.94 | 18.990.58 | 11.13 | 10.39(10.71) | 0.51 | 2.15 | 0.34 | 8.79 | 3 |
| 1119+0056 (S16) | 19.16 | 19.87 | 22.280.50 | 10.41 | 9.45 | 0.76 | 0.73 | 0.48 | 8.27 | 3 |
| 1400–0108 (S23) | 18.02 | 18.39 | 20.880.55 | 10.94 | 9.72(9.95) | 0.57 | 1.11 | 0.29 | 8.70 | 4 |
| 1400+0047 (S24) | 18.09 | 18.22 | 18.610.50 | 11.05 | 10.89 | 12.65 | 0.44 | 0.11 | 8.33 | 3 |
| 1529+5928 (S26) | 18.88 | 19.22 | 20.070.50 | 10.67 | 10.33 | 0.75 | 0.52 | 0.27 | 8.02 | 3 |
| 1536+5414 (S27; M/I) | 18.53 | 19.00 | 19.480.50 | 10.75 | 10.56 | 4.78 | 0.95 | 0.36 | 8.10 | 3 |
| 1539+0323 (S01; M) | 18.54 | 18.91 | 19.970.50 | 10.77 | 10.34 | 5.30 | 0.72 | 0.29 | 8.20 | 4 |
| 1611+5131 (S02) | 19.04 | 19.32 | 19.870.50 | 10.58 | 10.36 | 2.63 | 0.34 | 0.22 | 7.98 | 3 |
| 1732+6117 (S03; M) | 17.97 | 18.50 | 20.250.53 | 10.92 | 9.97(10.22) | 0.50 | 1.64 | 0.39 | 8.28 | 4 |
| 2102–0646 (S04) | 18.12 | 18.61 | 20.180.50 | 10.88 | 10.25 | 0.96 | 1.33 | 0.36 | 8.44 | 4 |
| 2104–0712 (S05) | 18.00 | 18.68 | 20.510.50 | 10.83 | 10.10 | 1.03 | 1.85 | 0.47 | 8.74 | 4 |
| 2120–0641 (S06) | 18.48 | 18.70 | 20.620.50 | 10.88 | 10.11 | 1.01 | 0.51 | 0.18 | 8.16 | 4 |
| 2309+0000 (S07; M/I) | 17.82 | 18.48 | 20.390.50 | 10.91 | 10.15 | 1.01 | 2.10 | 0.45 | 8.53 | 3 |
| 2359–0936 (S08) | 18.33 | 18.89 | 21.770.50 | 10.77 | 9.62 | 1.23 | 1.22 | 0.40 | 8.10 | 4 |
| 0107–0834 (S11) | 17.85 | 18.01 | 18.840.50 | 10.84 | 10.51 | 0.59 | 0.52 | 0.14 | 8.00 | 3 |
| 0804+5223 (SS1) | 17.89 | 18.01 | 19.340.58 | 10.84 | 10.04(10.31) | 0.47 | 0.39 | 0.11 | 7.75 | 3 |
| 0934+0514 (SS2; M/I) | 18.38 | 18.53 | 18.530.50 | 10.67 | 10.67 | 2.55 | 0.33 | 0.13 | 7.72 | 2 |
| 1007+0842 (SS5) | 18.34 | 18.80 | 19.690.65 | 10.58 | 9.89(10.22) | 0.49 | 0.93 | 0.34 | 7.66 | 3 |
| 1015+6259 (S31) | 17.83 | 17.91 | 18.670.50 | 10.86 | 10.56 | 1.07 | 0.29 | 0.08 | 7.94 | 3 |
| 1021+3047 (SS6; M?) | 18.85 | 19.14 | 20.290.70 | 10.40 | 9.60(9.94) | 0.48 | 0.37 | 0.24 | 7.47 | 3 |
| 1043–0107 (SS7) | 18.31 | 18.45 | 19.310.63 | 10.68 | 10.02(10.34) | 0.51 | 0.31 | 0.12 | 7.53 | 3 |
| 1046+0350 (SS8) | 17.89 | 18.04 | 19.670.55 | 10.86 | 9.95(10.20) | 0.48 | 0.51 | 0.13 | 7.89 | 3 |
| 1258+4555 (SS9) | 18.04 | 18.37 | 18.370.50 | 10.74 | 10.74 | 1.62 | 0.93 | 0.26 | 8.05 | 2 |
| 1334+1142 (SS10) | 17.58 | 18.19 | 18.680.65 | 10.80 | 10.25(10.60) | 0.48 | 2.26 | 0.43 | 7.94 | 3 |
| 1352+3924 (SS11) | 18.13 | 18.31 | 19.440.60 | 10.77 | 10.02(10.32) | 0.49 | 0.51 | 0.15 | 8.11 | 3 |
| 1501+5331 (SS12; M) | 17.38 | 18.19 | 18.190.58 | 10.79 | 10.69(10.79) | 0.48 | 3.24 | 0.52 | 8.15 | 2 |
| 1505+4935 (SS13) | 18.40 | 18.92 | 18.920.50 | 10.53 | 10.53 | 1.09 | 0.98 | 0.38 | 7.63 | 2 |
| 1611+4516 (S28) | 18.08 | 18.11 | 18.860.50 | 10.84 | 10.54 | 0.94 | 0.11 | 0.03 | 7.90 | 3 |
| 2115–0726 (SS14) | 18.97 | 19.20 | 19.200.50 | 10.41 | 10.41 | 1.59 | 0.29 | 0.19 | 7.64 | 2 |
| 2158–0115 (S29; M?) | 18.36 | 18.48 | 19.180.65 | 10.66 | 10.05(10.38) | 0.48 | 0.25 | 0.10 | 7.94 | 3 |
| 2340+0105 (SS18) | 18.41 | 18.79 | 20.200.65 | 10.53 | 9.66(9.97) | 0.48 | 0.70 | 0.30 | 7.51 | 3 |
| 0155–0945 (W11; M/I?) | 19.64 | 19.82 | 19.820.50 | 10.64 | 10.64 | 2.17 | 0.31 | 0.15 | 8.00 | 2 |
| 0342–0523 (W22; M/I?) | 18.05 | 18.53 | 18.530.50 | 11.16 | 11.16 | 7.34 | 3.17 | 0.36 | 8.65 | 2 |
| 1439+3553 (W12) | 18.53 | 18.96 | 19.210.65 | 10.98 | 10.54(10.88) | 0.62 | 1.87 | 0.33 | 8.72 | 3 |
| 1500+3229 (W20) | 19.00 | 19.16 | 19.160.50 | 10.93 | 10.93 | 3.08 | 0.51 | 0.13 | 8.52 | 2 |
| 1526–0032 (W16; M) | 19.33 | 19.58 | 19.580.50 | 10.76 | 10.76 | 1.33 | 0.60 | 0.21 | 7.59 | 2 |
| 1632+2637 (W8) | 18.48 | 19.08 | 19.080.50 | 10.95 | 10.95 | 1.52 | 2.59 | 0.42 | 8.73 | 2 |
Note. — Col. (1): Target ID (RA: hhmm). In brackets, the name used in other publications. Additionally, M/I marks objects that are merging/interacting (see Fig. 1 and Paper II). All S* and SS* objects are at , all W* objects are at . The first 17 objects were observed with ACS/F775W and are already included in Treu et al. (2007), but are listed here again due to a small error in extinction correction (0.15 mag); also the luminosity in V was not included in Treu et al. (2007). For those objects with upper limits in Paper II, we here estimate the spheroid luminosity using priors (§4.3). Col. (2): Total extinction-corrected F110W AB magnitude (SS* and W* objects) or F775W AB magnitude (S* objects); including PSF (with an uncertainty of 0.2 mag). Col. (3): Total host-galaxy extinction-corrected F110W (F775W) AB magnitude (with an uncertainty of 0.1 mag). Col. (4): Spheroid extinction-corrected F110W (F775W) AB magnitude (with an uncertainty of 0.5 mag). Col. (5): Logarithm of total host-galaxy luminosity in rest-frame V (solar units), not corrected for evolution. Col. (6): Logarithm of spheroid luminosity in rest-frame V (solar units), not corrected for evolution. For those objects, for which the fitting procedure ran into the lower limit of the spheroid effective radius, we give the corresponding value as upper limit in brackets. Col. (7): Spheroid effective radius (in kpc; semi-major axis). Col. (8): Nuclear rest-frame luminosity at 5100 (in 1044 erg s-1) (uncertainty of 20%). Col. (9): Nuclear light fraction in F110W (F775W) (uncertainty of 20%). Col. (10): Logarithm of BH mass (solar units) (uncertainty of 0.4 dex). For those objects, for which the fitting procedure ran into the lower limit of the spheroid effective radius, we give the corresponding value as upper limit in brackets. Col. (11): Number of components fitted (2=PSF+spheroid; 3=PSF+spheroid+disk; 4=PSF+spheroid+disk+bar).
| Name | Total | Host | Spheroid | / | comp. | |||||
|---|---|---|---|---|---|---|---|---|---|---|
| Mpc | mag | mag | mag | kpc | ||||||
| (1) | (2) | (3) | (4) | (5) | (6) | (7) | (8) | (9) | (10) | (11) |
| 3C120 | 0.03301 | 144.9 | 13.49 | 14.62 | 14.62 | 10.41 | 10.41 | 3.26 | 7.740.21 | 2 |
| 3C390.3 | 0.05610 | 250.5 | 14.90 | 15.76 | 15.76 | 10.45 | 10.45 | 2.48 | 8.460.10 | 2 |
| Ark120 | 0.03271 | 143.6 | 13.29 | 14.13 | 15.29 | 10.59 | 10.13 | 0.09 | 8.180.06 | 3 |
| Mrk79 | 0.02219 | 96.7 | 14.46 | 14.96 | 15.94 | 9.91 | 9.52 | 0.83 | 7.720.12 | 3 |
| Mrk110 | 0.03529 | 155.2 | 15.42 | 16.22 | 17.50 | 9.83 | 9.32 | 0.37 | 7.400.11 | 3 |
| Mrk279 | 0.03045 | 133.5 | 14.00 | 14.90 | 16.04 | 10.22 | 9.77 | 0.56 | 7.540.11 | 3 |
| Mrk335 | 0.02579 | 112.6 | 14.18 | 15.32 | 16.29 | 9.90 | 9.51 | 0.45 | 7.150.11 | 3 |
| Mrk590 | 0.02639 | 115.3 | 14.21 | 14.24 | 15.42 | 10.35 | 9.88 | 1.10 | 7.680.07 | 3 |
| Mrk817 | 0.03146 | 138.0 | 14.33 | 14.97 | 17.42 | 10.22 | 9.24 | 0.08 | 7.690.07 | 3 |
| PG0052+251 | 0.15500 | 739.2 | 15.02 | 16.25 | 16.25 | 11.24 | 11.24 | 16.76 | 8.570.09 | 2 |
| PG0804+761 | 0.10000 | 460.3 | 13.89 | 16.50 | 16.50 | 10.71 | 10.71 | 3.73 | 8.840.05 | 2 |
| PG0844+349 | 0.06400 | 287.4 | 14.28 | 16.10 | 16.10 | 10.44 | 10.44 | 3.87 | 7.970.18 | 2 |
| PG1211+143 | 0.08090 | 367.6 | 14.43 | 16.93 | 16.93 | 10.33 | 10.33 | 3.06 | 8.160.13 | 2 |
| PG1226+023 | 0.15834 | 757.7 | 12.86 | 15.55 | 15.55 | 11.54 | 11.54 | 4.42 | 8.950.09 | 2 |
| PG1229+204 | 0.06301 | 282.7 | 15.38 | 15.66 | 16.65 | 10.60 | 10.20 | 1.24 | 7.860.21 | 3 |
| PG1411+442 | 0.08960 | 409.5 | 14.58 | 16.80 | 16.80 | 10.48 | 10.48 | 9.52 | 8.650.14 | 2 |
| PG1613+658 | 0.12900 | 605.2 | 14.48 | 15.48 | 15.48 | 11.37 | 11.37 | 19.54 | 8.450.20 | 2 |
| PG1700+518 | 0.29200 | 1505.1 | 14.87 | 17.84 | 17.84 | 11.41 | 11.41 | 15.79 | 8.890.10 | 2 |
| PG2130+099 | 0.06298 | 282.6 | 14.64 | 16.37 | 17.87 | 10.32 | 9.72 | 4.15 | 7.580.17 | 3 |
Note. — Results from imaging of local comparison RM AGN sample. Details of observations are given in Bentz et al. (2009b). Briefly, all objects considered here were imaged with HST/ACS, in the F550M filter using the HRC chip.
Col. (1): Target ID. Col. (2): Redshift. Col. (3) Luminosity distance in Mpc, based on redshift and the adapted cosmology. Col. (4): Total extinction-corrected F550M AB magnitude, including PSF (uncertainty of 0.2 mag). Col. (5): Total host-galaxy extinction-corrected F550M AB magnitude (uncertainty of 0.1 mag). Col. (6): Spheroid extinction-corrected F550M AB magnitude (uncertainty of 0.5 mag). Col. (7): Logarithm of total host-galaxy luminosity in rest-frame V (solar units), not corrected for evolution. Col. (8): Logarithm of spheroid luminosity in rest-frame V (solar units), not corrected for evolution. Col. (9): Spheroid effective radius (in kpc; semi-major axis). Col. (10): Logarithm of BH mass (solar units) with error, taken from Bentz et al. (2009b). Col. (11): Number of components fitted (2=PSF+spheroid; 3=PSF+spheroid+disk).
| Method | Sample | Scatter | ||
|---|---|---|---|---|
| (1) | (2) | (3) | (4) | (5) |
| linear fit | this work (with evo.)a | -0.07 0.07 | 0.70 0.10 | 0.21 0.08 |
| this work (no evo.) | -0.11 0.08 | 0.67 0.10 | 0.23 0.09 | |
| Bentz et al. (with evo.) | 0.06 0.06 | 0.72 0.09 | 0.20 0.06 | |
| Bentz et al. (no evo.) | 0.02 0.06 | 0.70 0.08 | 0.20 0.06 | |
| BCES | this work (with evo.) | -0.12 0.06 | 0.81 0.11 | |
| this work (no evo.) | -0.15 0.06 | 0.77 0.10 | ||
| Bentz et al. (with evo.) | 0.02 0.06 | 0.84 0.09 | ||
| Bentz et al. (no evo.)b | -0.02 0.06 | 0.80 0.09 | ||
| linear fit | this work (host; with evo.)a | -0.38 0.12 | 0.96 0.18 | 0.24 0.11 |
Note. — Comparison between the different fits (in the form of Equation 5) to the local RM AGN - relation: with and without correction for passive luminosity evolution, different fitting methods (linear fit vs BCES), and Bentz et al. (2009b) results vs. new analysis in this paper. In the last row, we give the fit to the local RM AGN - relation derived in this paper.
Col. (1): Fitting method. Linear fit with intrinsic scatter or BCES for comparison with Bentz et al. (2009a). Col. (2): Sample. “evo.” indicates whether or not data have been corrected for luminosity evolution. Col. (3): Mean and uncertainty on the best fit intercept. Col. (4): Mean and uncertainty on the best fit slope. Col. (5): Mean and uncertainty on the best fit intrinsic scatter (for “linear fit” only).
a This is the fit we use in the subsequent analysis.
b This is the fit used in Bentz et al. (2009a).