Environment of MAMBO galaxies in the COSMOS field∗
Abstract
Submillimeter galaxies (SMG) represent a dust-obscured high-redshift population undergoing massive star formation activity. Their properties and space density have suggested that they may evolve into spheroidal galaxies residing in galaxy clusters. In this paper, we report the discovery of compact () galaxy overdensities centered at the position of three SMGs detected with the Max-Planck Millimeter Bolometer camera (MAMBO) in the COSMOS field. These associations are statistically significant. The photometric redshifts of galaxies in these structures are consistent with their associated SMGs; all of them are between , implying projected physical sizes of kpc for the overdensities. Our results suggest that about 30% of the radio-identified bright SMGs in that redshift range form in galaxy density peaks in the crucial epoch when most stars formed.
Subject headings:
galaxies: evolution — galaxies: high-redshift — galaxies: starburst — galaxies: clusters: general1. Introduction
Submillimeter galaxies (SMG) are dust-obscured starburst galaxies at high-redshift (Smail et al., 1997; Hughes et al., 1998; Barger et al., 1998). Their large dynamical (Greve et al., 2005; Tacconi et al., 2006, 2008) and stellar masses (Borys et al., 2005; Dye et al., 2008), as well as their number densities and clustering properties (Scott et al., 2002; Blain et al., 2004; Viero et al., 2009), suggest they could be the progenitors of present-day luminous ellipticals (Lilly et al., 1999; Swinbank et al., 2006). Some SMGs are known to be associated with galaxy clusters at high redshifts (e.g. Webb et al., 2005) and to be located in extended overdensities of LBGs and radio galaxy fields (Ivison et al., 2000; Smail et al., 2003; Stevens et al., 2003; Chapman et al., 2008; Daddi et al., 2009; Tamura et al., 2009).
If SMGs are progenitors of massive clustered spheroids, they would likely show signs of clustering in the epoch when these galaxies have their peak in activity and luminosity (), similar to what is observed for powerful AGN (Miley & De Breuck, 2008). Attempts to measure the clustering of SMGs indicate that they are associated with massive dark matter halos and possibly trace the largest scale structures at high redshifts (Blain et al., 2004; Viero et al., 2009; Weiss et al., 2009). However, current submillimeter blank-field surveys either cover small areas in the sky, yielding a few tens of sources within contiguous fields (Coppin et al., 2006; Bertoldi et al., 2007; Scott et al., 2008; Perera et al., 2008; Austermann et al., 2009), or are limited by poor angular resolution albeit covering large regions (Devlin et al., 2009). Hence, good quantitative studies of the small to large scale clustering of the SMG population are not feasible until large surveys comprising a few square degrees on the sky under good resolution () can be made.
Studies of the environment of SMGs are possible when utilizing the rich complementary data available for current (sub)millimeter fields. Whether SMGs are embedded in regions with an enhanced number of optical/near-IR detected high-redshift galaxies has yet not been quantified. In this paper, we investigate to what extent SMGs are located in clustered fields. For this, we make use of deep optical and near-IR imaging data in the central part of the COSMOS field to measure the density of high-redshift galaxies in the surroundings of SMGs. This allows us to study the relation of blank-field detected SMGs with the most prominent galaxy density peaks at high-redshift. Hereafter, we assume a cosmology with km s-1 Mpc-1, and and use all magnitudes in the AB system.
2. Observations
2.1. COSMOS photometric data

The COSMOS survey (Scoville et al., 2007) covers a sufficiently large area ,, at appropriate depth over nearly the entire electromagnetic spectrum to provide a comprehensive view of galaxy formation and large scale structure.
The COSMOS -band selected photometric catalog includes a total of 30 narrow, intermediate and broad band filters covering from UV to mid-IR wavelengths that allowed the computation of accurate photometric redshifts down to (see Ilbert et al., 2009; Salvato et al., 2009).
A new deep -band survey covering the entire COSMOS field was recently carried out by McCracken et al. (2009). The -band image reaches seeing values of ″ with variations of less that across the entire COSMOS field. The -band selected catalog includes the , and bands, reaching a completeness limit and a 1 limit in the 2″ diameter aperture of 25.4 (for details see McCracken et al., 2009). About 85% of the sources detected in this -band image down to have a photometric redshift estimate based on the -band photometric redshift catalog.
2.2. MAMBO 1.2 mm observations
An effective area of of the COSMOS field was mapped at 1.2 mm by Bertoldi et al. (2007) using the Max-Planck millimeter bolometer camera (MAMBO) at the Institut de Radioastronomie Millimétrique (IRAM) 30 m telescope. The COSMOS MAMBO (COSBO) survey is centered at (R.A., Dec.) and reaches a noise level of 1.0 mJy per beam.
Fifteen millimeter sources were detected with a significance . Eleven of them were found to have a significant 1.4 GHz VLA counterpart. Additional 12 lower significance sources () were selected based on their association with radio sources within from the millimeter position (Bertoldi et al., 2007). Two more MAMBO sources with S/N were selected based on their match with significant 1.1 mm Bolocam (Aguirre et al., in prep.) and radio sources.
3. Environment of submillimeter galaxies
3.1. selection
The color-color criterion (Daddi et al., 2004) provides an efficient way to select galaxies in the crucial epoch when star-formation and SMG activity peaked ().
Figure 1 shows the color-color diagram for the -band selected counterparts to the MAMBO sources and for objects with in the COSBO field. Small corrections account for the difference between the VLT -band used in the original criterion and our band (McCracken et al., 2009). According to this, sources with are star-forming galaxies at redshift (s), while objects with but are old passively evolving galaxies at redshift (p). Objects with and correspond to a mixture of old and star-forming galaxies at redshift (n). The restriction allows the separation of stars.
To study the environment of the MAMBO galaxies, we used the criteria to create a -band selected galaxy sample containing a mixture of passive and star-forming galaxies at high-redshift. We constrained our sample to include objects in the magnitude range and used the criterion to reject stars.
We note that while the criterion is very efficient selecting galaxies at , with completeness down to (based on spectroscopic measurements; Barger et al., 2008), it still suffers a great degree of contamination (), mostly from sources at (; Barger et al., 2008). Only a small percentage () appears to lie at and .
| ID | R.A.a | Dec.a | |||||||
|---|---|---|---|---|---|---|---|---|---|
| (J2000) | (″) | ||||||||
| COSBO-1 | 150.0679 | 2.26209 | 9 | 4.6 | 13.8 | 18.5 | 4.7 | 2.0 | 1.2 |
| COSBO-3 | 150.2379 | 2.33649 | 10 | 27.8 | 2.8 | 3.9 | 0.05 | 2.3 | 2.3 |
| COSBO-6 | 150.0357 | 2.21871 | 11 | 22.9 | 4.6 | 12.3 | 0.2 | 1.6 | 1.9 |
| COSBO-16 | 150.2360 | 2.14549 | 12 | 7.2 | 6.5 | 12.7 | 0.7 | 1.5 | 0.5 |
a Position of the density peak. b Number of high-redshift galaxies within 30″. c Peak signal-to-noise () of the density peak. d Distance from the COSBO source to the density peak. e&f Probability that a significant overdensity lies by chance within a distance of 30″ and of from the MAMBO source.g Median photometric redshift for galaxies within 30″. h Photometric redshift for the SMG from Bertoldi et al. (2007).
3.2. Projected density distribution
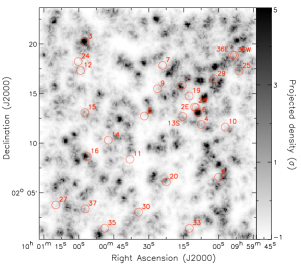
We constructed number density maps of high-redshift galaxies in the COSBO field. For this, we created a grid of positions equally spaced by 7″ centered at the COSBO field position, and computed the density from the distance to the 7th nearest neighbour galaxy, , to each grid point. The density is thereby computed as .
This procedure is similar to the one introduced by Dressler (1980). The choice of is a compromise between accounting for structures on small scales (groups of galaxies around SMGs) and good statistics for each density value. Similar approaches have been applied to known rich galaxy clusters (e.g. Guzzo et al., 2007), but using photometric or spectroscopic information to compute the number density in redshift slices.
Figure 2 shows the projected number density map of high-redshift galaxies in the COSBO field. The average and standard deviation values were computed by using all grid points from our density map (Fig. 2). The average density thus computed is arcmin-2 (), where the quoted uncertainty corresponds to the actual cosmic variance. Down to , we find an average density of arcmin-2, which compares well with the number counts of high-redshift galaxies in other surveys at this depth (Kong et al., 2006).
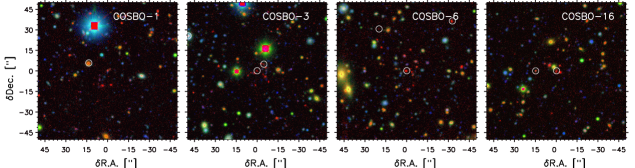
We find that four MAMBO galaxies (COSBO 1, 3, 6 and 16) are embedded in significant overdensities () of high-redshift galaxies. All the galaxies in these overdensities are star-forming rather than passive evolving galaxies. Three out of these four SMGs were detected with S/N in the MAMBO map (Bertoldi et al., 2007). The overdensities of galaxies around MAMBO sources can also be seen directly on the optical and IR images (Fig. 3). Here, red galaxies are easily distinguished, showing an excess toward the MAMBO source position (image center). The typical radial extent of these overdensities is ″ ( in diameter). At a redshift of , this implies structures on scales of kpc, similar to what has been found for QSO and radio galaxy fields (Hall & Green, 1998; Best, 2000).
3.3. Probability of chance association
To estimate the probability that an overdensity is found by chance within a distance from a MAMBO galaxy, we performed Monte Carlo simulations of significant density peaks drawn by the underlying distribution of overdensities in the COSBO field.
To identify all the peaks in our density map, we used the IDL version of the DAOPHOT task FIND. This routine finds the positive perturbations in the density map, and uses marginal Gaussian fits to locate the centroid and amplitude of the density peak. This Gaussian approximation may not be valid for fragmented density structure, however it is reliable to detect the most significant overdensities which are typically non-fragmented.
Based on this procedure, we found 45 detections with S/N, nine of them with S/N. Using their observed spatial distribution, we generated 45 peaks in each of the 10000 samplings, and thereby computed as the fraction of SMG-overdensity associations in our simulations (Table 1). In the cases of COSBO 3, 6 and 16, the probabilities of chance association are negligible.
3.4. Photometric redshifts and comments on individual associations
To measure the clustering of the star-forming high-redshift galaxies associated with SMGs in redshift space, we used the COSMOS -band selected photometric redshift catalog (Ilbert et al., 2009). The accuracy of these photometric redshifts for faint galaxies () is .
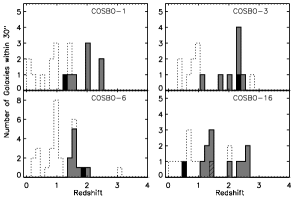
Figure 4 shows the redshift distribution of -band selected galaxies that lie close to the high-redshift density peaks associated with SMGs. Since the -band catalog is too shallow to include the obscured optical emission from the MAMBO galaxies, we used the previous photometric redshift estimates from Bertoldi et al. (2007).
For COSBO-1, a recent Submillimetre Array (SMA) detection (which will be published elsewhere) indicates that the millimeter emission is produced by a radio and optically undetected galaxy at (as also implied by its radio-to-millimeter spectral index; Bertoldi et al., 2007). The counterpart to this MAMBO source selected by Bertoldi et al. (2007), a relatively bright IRAC/optical source with a photometric redshift of , is related to the galaxy group at this redshift. However, it is very probably not responsible for the millimeter emission. The association between this source and the overdensity is unlikely, . Hence, we discard this one as a real association between a SMG and a galaxy group at . In cases when the group is at low-redshift, gravitational lensing of a far-away SMG is a possibility.
For COSBO-3, the redshift distribution of the galaxies in its close neighbourhood is consistent with most of them being at (Fig. 4). Two radio sources can be identified within 10″ from the MAMBO source. The most likely radio/IR/optical counterpart (COSBO-3S) has a photometric redshift of (Bertoldi et al., 2007). Based on the -band selected catalog, we find a redshift of 2.4 for this source, consistent with the likely redshift of the galaxy group. Recent CARMA observations indicate the MAMBO emission is produced by at least two sources (Smǒlcić et al., in prep.).
Most galaxies in the group around COSBO-6 lie at . Bertoldi et al. (2007) estimated a photometric redshift of for the radio/optical identified counterpart to the millimeter emission. Although the redshift for the likely counterpart is slightly larger than the one implied by the redshift distribution of the surrounding high-redshift galaxies, it agrees within .
The galaxies surrounding COSBO-16 have a photometric redshift of . The photometric redshift derived for the likely radio/optical counterpart from the -band selected catalog is (Bertoldi et al., 2007), however the secondary solution (second minima in the distribution) implies . The photometric redshift listed in the COSMOS catalog is, however, 2.55 which agrees better with that implied by the radio to millimeter spectral index (Bertoldi et al., 2007). Because of the somewhat ambiguous redshift derivation for the millimeter source, it is difficult to relate it to the redshift peak in the surrounding galaxies, although we may slightly favor to use as the most likely case for both.
4. Summary and Discussion
We find that significant overdensities of star-forming high-redshift galaxies are related to three MAMBO galaxies detected in the COSMOS field. These groups are compact in size, and the peaks of their redshift distributions are compatible with the redshift estimated for the associated MAMBO galaxies.
4.1. SMGs in dense environments
If SMGs are related to the formation of structures at high-redshift, we would expect that most SMGs are located in regions with enhanced galaxy densities. However, only a few SMGs in our sample can be associated with strong galaxy overdensities. This could be partly attributed to a selection effect, since we are comparing the overall population of SMGs at various redshifts with -band selected galaxies in the range . According to Chapman et al. (2005), of the radio-identified, bright SMG population lies in this redshift range. From our sample of fifteen MAMBO sources detected with a significance , eleven were identified to have a radio counterpart. Following Chapman et al., we estimate that about six of these eleven MAMBO sources should be at , while using the photometric redshifts reported by Bertoldi et al. (2007), seven appear to lie in this redshift range. This implies that 30% of the radio-identified, significant MAMBO sources at are associated with substancial overdensities of massive galaxies at these redshifts.
Note that our study is biased in that we are selecting massive galaxies at . Our limit roughly translates into stellar masses (Daddi et al., 2004), and therefore we miss less massive galaxies that could be associated with SMGs at these redshifts. However, the fact remains that only a fraction of the SMGs are related to groups of massive galaxies in the crucial epoch of galaxy assembly.
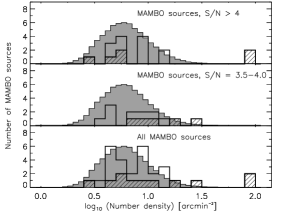
We compared the distribution of densities at the position of MAMBO source detections with the distribution of densities of BzK galaxies in the field (Fig. 2). A Kolmogorov-Smirnov (KS) test does not reject the null hypothesis that both samples follow the same distribution at a 46% significance level. Restricting the MAMBO source sample to sources at , the KS test does not reject the null hypothesis at a 43% level. This is somewhat inconsistent with the fact that two of the brightest MAMBO galaxies are related to some of the strongest overdensities in the field, however it may merely reflect the low number of SMGs that we used to compute the KS statistic. For the MAMBO source sample, the KS-test does not rule out the null hypothesis at a 23% level, whereas if we limit this sample to galaxies with , the KS test gives a 3.4% significance level. This strongly suggests that the densities at the position of the fainter MAMBO sources follow a different distribution from that of BzK galaxies in the field. For both samples combined (all MAMBO sources), the KS test gives only a 9.6% probability that they follow the same distribution of densities of BzK galaxies in the field, which is similar to the value that we obtain if we restrict the sample to , 12.6%, again suggesting that the distributions are different.
Overall, our results show that only a fraction (30%) of MAMBO sources at is located in strongly overdense regions. This suggests that only some SMGs are linked to the formation of structures at high-redshift. Although we find a hint that some SMGs could be located in environments denser than that of the general population of galaxies at , it is not possible to discern whether this is a real trend or is due to cosmic variance as our analysis is based only on a handful of SMGs.
The presence of bright SMGs in galaxy overdensities is possibly related to the fact that the density peaks of high-redshift galaxies associated with MAMBO galaxies (e.g. for COSBO-3 and 6) are the strongest in the whole COSBO area. Denser groups of star-forming galaxies are more likely to produce major mergers between galaxies and thus are prone to trigger violent star-formation activity. The merger of two gas-rich galaxies close to the center of a galaxy group could induce a starburst that would be seen as a bright SMG. Star-forming galaxies have large reservoirs of molecular gas (; Daddi et al., 2008), and could easily sustain the typical star-formation rates observed in SMGs ( yr-1) for Myr. The densest galaxy groups are thus ideal for the formation of bright submillimeter activity.
4.2. Comparison with other studies
Similar studies relating the distribution of SMGs with the large scale structures traced by optically selected galaxies at high-redshift have recently been done. In particular, Tamura et al. (2009) found a strong overdensity of SMGs toward a massive protocluster of Lyman- emitters at , reflecting a strong link between SMGs and the large scale structure. Nevertheless, this study is based on a proto-cluster field where we know that strong clustering is taking place.
Studies of the galaxy-galaxy angular correlation function in blank-fields indicate that SMGs and IR luminous galaxies at are clustered on typical angular scales of , being related to massive dark matter halos (; Blain et al., 2004; Greve et al., 2004; Scott et al., 2006; Farrah et al., 2006; Viero et al., 2009; Weiss et al., 2009). Our results are consistent with these results in that strong clustering between SMGs and BzK galaxies occur on similar angular scales. We note, however, that studies purely based on the angular two-point correlation function are only able to measure the average clustering properties of SMGs. They miss the important fact that not all the SMGs are located in clustered environments, as we find in this paper, and therefore only a few of them will significantly contribute to the clustering signal of the angular correlation function in small scales.
References
- Austermann et al. (2009) Austermann, J. E., Dunlop, J. S., Perera, T. A., et al. 2009, arXiv:0907.1093
- Barger et al. (1998) Barger, A. J., Cowie, L. L., Sanders, D. B., et al. 1998, Nature, 394, 248
- Barger et al. (2008) Barger, A. J. and Cowie, L. L. & Wang, W.-H. 2008, ApJ, 689, 687
- Bertoldi et al. (2007) Bertoldi, F., Carilli, C., Aravena, M., et al. 2007, ApJS, 172, 132
- Best (2000) Best, P. N. 2000, MNRAS, 317, 720
- Blain et al. (2004) Blain, A. W., Chapman, S. C., Smail, I., & Ivison, R. 2004, ApJ, 611, 725
- Bondi et al. (2008) Bondi, M., Ciliegi, P., Schinnerer, E., et al. 2008, ApJ, 681, 1129
- Borys et al. (2005) Borys, C., Smail, I., Chapman, S. C., et al. 2005, ApJ, 635, 853
- Chapman et al. (2005) Chapman, S. C., Blain, A. W., Smail, I., & Ivison, R. J. 2005, ApJ, 622, 772
- Chapman et al. (2008) Chapman, S. C., Blain, A. W., Ibata, R., et al. 2008, ArXiv e-prints
- Coppin et al. (2006) Coppin, K., Chapin, E. L., Mortier, A. M. J., et al. 2006, MNRAS, 372, 1621
- Daddi et al. (2004) Daddi, E., Cimatti, A., Renzini, A., et al. 2004, ApJ, 617, 746
- Daddi et al. (2008) Daddi, E., Dannerbauer, H., Elbaz, D., et al. 2008, ApJ, 673, L21
- Daddi et al. (2009) Daddi, E., Dannerbauer, H., Stern, D., et al. 2009, ApJ, 694, 1517
- Devlin et al. (2009) Devlin, M. J., Ade, P., Aretxaga, I., et al. 2009, Nature, 458, 737
- Dressler (1980) Dressler, A. 1980, ApJ, 236, 351
- Dunlop (2009) Dunlop, J. 2009, Nature, 459, 43
- Dye et al. (2008) Dye, S., Eales, S. A., Aretxaga, I., et al. 2008, MNRAS, 433
- Farrah et al. (2006) Farrah, D., Lonsdale, C. J., Borys, C., et al. 2006, ApJ, 641, L17
- Greve et al. (2004) Greve, T. R., Ivison, R., Bertoldi, F., et al. 2004, MNRAS, 354, 779
- Greve et al. (2005) Greve, T. R., Bertoldi, F., Smail, I., et al. 2005, MNRAS, 359, 1165
- Guzzo et al. (2007) Guzzo, L., Cassata, P., Finoguenov, A., et al. 2007, ApJS, 172, 254
- Hall & Green (1998) Hall, P. B. & Green, R. F. 1998, ApJ, 507, 558
- Hughes et al. (1998) Hughes, D. H., Serjeant, S., Dunlop, J., et al. 1998, Nature, 394, 241
- Ilbert et al. (2009) Ilbert, O., Capak, P., Salvato, M., et al. 2009, ApJ, 690, 1236
- Ivison et al. (2000) Ivison, R. J., Dunlop, J. S., Smail, I., et al. 2000, ApJ, 542, 27
- Kong et al. (2006) Kong, X., Daddi, E., Arimoto, N., et al. 2006, ApJ, 638, 72
- Lilly et al. (1999) Lilly, S., Eales, S., Gear, W., et al. 1999, ApJ, 518, 641
- McCracken et al. (2009) McCracken, H. J., Capak, P., Salvato, M., et al. 2009, ArXiv:0910.2705
- Miley & De Breuck (2008) Miley, G. & De Breuck, C. 2008, A&A Rev., 1
- Pannella et al. (2009) Pannella, M., Carilli, C. L., Daddi, E., et al. 2009, ApJ, 698, 116
- Perera et al. (2008) Perera, T. A., Chapin, E. L., Austermann, J. E., et al. 2008, MNRAS, 391, 1227
- Salvato et al. (2009) Salvato, M., Hasinger, G., Ilbert, O., et al. 2009, ApJ, 690, 1250
- Schinnerer et al. (2004) Schinnerer, E., Carilli, C. L., Scoville, N. Z., et al. 2004, AJ, 128, 1974
- Schinnerer et al. (2007) Schinnerer, E., Smolčić, V., Carilli, C. L., et al. 2007, ApJS, 172, 46
- Scott et al. (2008) Scott, K. S., Austermann, J. E., Perera, T. A., et al. 2008, MNRAS, 268
- Scott et al. (2006) Scott, S. E., Dunlop, J. S., & Serjeant, S. 2006, MNRAS, 370, 1057
- Scott et al. (2002) Scott, S. E., Fox, M. J., Dunlop, J. S., et al. 2002, MNRAS, 331, 817
- Scoville et al. (2007) Scoville, N., Aussel, H., Brusa, M., et al. 2007, ApJS, 172, 1
- Smail et al. (1997) Smail, I., Ivison, R. J., Blain, A. W. 1997, ApJ, 490, 5
- Smail et al. (2003) Smail, I., Ivison, R. J., Gilbank, D. G., et al. 2003, ApJ, 583, 551
- Stevens et al. (2003) Stevens, J. A., Ivison, R. J., Dunlop, J. S., et al. 2003, Nature, 425, 264
- Swinbank et al. (2006) Swinbank, A. M., Chapman, S. C., Smail, I., et al. 2006, MNRAS, 371, 465
- Tacconi et al. (2006) Tacconi, L. J., Neri, R., Chapman, S. C., et al. 2006, ApJ, 640, 228
- Tacconi et al. (2008) Tacconi, L. J., Genzel, R., Smail, I., et al. 2008, ApJ, 680, 246
- Tamura et al. (2009) Tamura, Y., Kohno, K., Nakanishi, K., et al. 2009, Nature, 459, 61
- Viero et al. (2009) Viero, M. P., Ade, P. A. R., Bock, J. J., et al. 2009, ArXiv e-prints
- Webb et al. (2005) Webb, T. M. A., Yee, H. K. C., Ivison, R. J., et al. 2005, ApJ, 631, 187
- Weiss et al. (2009) Weiss, A., Kovacs, A., Coppin, K., et al. 2009, arXiv:0910.2821