Supersonic Line Broadening within Young and Massive Super Star Clusters
Abstract
The origin of supersonic infrared and radio recombination nebular lines often detected in young and massive superstar clusters are discussed. We suggest that these arise from a collection of repressurizing shocks (RSs), acting effectively to re-establish pressure balance within the cluster volume and from the cluster wind which leads to an even broader although much weaker component. The supersonic lines are here shown to occur in clusters that undergo a bimodal hydrodynamic solution (Tenorio-Tagle et al. 2007), that is within clusters that are above the threshold line in the mechanical luminosity or cluster mass vs the size of the cluster (Silich et al. 2004). The plethora of repressurizing shocks is due to frequent and recurrent thermal instabilities that take place within the matter reinserted by stellar winds and supernovae. We show that the maximum speed of the RSs and of the cluster wind, are both functions of the temperature reached at the stagnation radius. This temperature depends only on the cluster heating efficiency (). Based on our two dimensional simulations (Wunsch et al. 2008) we calculate the line profiles that result from several models and confirm our analytical predictions. From a comparison between the predicted and observed values of the half-width zero intensity of the two line components we conclude that the thermalization efficiency in SSC’s above the threshold line must be lower than 20 %.
1 Introduction
Young super star clusters (SSCs) with ages less than 107 years, stellar masses to 107 M⊙, and sizes which span only a few parsecs have been found in a large variety of galaxies. Many of these have turned out to be strong line emitters in the infrared and radio regimes (see, for example, Turner et al. 2000; Gilbert et al. 2000; Galliano & Alloin 2008). Some of them, as in the Antennae galaxy, Henize 2-10, NGC 5253 and IIZw 40 (see Gilbert & Graham 2007; Henry et al. 2007; Turner et al. 2003; Beck et al. 2002) are known to emit spatially extended Br lines from dense HII regions. Most of these present supersonic line widths (FWHM 50 to 200 km s-1) that may exceed the escape velocity of the clusters. As reported by Beck (2008), in some cases the emission lines can be fitted by a single gaussian component, as it is the case of NGC 5253, while others (as in He 2 - 10) require also of a low intensity, although much broader component (FWHM 250 - 550 km s-1), to fit the observed lines. A central issue pointed out by Turner et al. (2003) when dealing with the central supernebula in NGC 5253 which presents a mean radius smaller than 1 pc, is that if the supersonic line width is caused by the expansion of the nebula, then its dynamical age is implausibly short. The supersonic infrared (Turner et al. 2003; Henry et al 2007) and radio recombination lines (Rodríguez-Rico et al. 2007) lack a full explanation. The core high intensity, broad component has been interpreted as arising from the photoionized gas leftover from the process of star formation, while the low intensity and even broader component may be the signature of an outflow, a cluster wind, that begins to disrupt the leftover cloud and unveil the central SSC. These ideas are supported by the high extinction and the estimated high density gas ( cm-3) in the observed HII regions, which may indicate that the star-forming episodes are young. Another possibility in the literature comes from an analogy to the broad lines presented by galactic compact HII regions. Henry et al (2007) and Beck (2008) have suggested that a plethora of massive stars blowing their winds may also contribute to the core line widths. Normal O stars however have winds with velocities 103 km s-1, but in their view, a dense environment may reduce the speed to the observed values, as it is the case in compact HII regions in our galaxy (De Pree et al. 2000).
Here we take a completely different approach based on the recent theoretical contributions (Silich et al. 2004, 2007; Tenorio-Tagle et al. 2005, 2007; Wünsch et al. 2007, 2008) that have led us to realize the physical conditions that prevail within the volume occupied by the large collection of massive stars expected within young and compact SSCs. The model assumes, as in the original contribution of Chevalier & Clegg (1985), that there is an even distribution of massive stars within the cluster volume, and considers their strong winds as well as their mass and energy released through supernova events. It considers also the direct interaction of all of these supersonic streams and thus the thermalization of the kinetic energy provided by massive stars. Our approach takes into consideration radiative cooling in the thermalized plasma and the thermalization efficiency which accounts for the immediate loss of energy resultant from the proximity of the sources and the large metallicities of the reinserted matter. Thus , the thermalization efficiency, measures the remaining energy available to the matter reinserted into the cluster volume. We neglect the radiation pressure as a possible wind driving mechanism because in a typical medium inside the young SSC’s the dust grains are destructed by sputtering on a very short time scale. Moreover, the effect of radiation is small compared to the thermal pressure driving (see the Appendix).
Here we show that the detected broad nebular lines have indeed nothing to do with the expansion of the nebula. The supersonic broad emission lines result only in clusters undergoing the bimodal hydrodynamic solution (see Tenorio-Tagle et al. 2007), those found above the threshold line as defined in the cluster mass or mechanical energy vs size plane by Silich et al. (2004). The origin of the most intense of the broad lines is due to a plethora of repressurizing shocks (see, for instance, Zeldovich & Raizer, 1965), induced within the dense thermally unstable reinserted gas as this strives to maintain pressure balance with the much hotter gaseous counterpart. The less intense, although much broader gaussian component detected only in some cases, is here shown to be caused by the cluster wind, as it becomes photoionized and less dense upon its own expansion. Section 2 summarizes the hydrodynamics of the matter reinserted within SSCs. Section 3 provides a handle on the line-widths expected for clusters undergoing the bimodal solution and shows that these are a measure of the heating efficiency attained by the matter reinserted within SSCs. Section 3 provides also some line profile examples calculated from our two dimensional hydrodynamic simulations (Wünsch et al. 2008) and section 4 summarizes our conclusions.
2 The state of the matter reinserted within SSCs
Within young SSCs, the continuous mass and energy deposition, due to stellar winds and frequent supernova explosions, rapidly builds up extreme conditions. These favor either a strong stationary wind, the cluster wind, for clusters below the threshold line in the mass or mechanical luminosity vs size plane, or a bimodal flow for clusters above the threshold line (see Silich et al. 2004; Tenorio-Tagle et al. 2007). In either of these possibilities, the reinserted kinetic energy () is immediately thermalized across the multiple shocks that result from the interaction of neighboring supersonic streams. This also leads to a high temperature ( K) plasma, and in the first possibility (below the threshold line), to a high pressure environment, that powers its own expansion into the low pressure surrounding medium. In this way a stationary wind ( = ; where is the mass deposition rate inside the star cluster volume and and are the density and sound speed at the cluster surface ) is established. The wind is to become strongly radiative, departing from the adiabatic solution of Chevalier & Clegg (1985), for clusters near the threshold line (see Silich et al. 2004). In the bimodal cases (ie. above the threshold line), radiative cooling depletes rapidly the energy gained through thermalization, particularly within parcels of gas in the densest central regions of the cluster. As shown by Tenorio-Tagle et al. (2007) and by Wünsch et al. (2007, 2008), radiative cooling forces the stagnation radius (the radius where the velocity of the flow equals 0 km s-1) to move out of the cluster center, while driving the matter reinserted within this inner volume to frequently become thermally unstable. At the same time, the matter reinserted between and the cluster surface, although also exposed to strong radiative cooling, manages to compose a stationary wind.
Thus in both cases, below and above the threshold line, the cluster stars end up immersed in a pervasive hot medium. Below the threshold line this streams out as a hot ( 107 K) cluster wind as it is inserted. Such a wind will only cool down at large distances (tens of pc) from the cluster surface (see Silich et al. 2004) and thus it would not lead to a broad line component associated to the star cluster. Note that the observed spectra are obtained by integrating over less than along the slit, centered on the emission peaks, and thus the observed broad lines are indeed associated to the SSCs. In the bimodal cases however, pockets of gas within the volume enclosed by the stagnation radius, are to become frequently thermally unstable. Radiative cooling brings rapidly their temperature down to 104 K or even to lower values, if an ionizing photon flux is not sufficient to fully ionize the resultant condensations (say, for coeval clusters with an age yr). As shown by Wünsch et al. (2008), in all bimodal cases, most of the dense condensations generated within the stagnation volume are unable to leave the cluster and thus inevitably accumulate within the cluster volume. Eventually such a process results into further generations of stellar formation (Tenorio-Tagle et al. 2005; Palouš et al. 2008).
In the bimodal cases, the sudden loss of temperature and thus pressure, immediately causes the appearance of strong repressurizing shocks (Zeldovich & Raizer, 1965; Shapiro & Kang, 1987; Vietri & Pesce, 1995; Tenorio-Tagle, 1996). These emanate from the pervasive hot, high pressure gas and move with large speeds into the thermally unstable parcels of gas, causing their rapid condensation through a strong reduction of their volume and the corresponding density enhancement. Note that the density (or metallicity) of the unstable gas needs to be only slightly larger than the density (or metallicity) of the stable counterpart for the instability to occur and thus, one can show that the asymptotic speed of the repressurizing shocks under the adiabatic () and isothermal () approximations is only a function of the temperature () of the hot gas (Vietri & Pesce, 1995):
| (1) | |||
| (2) |
where , and are the Boltzmann constant, the mean mass per particle in the ambient hot plasma and the proton mass, respectively. The parameters and are of the order of unity and their values depend on detailed physics of the highly supersonic repressurizing shocks including the geometry of the dense low pressure regions. They must be determined via numerical simulations. Thus, for the bimodal cases, the radiative wind theory leads to a plethora of cooling condensations, appearing in a recurrent frequent manner within the stagnation volume. These are squeezed by multiple repressurizing shocks, driven into all sides of the thermally unstable parcels of gas by the higher ambient pressure. At the same time the outer cluster regions (between and ) compose a stationary wind, also exposed to strong radiative cooling and thus to be photoionized as it streams away from the cluster, when its temperature drops below K (Silich et al. 2004, 2007). However, in many cases the wind with the appropriate temperature may present a low density and thus lead to a very weak component, compared to the line produced by the dense gas behind the repressurizing shocks.
3 Properties of the thermalized plasma
The density and temperature distribution of the thermalized reinserted matter is such that it causes a slight outward pressure gradient and this leads to a smooth acceleration from a subsonic expansion, within the cluster volume, to a high velocity, supersonic flow outside of the cluster (Chevalier & Clegg, 1985; Canto´ et al. 2000; Silich et al. 2004). This requires that the sonic point (the point where the sound speed is equal to the local expansion velocity) is located at the star cluster surface. One can always fulfil this condition by iterating over the temperature at the stagnation radius . In turn, is coupled to the density and pressure at the stagnation point, and thus completely defines the thermodynamics of the re-inserted plasma there (see Silich et al. 2004; Wünsch et al. 2007):
| (3) |
| (4) |
where is the sound speed at , is the mass deposition rate per unit volume, is the adiabatic wind terminal speed, and is the cooling function at the stagnation point. In this parameter space the value of depends only on one parameter, , which in the semi-analytic models accounts for all uncertainties dealing with the thermalization of the kinetic energy provided by massive stars inside the star cluster volume (see, for instance, Wünsch et al. 2007; Silich et al. 2007). It defines the fraction of the star cluster mechanical luminosity that remains as thermal energy of the re-inserted matter after strong radiative cooling removes during thermalization a fraction of the deposited energy. This implies that the amount of thermal energy deposited into the star cluster volume per unit time () is smaller than the total star cluster mechanical luminosity, , with . The main impact of is to lower the location of the threshold line in the vs plane.
The radiative solution found by Silich et al. (2004), Tenorio-Tagle et al. (2007), Wünsch et al. (2007, 2008) defines the location of the threshold line , in the vs plane, which separates clusters (below the threshold line) for which is at the cluster center, from those (above the threshold line) with pc (Tenorio-Tagle et al. 2007; Wünsch et al. 2008). For clusters whose mechanical luminosity is equal or larger than the critical value, the temperature at the stagnation radius is defined by the condition that reaches its maximum possible value () and this is independent of the star cluster mass and radius (Tenorio-Tagle et al. 2007).
For massive and compact star clusters, which are located above the threshold line in the vs plane, one can present the condition in the form of a nonlinear algebraic equation:
| (5) |
One can then use this equation in order to calculate the value of for different values of the heating efficiency . Note that the temperature of the thermalized plasma remains almost constant inside the stagnation radius (), and thus is here used to define through equations (1) and (2) the expected asymptotic velocity of the repressurizing shocks and the terminal wind velocity (Silich et al. 2007):
| (6) |
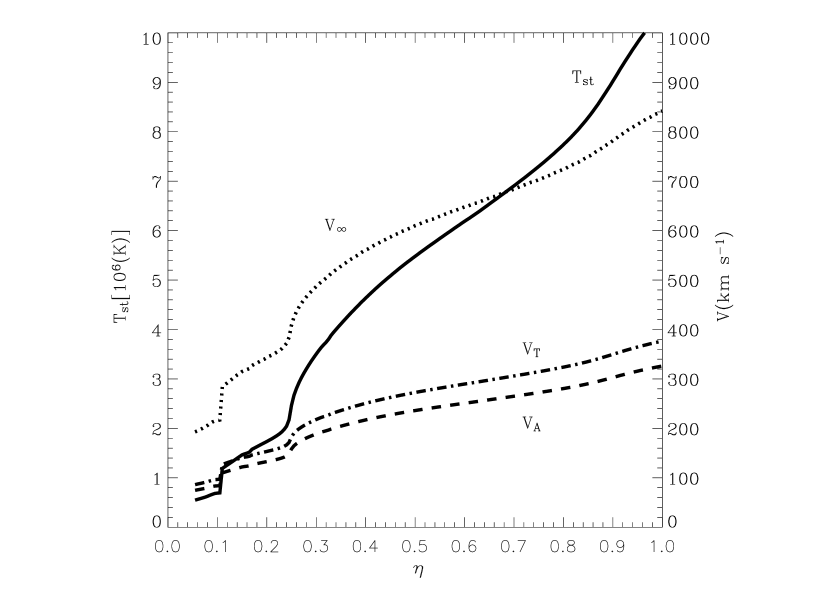
Figure 1 displays the values of , and the velocity of the gas overtaken by the repressurizing shocks ( in the adiabatic and in the isothermal case) calculated for different values of the heating efficiency by means of equations (1), (2) and (6) under the assumption that .
3.1 The broadening of the nebular lines
In the context of the matter cooling within the superstar cluster stagnation radius, the repressurizing shocks have been calculated first by means of 1D numerical hydrodynamics in Tenorio-Tagle et al. (2007) and in two dimensional calculations by Wünsch et al. (2008). We use the later to calculate recombination line profiles and present results for three models with the following parameters: Model 5 ( pc, and ), Model 6 ( pc, and ) and Model 8 ( pc, and ); see Wünsch et al. (2008) for further details.
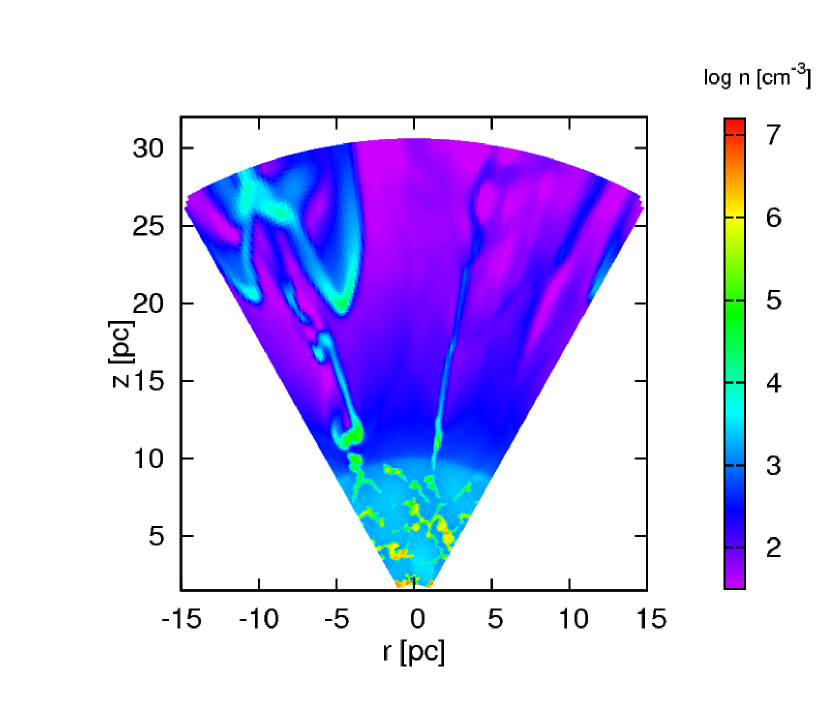
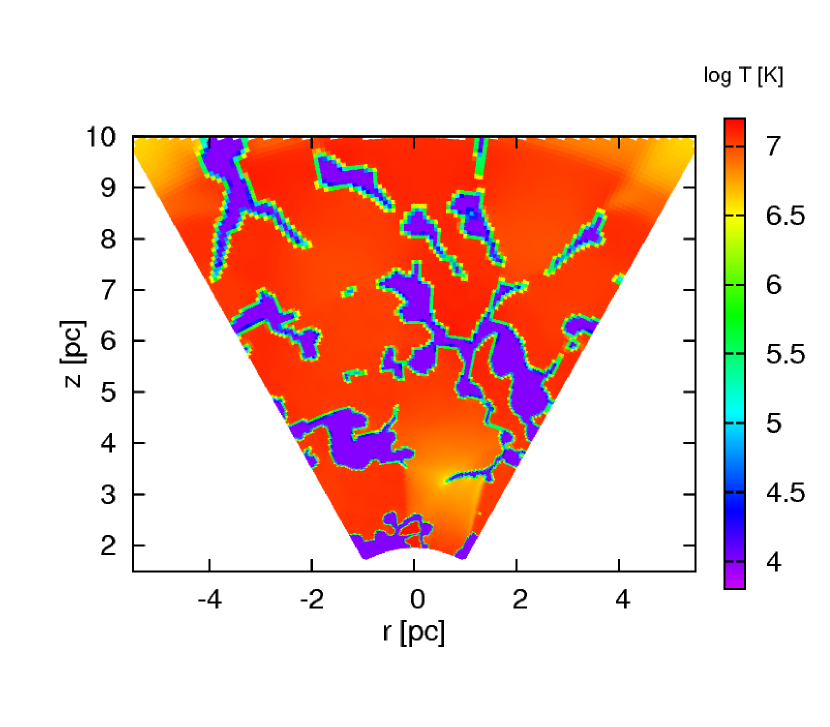
The simulations were carried out on a spherical (,) grid consisting of elements with a typical extent in the -direction (see Figure 2 which shows the logarithm of the particle density and temperature in one of the simulations). To obtain the line profile, we extend the computational domain into a three dimensional sphere by copying and rotating it twice in the -direction and times in the -direction. The resulting sphere consists of elements where indices and identify the position of element in the and directions, respectively. Since the -component of velocity does not exist in 2D simulations, we assume that the two axial directions are statistically equivalent and rotate the -component of the velocity by a random angle in the -direction by setting and where is a random number between and .
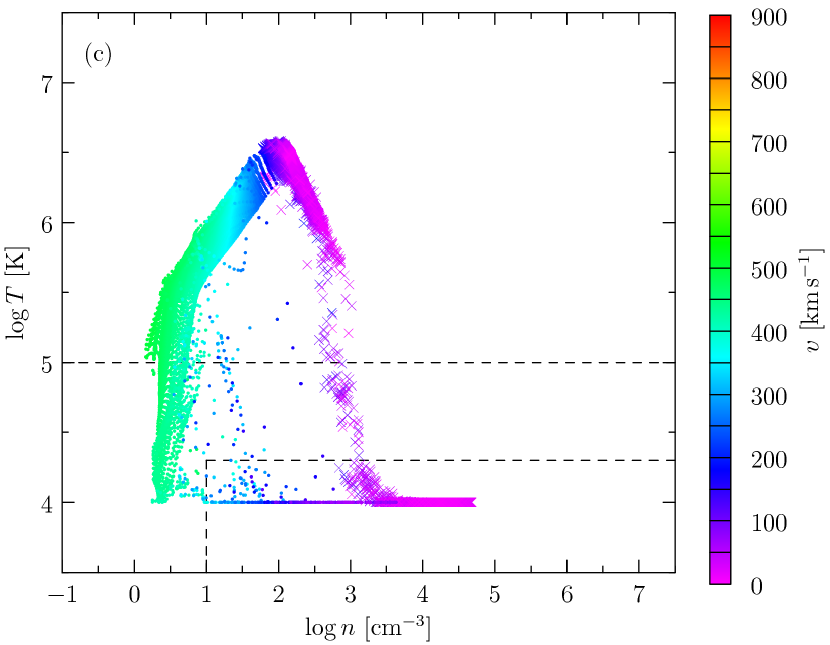
Only elements with and elements with and are taken into consideration for the computation of the line profiles. The high temperature limit, K, ensures that only recombining gas contributes to the line. The low temperature limit, K, is used to exclude the gas in dense warm condensations whose interiors would cool even further and collapse into stars. However in the simulations we artificially maintain the clump temperature at K. This procedure was introduced because the code does not include transport of ionizing radiation which would allow to determine properly the temperature across the dense condensations. We do not apply the low temperature limit for densities below (different for simulations with different cluster parameters), because we would exclude the rarefied wind which cools down as it flows out of the cluster. We set , and cm-3 for Model 5, 6 and 8, respectively. Figure 3 (left panels) shows individual grid cells of the 2D computational domain as points in vs plane and the color denotes the magnitude of the velocity in the cell. Regions contributing to the line calculation are enclosed by the dashed lines. The figures do show the broad range of physical conditions within the matter associated to SSCs. This goes from the densest and coolest gas to the hottest recently re-inserted matter, some of which cools rapidly as it streams as a wind.
For each element, we determine the line-of-sight velocity and the luminosity
| (7) |
where and is the mass density and volume of the element, respectively. We divide the range of all possible line-of-sight velocities into bins of sizes km s-1 and add together contributions of all elements with in a given bin. Finally, we convolve the calculated line profiles with a Maxwell velocity distribution function for km s-1 and normalize the result to the total line luminosity.
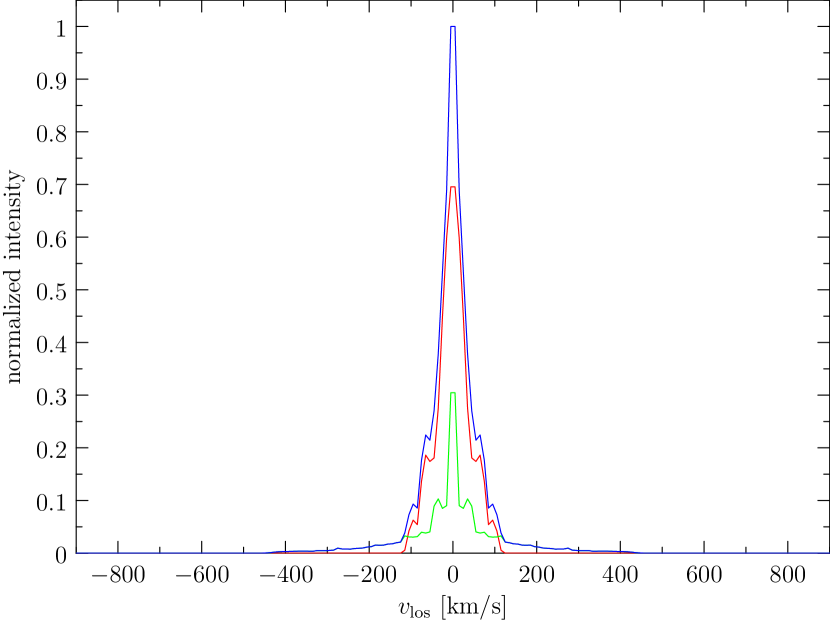
Line profiles computed from cells with (red), (green) and their sum (blue) are shown in the right panels of Figure 3. The half width zero intensity (HWZI), which corresponds to the maximum velocity of the gas, of the narrow component, coming from the cluster interior, is in a good agreement with velocities predicted by Equations (1) and (2) for a given . Similarly, the HWZI of the broad component, coming from outside of the cluster, is in a good agreement with the velocity predicted for the terminal velocity of the cluster wind (equation 6).
Finally, we have checked how the line profiles depend on values of and . It turns out that a ratio of intensities of the two line components is really sensitive to them. It is because by decreasing and increasing , more and more dense gas with preferentially smaller velocities is included into the line computation. However, the HWZI of the two components remains always the same. Therefore, we conclude that 2D simulations lead to supersonic emission lines with two (narrow and broad) components with widths in agreement with our analytical results for repressurizing shocks and the cluster wind, respectively.
We thus associate the supersonic line profile produced by the multiple repressurizing shocks that evolve within the stagnation volume to the high intensity central component detected in massive and compact SSCs. On the other hand, the cluster wind, promotes the appearance of a broader low intensity component. As shown in Figure 1, both speeds, that of the repressurizing shocks and that of the cluster wind, attain a unique value for every , and these should correspond to the largest speeds (HWZI) that one could infer from the gaussian components used to fit the observed lines. This is the case for example in He 2-10. Henry et al. (2007) display the two Br gaussian components for several sources in their Figure 5. If one measures the HWZI of both of these components, both of them independently lead, through Figure 1, to the same value of . We note than in all of these cases the resultant value of is below 20 percent. To fit the two gaussians is sometimes a complicated issue as in Figure 6 of Henry et al. However, if one measures the HWZI of the observed line and assumes that this largest detected speed is due to the wind emanating from the cluster, then Figure 1 will indicate what the value of is. Our findings thus provide a unique tool to measure directly the heating efficiency of SSCs, otherwise, a very elusive quantity.
4 Discussion
The supersonic broad nebular lines detected within young, massive and compact SSCs have been interpreted as arising from the photoionized gas left over from the process of star formation. Despite the fact that such a claim lacks a thorough proof, one should notice in this respect that in the bimodal cases the rapid return of stellar matter into the cluster volume is to lead, in just a few years, to the large densities ( cm-3) detected in these objects.
We have shown here that for clusters undergoing a bimodal hydrodynamic solution, those located in the vs plane above the threshold line, the radiative wind model predicts, despite the large energy input rate, the recurrent appearance of high density condensations continuously accumulating within the stagnation volume. The condensations result from parcels of gas that become thermally unstable and thus, having lost their large temperature () are then compressed by a plethora of repressurizing shocks while being subjected to become photoionized by the cluster radiation field, conforming an HII region right within the cluster volume. Thus, the bimodal model predicts a hot thermalized plasma that co-exists with the warm photoionized gas and the resultant cold dense condensations.
Furthermore, the model predicts two sources of broadening for the nebular lines: the repressurizing shocks and the cluster wind. We associate the denser and slower of these, resultant from the plethora of repressurizing shocks, to the supersonic central component detected in most objects, while the much broader and less intense lines, should emanate from the radiative cluster wind. There is an excellent agreement between the half width zero intensity of the broad lines that result from our 2D calculations and the analytic formulae (equations 2 and 6) derived for the isothermal velocity of the repressurizing shocks and the wind terminal speed both here shown to depend only on . Thus in our model the line broadening has nothing to do with the expansion of the nebula or with the gravity of the system, it is largely due to internal motions repeatedly appearing as the reinserted matter becomes thermally unstable and to the cluster wind photoionized near the cluster surface. Here we have also shown that the broadening of the nebular lines provides an accurate method to infer the heating efficiency within SSCs. The FWHM values of 50 - 200 km s-1 for the narrow and 250 - 550 km s-1 for the broad line profile components used to fit the line emission from clusters reported as presenting supersonic line broadening (see Section 1) imply low values of the heating efficiency, , smaller that 20 percent. Another independent determination of (Silich et al. 2007; 2009) predicts lower but similar values (smaller than 0.1) for M82-A1 and several other clusters in the central zone of M82.
The values and of the lower bound in the temperature interval and the upper bound in density considered in the line profile construction are linked to the thickness of the layer on the surface of warm dense clumps from where the lines emerge. To justify the choice of an specific value, we would need to perform the radiative transfer calculations inside of warm clumps and subsequent processes leading to star formation. This will be important for the discussions of the exact line profile shapes. However, here our aim, our interest, is the terminal velocity of the two line components, which, as shown, depend only on the parameter . We expect the repressurizing shocks to lead to the most intense line. This is because of the large densities involved. The line produced by the wind is always due to be weaker although broader. And thus if a source presents only one component, this has to emanate from the interior of the cluster, from the matter behind the repressurizing shocks.
There is an excellent agreement between the half width zero intensity of the broad lines that result from our 2D calculations and the analytic formulae (equations 2 and 6) derived for the isothermal velocity of the repressurizing shocks and the wind terminal speed both here shown to depend only on .
Note that for clusters undergoing the bimodal solution, within their volume defined by the stagnation radius the hydrodynamic evolution becomes rapidly strongly coupled to the UV radiation field generated by the massive stars in the cluster. These through photoionization, keep the temperature of the thermally unstable gas at K. This is particularly true for very young clusters, before the supernova era starts ( Myr). However, older clusters, with a reduced ionizing photon flux, soon become unable to photoionize all the gas that has become thermally unstable. In this case, the thermally unstable gas would continue to cool further, while being compress into correspondingly smaller volumes. As a result, the increasingly higher densities would be able to trap the ionization front around the outer skins of the condensations while remaining neutral and at low temperatures ( 10 K) within their cores. In this way, if a parcel of gas with an original temperature K, cools down to 10 K, then its volume, in order to preserve pressure equilibrium, would have been reduced six orders of magnitude while its density would become six orders of magnitude larger. Such clusters thus present matter with completely different physical conditions and thus should be easily observed in X-rays, Infrared and radio continuum, while presenting a large extinction at optical wavelengths.
References
- (1) Beck, S. C., Turner, J. L., Langland-Shula, L. E., Meier, D. S., Crosthwaite, L. P. & Gorjian, V. 2002, AJ, 124, 2516
- (2) Beck, S. C. 2008, A&A, 489, 567
- (3) Burke, J. R. & Silk, J. 1974, ApJ, 190,1
- (4) Cantó, J., Raga, A. C. & Rodriguez, L. F. 2000, ApJ, 536, 896
- (5) Chevalier, R. A. & Clegg, A. W. 1985, Nature, 317, 44
- (6) De Pree, C. G., Wilner, D. J., Goss, W. M., Welch, W. J. & McGrath, E. 2000, ApJ, 540, 308
- (7) Galliano, E. & Alloin, D. 2008, A&A, 487, 519
- (8) Gilbert, A. M., Graham, J. R., McLean, I. S. et al. 2000, ApJ, 533, L57
- (9) Gilbert, A. M. & Graham, J. R. 2007, ApJ, 668, 168
- (10) Henry, A. L., Turner, J. L., Beck, S. C., Crosthwaite, L. P. & Meier, D. S. 2007, AJ, 133, 757
- (11) Leitherer, C., Schaerer, D., Goldader, J.D. et al., 1999, ApJS, 123, 3
- (12) Murray, N., Quataert, E. & Thompson, T. A. 2005, ApJ, 618, 569
- (13) Palouš, J., Wünsch, R., Tenorio-Tagle, G. & Silich, S. 2008, IAUS, 254, 233
- (14) Rodríguez-Rico, C. A., Goss, W. M., Turner, J. L. & Gómez, Y. 2007, ApJ, 670, 295
- (15) Shapiro, P. R. & Kang, H. 1987, ApJ, 318, 32
- (16) Silich, S., Tenorio-Tagle, G. & Muñoz-Tuñón, C. 2007, ApJ, 669, 952
- (17) Silich, S., Tenorio-Tagle G. & Rodríguez González, A. 2004, ApJ, 610, 226
- (18) Silich, S., Tenorio-Tagle, G., Torres-Campos, A., Muñoz-Tuñón, C., Monreal-Ibero, A. & Melo, V. 2009, ApJ, 700, 931
- (19) Silk, J. & Burke, J. R. 1974, ApJ, 190, 11
- (20) Tenorio-Tagle, G. 1996, AJ, 111, 1641
- (21) Tenorio-Tagle, G., Silich, S., Rodríguez-González A. & Muñoz-Tuñon, C., 2005, ApJ Lett. 628, L13
- (22) Tenorio-Tagle, G., Wünsch, R., Silich, S. & Palouš, J. 2007, ApJ, 658, 1196
- (23) Turner, J.L., Beck, S.C. & Ho, P.T.P. 2000, ApJ, 532, L109
- (24) Turner, J. L., Beck, S. C., Crosthwaite, L. P. et al. 2003, Nature, 423, 621
- (25) Vietri, M. & Pesce, E. 1995, ApJ, 442, 618
- (26) Wünsch, R., Silich, S. Palouš, J. & Tenorio-Tagle, G. 2007, A&A, 471, 579
- (27) Wünsch, R., Tenorio-Tagle, G., Palouš, J. & Silich, S. 2008, ApJ, 683, 683
- (28) Zeldovich, Ya. B. & Raizer, Yu. P. Physics of Shock Waves and High-Temperature Hydrodynamic Phenomena, vol. 2 NY: Academic
Appendix A On the effects of radiation pressure
The effects of radiation pressure are not included since the dust evaporates rather fast due to sputtering in a medium with temperature K and density cm-3. This may be estimated using a formula given by Silk & Burke (1974) who gave the time-scale for destruction of dust grains by sputtering:
| (A1) |
Here is the number density, is temperature and is sputtering yield per collision, which is (see Figure 2, Burke & Silk, 1974). This gives for our typical values about yr as the grain destruction time-scale. Thus we conclude that there is little dust in our wind, which brings the momentum delivery by radiation close to zero. Another argument for not including dust is that we model a young cluster, where AGB stars, a potential major source of dust, are absent.
However, if the dust would be able to survive in the hot environment, the wind velocity may be estimated from the pressure on dust grains considering its opacity in the following way. The equation of motion for a wind with optical depth inside the star cluster volume is (see, for example, equation 24 in Murray et al. 2005):
| (A2) |
Outside the star cluster volume it is:
| (A3) |
where is the flow velocity, is the speed of light, G the gravitational constant, is the mass within radius , is the star cluster bolometric luminosity, and is the opacity per unit mass of gas. The optical depth is:
| (A4) |
Let us neglect the gravitational pull from the cluster. Then one can integrate equations (A2) and (A3) taking into consideration that , , where is the star cluster mechanical luminosity and the maximum value of according to the Starburst99 synthesis model (Leitherer et al. 1999), and that inside the cluster
| (A5) |
where is the mass deposition rates per unit volume. The integration yields:
| (A6) |
In our calculations it was adopted that km/s. Equation (A6) thus implies that even if dust grains can survive inside the hot thermalized plasma, and if its optical depth is large (), the maximum flow velocity would be km s-1 which is well below .
![[Uncaptioned image]](/html/0911.4399/assets/x4.png)
![[Uncaptioned image]](/html/0911.4399/assets/x5.png)
![[Uncaptioned image]](/html/0911.4399/assets/x6.png)
![[Uncaptioned image]](/html/0911.4399/assets/x7.png)