The Origin of the Hubble Sequence in CDM Cosmology
Abstract
The Galform semi-analytic model of galaxy formation is used to explore the mechanisms primarily responsible for the three types of galaxies seen in the local universe: bulge, bulge+disk and disk, identified with the visual morphological types E, S0/a-Sbc, and Sc-Scd, respectively. With a suitable choice of parameters the Galform model can accurately reproduce the observed local -band luminosity function (LF) for galaxies split by visual morphological type. The successful set of model parameters is used to populate the Millennium Simulation with 9.4 million galaxies and their dark matter halos. The resulting catalogue is then used to explore the evolution of galaxies through cosmic history. The model predictions concur with recent observational results including the galaxy merger rate, the star formation rate and the seemingly anti-hierarchical evolution of ellipticals. However, the model also predicts significant evolution of the elliptical galaxy LF that is not observed. The discrepancy raises the possibility that samples of 1 galaxies which have been selected using colour and morphological criteria may be contaminated with galaxies that are not actually ellipticals.
keywords:
galaxies: elliptical and lenticular, cD; galaxies: evolution; galaxies: formation; galaxies: luminosity function; galaxies: spiral; galaxies: structure1 Introduction
The current paradigm, constrained in part by the -band (hereafter -band) luminosity function (LF) (e.g., Benson et al. 2003), has galaxy disks forming through a combination of cold gas accretion (Weinberg et al., 2004) and feedback (Oppenheimer & Davé, 2006), with bulges resulting from mergers (e.g., Barnes & Hernquist, 1992; Hopkins et al., 2008; Masjedi et al., 2008). Thus, the diversity of galaxy morphologies seen today represents the culmination of multiple evolutionary paths. These end points in galaxy evolution are captured in a taxonomy devised by Hubble (1936) and refined by de Vaucouleurs (1959) and de Vaucouleurs et al. (1991) that is based on the relative prominence of the stellar bulge and the degree of resolution of the spiral arms. Despite attempts to emulate this classification scheme using quantitative proxies such as colours (e.g., Strateva et al., 2001), concentration-asymmetry indices (e.g., Watanabe et al., 1985; Abraham et al., 1996; Bell et al., 2003), the Gini-M20 classifiers (Lotz et al., 2004) and parametric methods involving bulge/disk decompositions (Schade et al., 1996; Ratnatunga et al., 1999; Simard et al., 2002) there are no quantitative measures that uniquely segregate galaxies into the morphological groups represented by the de Vaucouleurs numerical T system (e.g., Graham & Worley, 2008). Thus, proxies are merely a useful stopgap until the difficult and time consuming task of assigning visible morphologies to the ever-growing number of cataloged galaxies can be accomplished111See the Galaxy Zoo Project, http://www.galaxyzoo.org/.
Fortunately, the time-consuming task of assigning visible morphologies has now been completed for the vast majority of nearby galaxies. The principal aim of this paper is therefore to use the -band LF for nearby galaxies (Devereux et al., 2009) to constrain models of their formation and evolution. The -band LF is of particular interest because of its relevance to understanding galaxy evolution in the context of Lambda Cold Dark Matter (CDM) cosmology; at , the -band LF traces the stellar mass accumulated in galaxies at a wavelength where interstellar extinction is minimal (Devereux et al., 1987; Bell & de Jong, 2000; Bell et al., 2003). Additionally, the functional forms for the -band LFs distinguish between bulge dominated and disk dominated systems which suggests that at least two quite distinct galaxy formation mechanisms are at work to produce the diversity of morphological types seen in the local universe. Previous attempts to model the LFs in the context of hierarchical clustering scenarios (e.g., Cole et al., 2000; Benson et al., 2003) have focussed on the Universal or Total -band LF, which is the sum over all galaxy types, because they are based on samples for which there are no pre-existing morphological assignments. In this paper, the -band LFs are modeled for galaxies segregated by visible morphology in order to better understand: 1) the origin and evolution of bulgeless disk galaxies, represented in the observable universe by Sc-Scd galaxies; 2) the role of secular processes in building the bulges of spiral (S0/a—Sbc) and lenticular galaxies and; 3) the galaxy merger history that led to the formation of elliptical galaxies. Our analysis differs from Parry et al. (2009) in that the GALFORM model predictions are constrained by the observed -band LFs for galaxies of different morphological type. Those model predictions are then compared with recent observational results including the type averaged galaxy merger rate and the type specific star formation rate, both quantified as a function of redshift.
Observationally, there is a weak dependence of -band B/T on visual morphology (Graham & Worley 2008) which is used in this paper to segregate the model galaxies into three broad groups representing the three types of galaxies seen in the local universe, namely bulge, bulge+disk and disk.222In principle, other outputs from the model could be used to provide additional information on morphological type. However Graham & Worley (2008) show that bulge/disk flux ratio is the most useful discriminant as it varies more, as a function of morphological type, than other indicators, such as bulge/disk size ratio, for example. These three groups are identified with the visual morphological types E, S0/a-Sbc, and Sc-Scd, respectively. Following Graham & Worley (2008), these three broad groups are identified in the models by adopting the range of B/T ratio listed in Table 1. The table also indicates the distribution of B/T within each morphological class, illustrating that most disk galaxies (including S0’s) have a rather low B/T ratio. For example, 80% of S0 and later type galaxies brighter than have B/T 0.54. If the magnitude limit is lowered to , we find that 80% of such galaxies have B/T 0.35. This is in agreement with the broad conclusion of Graham & Worley (2008) that most disk galaxies (including S0’s) have low B/T ratios (e.g. B/T 1/3).
| Morphological | B/T distribution | |||
|---|---|---|---|---|
| class | B/T Range | 20% | 50% | 80% |
| E | 0.99 | 1.00 | 1.00 | |
| S0-Sbc | 0.22 | 0.39 | 0.65 | |
| Sc-Scd | 0.00 | 0.01 | 0.05 | |
2 Model
The Galform semi-analytic model has been described most recently by Bower et al. (2006) and the reader is referred to that paper for a full description. In the model, galaxies consist of an exponential disk containing both gas and stars and a spheroidal stellar component—the morphology of the model galaxies is therefore determined by the relative amount of light in each component. A few key points regarding morphological evolution of model galaxies bear reiterating however:
-
•
Galaxies initially form through the cooling of gas from their surrounding dark matter halo. This gas is assumed to conserve its angular momentum during collapse and to therefore form a disk. As such, a galaxy formed in isolation will always be a pure disk galaxy unless it is sufficiently self-gravitating to become unstable.
-
•
Disks which become too self-gravitating become unstable to the formation of global perturbations and therefore destroy themselves. Instability is judged using the criterion proposed by Efstathiou et al. (1982). For a disk to be stable it must satisfy
(1) where is the circular velocity of the disk at its half-mass radius, and is the mass of the disk. The value of for purely stellar disks was found to be by Efstathiou et al. (1982), although lower values may be appropriate for gas rich disks (Christodoulou et al. 1995). We treat as a free parameter. If a disk is deemed to be unstable according to this criterion, the disk is destroyed, with any stars and gas present forming a spheroidal system in which the gas is then rapidly turned into stars333Since the treatment of this instability process in semi-analytic models is somewhat uncertain, an alternative and less dramatic implementation is presented in the Appendix A.2. The results do not change the qualitative conclusions of this paper.. The end result is a purely spheroidal (a.k.a. elliptical) system.
-
•
Mergers between galaxies can also create a spheroidal component. Galaxy-galaxy mergers are driven by dynamical friction on a satellite galaxy (and its halo) orbiting in a larger dark matter halo. Merging timescales are computed using a modified form of Chandrasekhar’s dynamical friction equation (Lacey & Cole 1993). The timescales are scaled by , a parameter of the model, to allow some adjustment of merger rates. Mergers are split into two categories:
-
–
Minor Mergers: These are mergers with where and are the baryonic masses of the galaxies involved in the merger and is a parameter of the model (see below). In a minor merger, the stars from the secondary (lower mass) galaxy are added to the spheroidal component of the primary (more massive) galaxy while any gas from the secondary is added to the disk of the primary. A galaxy can therefore grow a spheroidal component through the cumulative effects of many minor mergers.
-
–
Major Mergers: These are mergers with and cause the destruction of any prexisting stellar disks, such that all stars from the merging galaxies become part of the spheroidal component in the merger remnant. The fate of any gas in the merging galaxies also depends on the merger mass ratio:
-
–
If , where is a parameter of the model, then the merger does not trigger a burst of star formation and any gas forms a disk in the merger remnant (and may subsequently form stars in that disk).
-
–
If then the merger triggers a burst of star formation and any gas present in the merging galaxies is turned into stars on a short timescale and becomes part of the spheroidal component of the merger remnant.
-
–
-
•
Once a spheroidal component has formed, subsequent gas cooling can cause a disk to regrow around the spheroid, resulting in a galaxy with intermediate bulge-to-total ratio.
-
•
The model includes supernovae feedback which is assumed to drive gas out of a galaxy at a rate proportional to the star formation rate: , where , is the circular speed of the galaxy and and are parameters of the model. may differ for quiescent star formation in disks and bursts of star formation.
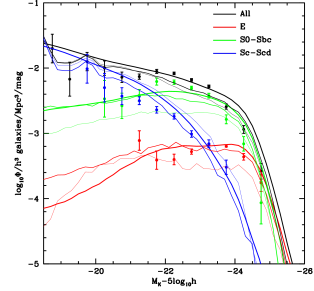
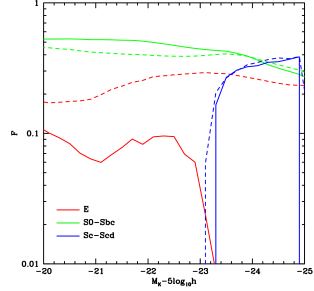
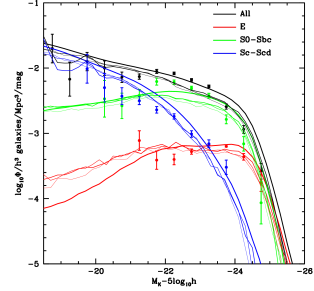
The Bower et al. (2006) model was not constructed using morphological data as a constraint. Our initial goal, therefore, is to adjust the parameters of the Bower et al. (2006) model so that it reproduces the observed morphologically segregated LFs of Devereux et al. (2009), shown in Figure 1. A search for an alternative set of values for the six model parameters that match the observed morphologically selected LFs yielded the values listed in Table 2. The best fit model LFs (lines) are compared with the observed LFs from Devereux et al. (2009) (points) in Figure 1. Morphological class is indicated by colour in the figure. The relative abundance of each type in the model is forced to agree with the data in the interval (this is how the mapping between B/T and morphological class listed in Table 1 was determined) but the morphological mix is not enforced outside this magnitude range. Also shown, for reference, are the results from the unmodified Bower et al. (2006) model (dashed lines). The comparison shows that the model results are quite similar.
The model LFs for ellipticals, lenticulars and bulge-dominated spirals are peaked and decline toward both higher and lower luminosities. In contrast, the Sc-Scd class continues to rise towards low luminosities and dominates the total LF for . The black line and points indicate the total (i.e. all morphological types) LF. Not surprisingly, the model prediction here is also in good agreement with the data. This is to be expected however, since the model parameters are optimised to yield a satisfactory representation of the observed LFs for each of the three broad morphological types and the total LF is just the sum of these. Additionally, Bower et al. (2006) have already demonstrated that the model can fit the observed total K-band LF. The parameters yielding the best-fit model (Table 2) are similar to those adopted by Bower et al. (2006): disk instability estimates are unchanged, but the rate of galaxy merging has been reduced by a factor of 2, a lower mass ratio in mergers is required to disrupt stellar disks, a higher ratio is required to trigger a burst, while the feedback in bursts, but not disks, has been weakened.
| Value | ||
|---|---|---|
| Parameter | Best Fit | Bower et al. 2006 |
| 0.8 | 0.8 | |
| 3.0 | 1.5 | |
| 0.15 | 0.3 | |
| 0.2 | 0.1 | |
| 485km/s | 485km/s | |
| 300km/s | 485km/s | |
3 Results
Having found a successful set of model parameters, they are used to populate the Millennium Simulation (Springel et al. 2005) with galaxies. To do this, dark matter halo merger trees are extracted from the Millennium Simulation using the techniques described by Harker et al. (2006). The trees are then populated with galaxies in the manner described by Bower et al. (2006), but using the model parameters found in the previous section. This results in a catalogue of 9.4 million galaxies and their dark matter halos. The catalogue provides the magnitudes, morphologies and other physical characteristics for all of the galaxies, including their evolution through cosmic history. The catalogue can therefore be used to explore galaxy evolution. Our goal is to reveal the key physical processes at work that produce the three broad types of galaxies in the observable universe, namely bulges, bulges+disks and disks. The resolution of the Millennium Simulation, as in any N-body simulation, is limited. In Appendix A.1 a study of the effects of resolution demonstrates that the morphological features of the model galaxies are well converged at the resolution of the Millennium Simulation.
3.1 Trends with Morphological Class
3.1.1 Dark Matter Halo Properties
The relationship between galaxy luminosity and dark matter halo mass is illustrated in Fig. 2 as a function of morphological type. The solid lines in Fig. 2 indicate the mass of the halo in which a galaxy formed, defined here following Cole et al. (2000) such that halos are labelled as “reforming” each time they undergo a doubling of their mass. As may be expected there is a correlation between galaxy luminosity and the median mass of the dark matter halo in which such galaxies formed. The slope of the relation is quite flat however, showing a range of a factor of 20 in halo mass over a factor of 100 range in luminosity.
There is little dependence of median formation halo mass on morphological type, except for the E class which form in halos around a factor of 3 more massive for a given luminosity. This may be expected for the E class if such galaxies are built up via merging rather than continuous gas accretion. To attain the same luminosity as its accretion-fueled counterpart, a merger-built galaxy must form in a more massive halo so that the rate of merging will be enhanced.
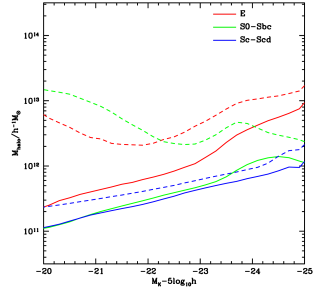
The dashed lines in Fig. 2 indicate the mass of the dark matter halo in which a galaxy lives at . In the case of satellite galaxies, this is the mass of the isolated dark matter halo in which they orbit, not the mass of the subhalo within which they reside. The difference between the dashed and solid lines is therefore indicative of how much mass has accumulated in the dark matter halo since galaxies formed. Dark matter halos may grow through mergers of satellites and by accretion. With the exception of Sc-Scd galaxies, the mass of the halo in which galaxies live at greatly exceeds the mass of halo in which they formed, particularly for the lower luminosity systems (a simple consequence of the fact that the low mass halos in which these faint galaxies form are highly likely to be subsumed into much more massive halos by by becoming satellites of those halos).
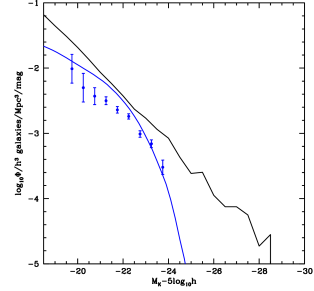
Interestingly, Sc-Scd galaxies of all luminosities occupy dark matter halos that are only about a factor of two more massive than those in which they formed. Thus, disk dominated galaxies must have avoided major mergers by virtue of living in dark matter halos having rather quiet merging histories. There are a wide variety of possible merger histories for halos of a given mass (Stewart et al. 2008) including some fraction which will have avoided major mergers. It is known that halos in low density environments experience lower merger rates than their counterparts in high density environments (Fakhouri & Ma 2009) and so are more likely to have a quiet merger history. Thus, Sc-Scd type galaxies are distinguished from the other morphological types having formed preferentially in low density environments. 65% of Sc-Scd galaxies brighter than are central galaxies, ie. they are the most massive galaxy in their halo, and they grow primarily through gas accretion and not mergers. Consequently, the Sc-Scd K-band luminosity function has a similar slope to the median formation halo mass function as illustrated in Fig. 3
3.1.2 Timescales
While interesting from a theoretical standpoint, dark matter halo masses cannot be easily measured for most galaxies. (Although weak lensing (Mandelbaum et al. 2006) and clustering (Mandelbaum et al. 2009) measures can constrain halo mass for classes of galaxies.) Greater utility is provided by examining observable quantities more directly related to the galaxies themselves, beginning with timescales.
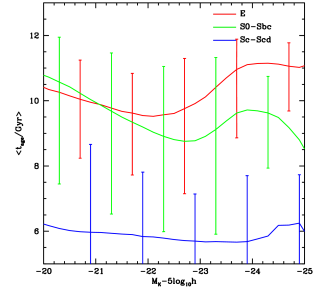
Figure 4 shows the median stellar mass-weighted age of galaxies, defined as
| (2) |
where is the current age of the Universe and is the star formation rate in a galaxy at time , split by morphological type as a function of their -band magnitude. Disk dominated galaxies (blue line) are distinguished once again, this time by hosting a uniformly much younger stellar population than any other morphological type. This suggests that disk galaxies of all luminosities have been continuously forming stars since their formation which the model reveals is at a rate that is proportional to the baryonic mass of the galaxy. In contrast the ellipticals, lenticulars and bulge dominated spirals contain much older stellar populations with median ages of 10Gyr. This does not mean that the galaxies formed 10Gyr ago, merely that the stars now dominating the baryonic mass of the galaxies typically formed at that time. As we shall see in §3.1.4, massive ellipticals were actually assembled much more recently.
3.1.3 Bursts and Bulge Formation
Figure 5 examines the fraction of a galaxy’s bulge mass that was made in the most recent burst of star formation (solid lines) and the fraction formed through disk instabilities (the remainder being made through minor or major mergers). Interestingly, 30–50% of the bulge mass in lenticulars and bulge dominated spirals (S0/a - Sbc) resulted from disk instabilities with the remainder created in the most recent burst of star formation, which occurrred 10Gyr ago, that itself could have been triggered by a disk instability or a merger. Unfortunately, there is no way to distinguish between the two possibilties in this figure. The importance of these processes is greatly diminished in elliptical galaxies, because they do not possess disks444The dashed lines reflect the mass of stars that were formed through disk instabilities in all progenitors. Thus the dashed red-line indicates that disk instabilties may have been an important mechanism for the progenitors of todays ellipticals. We note that the fraction of an elliptical’s mass which formed as a result of disk instability events is sensitive to the details of the treatment of such instabilities in our model. With our standard treatment, on averge 29% of the spheroid mass in bright () ellipticals is made via disk instability events. Using a more moderate treatment of instability events in which a minimal amount of disk is converted into spheroid (see Appendix A.2) this number is reduced to 9%. These fractions are relatively insensitive to the resolution of the merger trees. The resolution study described in Appendix A.1 indicates that they change by only 3% for the brightest ellipticals as the resolution of the merger trees is increased by a factor of 16. For the faintest ellipticals shown (which are closer to the resolution limit of our calculations) the fraction changes by only 7% with the same increase in resolution. and in disk dominated Sc-Scd galaxies, because they have small or non existent bulges555However, the models do indicate that disk instabilities may be an important bulge formation mechanism in the luminous, M mag, Sc-Scd galaxies.
3.1.4 Formation and Assembly Redshift Distributions
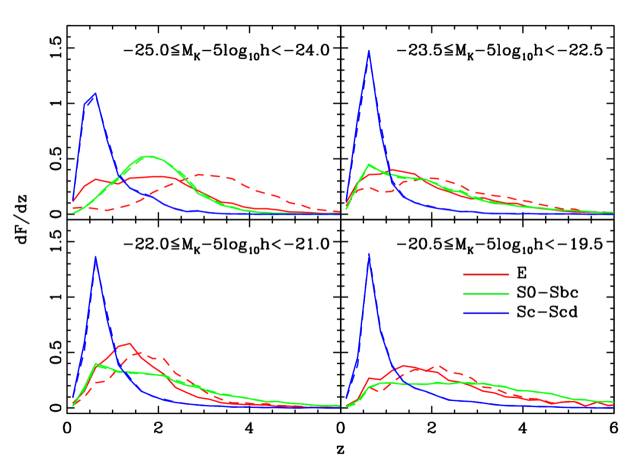
Figure 6 shows the distribution of star formation redshifts, , and assembly redshifts, . The star formation redshift for a galaxy is defined to be the redshift at which half of the final stellar mass of the galaxy has been formed. The assembly redshift is the redshift at which half of the final stellar mass has been assembled into a single progenitor. Clearly for a given galaxy . The most striking feature of these distributions is that the most luminous -25 -24 elliptical galaxies have a median star formation redshift while the median assembly redshift is much lower . This clearly shows that such galaxies are formed almost entirely through the merging of pre-existing systems that formed at higher redshift. The difference between star formation and assembly times diminishes for lower luminosity ellipticals, suggesting fewer mergers. Also, the stellar population is younger in lower luminosity ellipticals compared to their more luminous counterparts by 1 Gyr. Since the other morphological types (S0-Sbc) show remarkably little difference between their star formation and assembly redshift distributions, it is primarily the luminous ellipticals, -25 -24 whose growth is dominated by the delivery of pre-formed stars via mergers that happened recently, since .
The star formation and assembly redshifts are virtually identical for lenticular and spiral galaxies (S0–Scd) which suggests that major mergers do not play an important role in the evolution of these galaxy types. The distributions are strongly peaked at low redshifts for the disk dominated Sc-Scd galaxies. Thus, the models indicate that they should contain the youngest stellar populations with ages 6 Gyrs. On the other hand, the distributions for lenticular and bulge dominated spirals become broader with decreasing luminosity suggesting a heterogeneous group with stellar populations spanning a wide range in age.
4 Discussion
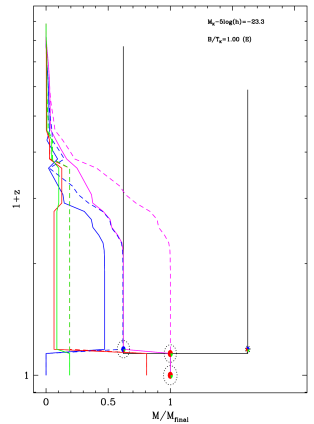
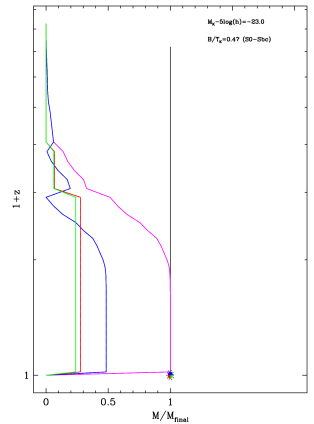
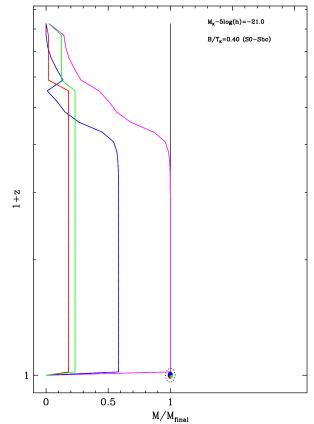
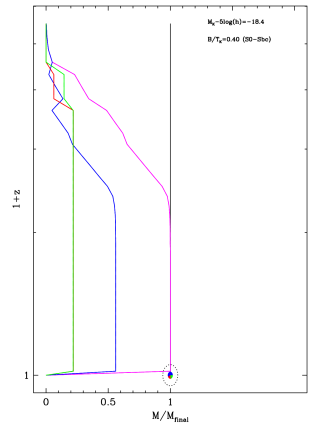
In order to understand both the trends found in §3 and the morphological evolutionary paths of galaxies, we examine formation tree diagrams such as Fig. 7. These show the detailed formation history of individual galaxies and therefore provide a more detailed examination of morphological evolution. The tree shown in Fig. 7 is for a luminous elliptical galaxy. As expected from the results of §3 this galaxy shows significant merging activity. There is a clearly identifiable main progenitor which has been a pure elliptical since . Half of the stars in the final galaxy were formed by but where not assembled into a single galaxy until . Approximately one quarter of the stars in the galaxy were formed as a result of a burst triggered by a disk instability event which occurred at .
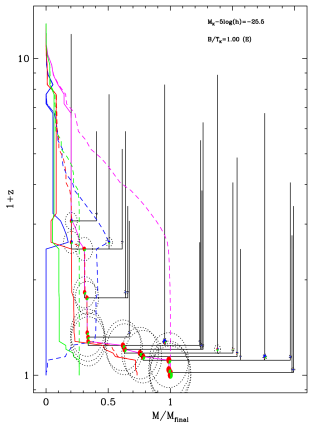
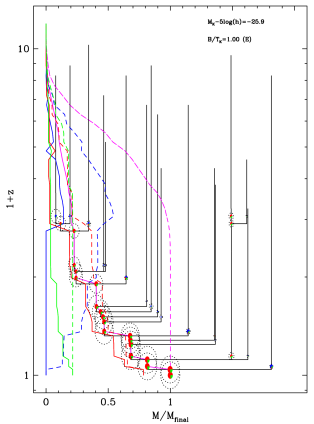
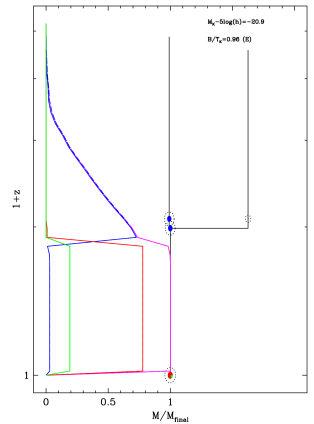
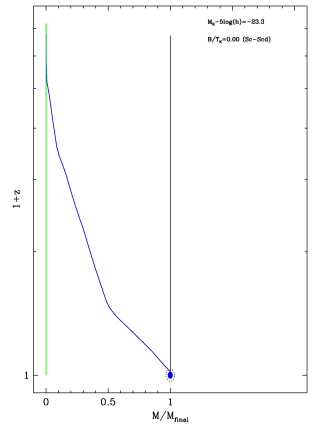
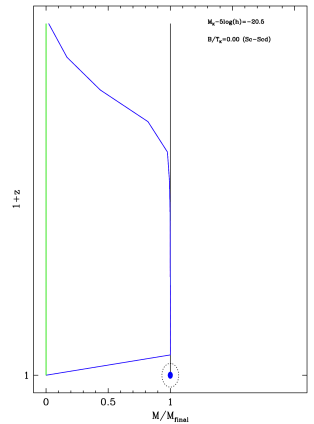
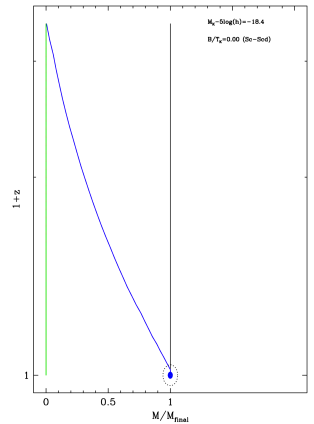
In Figs. 8 through 10 we show tree diagrams for randomly selected galaxies in the E, S0/a-Sbc and Sc-Scd classes for a range of luminosities. (Note that the vertical axis of each plot is adjusted to stretch from to the earliest redshift at which the galaxy has an identifiable progenitor.) The E class shows a clear transition from forming via multiple mergers in the high-luminosity regime to forming via disk instabilities in the low luminosity regime. (A disk instabiity event in these diagrams is apparent as the solid[main progenitor] blue[disk] line drops to zero while the solid green and red lines jump to larger values.) These low luminosity ellipticals start out as disks, gradually converting their gas into stars. Eventually, the disk becomes gravitationally unstable, triggering a burst and converting all stars and gas into a spheroid. The galaxy evolves passively after this time.
It is apparent that the number of progenitors is greatly reduced for the lower luminosity galaxies666Galaxies of luminosity similar to that in panel d of this figure are affected by the resolution limit of the simulation as the halos that they occupy typically contain around 50 particles, preventing their lower mass progenitors from being resolved. For galaxies of luminosity comparable to that in panel c (and brighter galaxies) resolution is not an issue—they inhabit halos typically containing 500 particles, sufficient to permit many lower mass progenitor halos to be resolved in the simulation.. This is apparent for all morphological types except for the Sc-Scd class and is a consequence of the shape of the galaxy mass function in systems of differing halo mass (e.g. Benson et al. 2003)—for the most massive halos the galaxy mass function is a very steep function of halo mass, such that there are many more galaxies of slightly lower mass with which the central galaxy can merge. For lower mass halos, the galaxy mass function is shallower, yielding relatively fewer galaxies of lower mass. This results in fewer galaxies with which to merge and fewer progenitors. The shape of the galaxy mass function in our model arises because of supernovae feedback which is relatively stronger in lower mass halos.
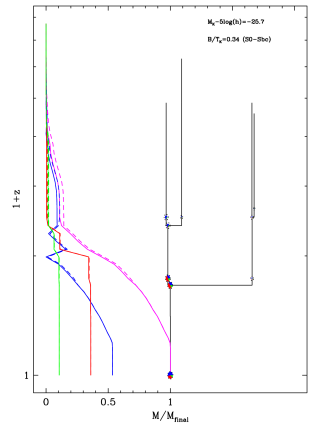
The S0/a-Sbc class has a much quieter history. Only the most luminous examples are involved in a few significant mergers. Lower luminosity systems experience periods of early growth characterized by multiple disk instability events that cause the disk mass to rise and then fall sharply. More recent growth, since , occurs when the disk has stabilized and is able to form stars quiescently until the gas supply is exhausted, typically between and for the lower luminosity systems and for the luminous systems.
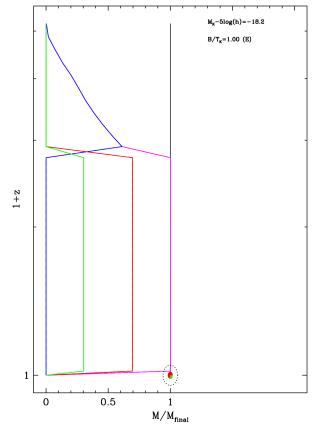
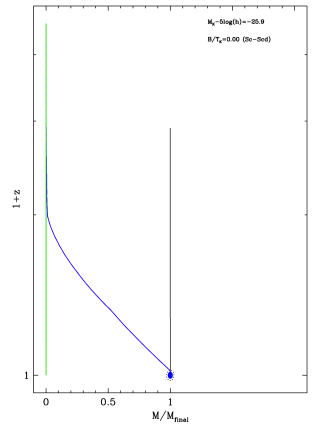
The Sc-Scd class has the most uneventful formation history of all. This is, of course, obvious from the fact that this class is defined to have almost no spheroidal component. These galaxies must therefore have experienced no significant instability or merger events. The tree diagrams of Fig. 10 show that this type of galaxy is characterized by steady star formation in a disk fueled by cosmic infall, which continues either until , or until the galaxy becomes a satellite and therefore loses its gas supply.
4.1 The Merger History as a Function of Morphological Type
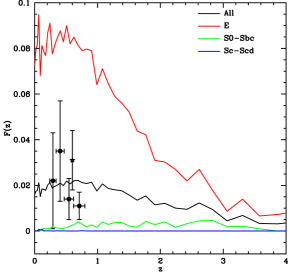
Figure 11 illustrates the merger history as a function of morphological type. is the fraction of galaxies with mass (corresponding to ) that have undergone a major merger () within the past 1Gyr. These selection criteria allow a direct comparison with the observationally determined rates of Jogee et al. (2009) and López-Sanjuan et al. (2009). Galaxies are segregated according to their morphology and the reported merger fractions resulted from integrating their respective merger trees over . The model predicts an average merger fraction integrated over all galaxy types of 2% which compares favorably with the observed lower limit to the major merger fraction for the sample S1 of Jogee et al. (2009) and the merger fraction measured at for a slightly more luminous sample by López-Sanjuan et al. (2009). The model reveals that the merger rate is highest for elliptical galaxies; 8% of ellipticals at resulted from a major merger that occurred in the past 1 Gyr. The model elliptical merger rate is significantly higher than the merger rate estimated by Masjedi et al. (2008) for a sample of luminous red galaxies in close pairs. The model elliptical merger rate predicts significant evolution of the elliptical LF, as discussed in more detail in the next section. Very few of the lenticular and (S0/a-Sbc) spiral galaxies resulted from a major merger and none of the Sc-Scd disk galaxies. Thus, the model predicts that Sc-Scd galaxies exist in the local universe because they have not been involved in any collisions.
We compare our predicted merger rates with other recent attempts to measure this quantity from either N-body simulations of dark matter or from semi-analytic models of galaxy formation. Before doing so, we remind the reader that our merger rate is that of galaxies, and so there is no reason to expect it to coincide with rates of, for example, dark matter halo merging or dark matter subhalo destruction (both of which are commonly measured quantities). In particular, Stewart et al. (2009) examined the rates of both halo merging (when a halo first crosses the virial radius of a larger halo, thereby becoming a subhalo) and subhalo destruction (when a subhalo loses 90% of its mass) in an N-body simulation of dark matter. Stewart et al. (2009) find merger rates which increase monotonically with increasing redshift, in disagreement with our own findings. However, we caution that these results are based purely on dark matter properties (with a simple, redshift dependent mapping of galaxy luminosity to dark matter halo mass) and so do not measure the same quantity as presented in this work. Similar results were found by Genel et al. (2009). On the other hand, Bertone & Conselice (2009) find merger fractions comparable to ours, with a broad peak around and a gradual decline towards higher redshifts. The agreement is not surprising, however, as they derive merger rates from a semi-analytic model similar to the one used here.
4.2 The Evolution of the Elliptical Galaxy Luminosity Function
| Sample | /3 | M∗ 5log10 | j | |
|---|---|---|---|---|
| 10-4 galaxies Mpc-3 mag-1 | mag | 107L⊙ Mpc-3 | ||
| z = 0 | 16.1 0.5 | 23.93 0.07 | 0.48 0.02 | 10.4 |
| z = 1 | 7.1 0.3 | 23.77 0.09 | 0.70 0.02 | 4.3 |
| z = 2 | 4.9 0.2 | 23.15 0.08 | 0.82 0.01 | 1.9 |
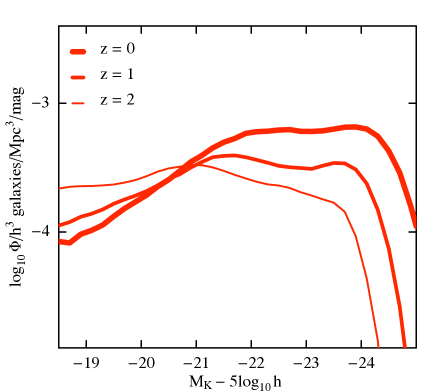
The model predicts significant evolution of the elliptical galaxy K-band luminosity function as illustrated in Figure 12. The LF at each redshift has been k-corrected and further corrected for passive evolution to so that the LFs may be compared on an equal basis. Within the Galform model, k-corrections and passive evolution can be computed precisely. The model predicts the full SED of each galaxy and so we can simply shift the filter to the galaxy rest frame and compute the absolute magnitude which will then automatically include the k-correction. For passive evolution, the model predicts the mix of stars in each galaxy at each redshift, including their distribution of ages and metallicities. To compute the magnitude of the galaxy at assuming passive evolution (i.e. no further star formation) we simply artificially increase the ages of these stars by the lookback time to the current redshift and then sum their SEDs to give the net SED of the galaxy passively evolved to . The passively evolved magnitude of the galaxy is then trivially found by integrating under the appropriate filter response function. Our k and evolution corrections are, at least at low redshifts, in reasonable agreement with those determined observationally by Bell et al. (2003). For example, in the K-band at we find k and evolution corrections of approximately and , to be compared to and from Bell et al. (2003).
Figure 12 shows that the space density goes up at the high luminosity end and down at the low luminosity end as the redshift decreases. These evolutionary changes have been quantified in Table 3 in terms of the Schechter parameters , and . The model results indicate that the mass build-up of ellipticals is reflected in the -band mostly through the large 226% increase in /3 since , and a small, mag, brightening of M.
Parameterizing the LFs allows the luminosity density j to be calculated by integration,
| (3) |
where M⊙ is the absolute magnitude of the Sun, corresponding to 3.32 mag at (Bell et al., 2003). The luminosity density is important as it can provide a constraint on the mass density of stars in galaxies, given a mass to light ratio. The total -band luminosity density at each redshift was calculated by integrating equation 3 over the interval 25 MK5log 19 mag and the results are summarized in Table 3. These values indicate that the luminosity density, or equivalently, the mass density has increased by about a factor of 2.4 since . The predicted evolution since is even more dramatic. These model results concur in general with recent observational results suggesting that the stellar mass contained within the red galaxy population has at least doubled since 1 (Bell et al., 2004; Willmer et al., 2006; Blanton, 2006; Faber et al., 2007; Brown et al., 2007).
Our model results further indicate that the mass density of luminous ellipticals grows at the expense of their lower luminosity counterparts causing the faint end slope to turn downwards with decreasing redshift. Such low luminosity ellipticals are presumably satellites of their more luminous counterparts, they are difficult to detect observationally with current technology and contribute negligibly to the luminosity density evolution of ellliptical galaxies. At the other end of the luminosity range, recent observations (Brown et al., 2007; Cool et al., 2008) indicate that the luminous MB 5log10 -21 red galaxy population, loosely identified with ellipticals, were already in place at whereas the corresponding model elliptical luminosity density, integrated between -24.5 MK 5log10 -25.5, shows an increase by a factor of 4 since . Thus, the model predicts significant evolution of the most luminous elliptical galaxies since that observers do not see. One possible reason for the discrepancy is that the colour selection criteria employed by observers may result in significant contamination of the observational datasets with galaxies that are not actually ellipticals, causing elliptical galaxy evolution to be underestimated. This potential problem with the observations was noted previously by Faber et al. (2007). It is crucial therefore to understand the connection between the luminous red galaxy population seen at 1 and the elliptical population at . Are the luminous red galaxies seen at 1 the progenitors of todays ellipticals or are they dusty objects destined to become what we recognise in the local universe as lenticulars, or early-type spiral galaxies? Of course, another possibility is that the model may be at fault in overestimating the evolution of luminous ellipticals although, in defense of the model, it does succeed in predicting the observed space density of ellipticals at 777Since the parameters of the model were adjusted to match the observed morphologically segregated luminosity functions this is not strictly a prediction. However, the unadjusted Bower et al. (2006) model also yields a similar space density for elliptical galaxies as shown in Figure 1. and the observed type averaged merger rate ( §4.1) and the observed star formation rate, as described in more detail in the next section.
4.3 The Star Formation History as a Function of Morphological Type
With regard to elliptical galaxies, the results presented in Figure 6 confirm the trend seen observationally (e.g., Thomas et al. (2005) and references therein) that the star formation redshift for elliptical galaxies is correlated with their mass (luminosity) in the sense that the stars comprising the more massive (luminous) ellipticals are old. The model predicts that half the stars comprising todays luminous, , ellipticals formed between redshifts of 2 and 4 with ages 10 Gyr and were subsequently assembled via mergers, that occurred since , into the objects we recognise in the local universe as luminous elliptical galaxies. In contrast, stars comprising the lower luminosity, , ellipticals are younger with ages spanning 4–10 Gyrs and that were created in star formation episodes the most recent of which were triggered by disk instabilities that occurred since . Thus, the seemingly anti-hierarchical behavior depicted in Figure 6 results from the fact that there are different mechanisms governing the star formation history of ellipticals: mergers for the luminous ones and disk instabilities for the less luminous ones. These results on formation redshift are insensitive to merger tree mass resolution (with galaxy mean stellar ages changing by only a few percent if we increase the merger tree resolution by a factor of 16) and to the details of the treatment of disk instabilities (adopting the minimalistic model of Appendix A.2 results in changes to mean stellar age of less than 10%). We note that, in our model, the amount of mass brought in to low luminosity ellipticals by minor mergers is relatively small due to the strong supernovae feedback which acts to suppress galaxy growth in lower mass halos.
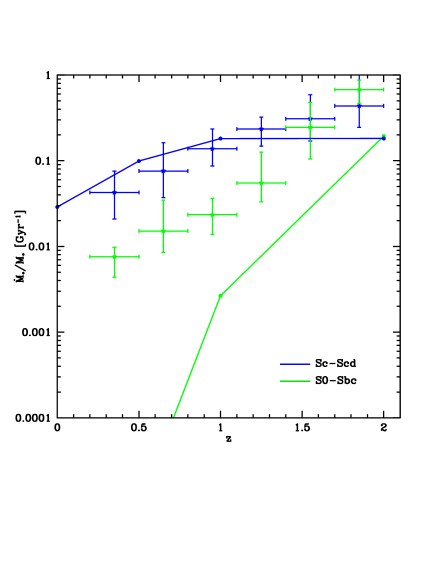
In Figure 13 we compare model predictions concerning the evolution of the specific star formation (SSF) rates with those measured recently by Pérez-González et al. (2008) for massive 1011 M⊙ galaxies. The measured star formation rates are computed assuming a Chabrier initial mass function and so correspond to the total star formation rate (i.e. including stars of all masses). The same is predicted by the model (in which we compute the total star formation rate from the known dynamical time and gas content of each model galaxy). The principal merits of the Pérez-González et al. (2008) work are that the SSF rates are based on UV to Mid IR photometry and the results are segregated by visual morphology. The figure shows that the observed SSF rates for ‘disky galaxies’ and ‘spheroids’ are bounded by the model predictions for ‘disk’ and ‘bulge+disk’ galaxies and both the model and observations show a well established trend that the SSFR is decreasing with decreasing redshift, with implications for the stellar mass accumulated in these types of systems (Dahlen et al., 2007; Chen et al., 2009).
4.4 The Secular Evolution of Bulges
The model predicts that the bulges in spiral galaxies have grown through a combination of disk instabilities and minor mergers. Observationally, the colour of bulges are more similar to the disks in which they reside than to other bulges (Balcells & Peletier 1994; Peletier & Balcells 1996). This coupling between bulge and disk colour has been observed out to (Domínguez-Palmero & Balcells 2008, 2009) where younger, bluer high surface brightness bulges have been observed, suggesting an epoch of bulge formation. In concurrence with the observations, the model predicts that bulges in luminous spiral galaxies have grown significantly through a combination of disk instabilities and minor mergers since and the model further predicts that bulges have been growing for a much longer time period, since , in lower luminosity systems.
| a | b |
 |
|
| c | d |
 |
 |
| a | b |
 |
|
| c | d |
 |
 |
| a | b |
 |
|
| c | d |
 |
 |
5 Conclusions
The Galform semi-analytic model of galaxy formation (Bower et al., 2006) has been employed to reproduce and explain trends in galaxy morphology seen across a wide range of luminosities. Small adjustments to the model parameters permit excellent agreement with the observed morphologically selected -band LF of Devereux et al. (2009), although the unmodified Bower et al. (2006) model also performs very well. While predicting morphology from semi-analytic models (and numerical simulations) remains challenging, a conservative approach has been adopted by categorising model galaxies into just three broad classes: E (“pure spheroid”), S0-Sbc (“intermediate”) and Sc-Scd (“pure disk”) based on their -band bulge-to-total luminosity ratio. Within this conservative categorisation, the results presented are converged with respect to the resolution of the N-body-derived merger trees (see Appendix A.1). Our conclusions follow.
-
•
The Sc-Scd disk galaxies, with 10% or less of their K-band light coming from the bulge, can form in abundance even in a hierarchical cold dark matter cosmology in which merging is, in general, commonplace. The median merger history of the halos that these galaxies inhabit is not significantly different from that of elliptical galaxies which do experience significant merging. However, the variation around that median history is much less for the Sc-Scd galaxies than for ellipticals. The Sc-Scd class typically experience a very simple accretion history, deviating little from the median and exhibiting relatively few large merging events. The formation history of these systems is therefore determined by the rate of growth of their dark matter halo and the corresponding rate of gas supply, cooling and infall. Galaxies in this class have typically been forming stars in their disks over large fractions of cosmic history and continue to do so at the present day. Steinmetz & Navarro (2002) and, more recently, Dutton (2009) have suggested that producing bulge-less disk galaxies in sufficient numbers could be challenging in a CDM universe. In fact, because there is a sufficiently large number of dark matter halos with relatively quiet merging histories, bulge-less disk galaxies can prevail, in the numbers observed. Additionally, strong feedback prevents the formation of relatively massive satellites around these galaxies which are predominantly low mass.
-
•
Luminous elliptical galaxies form through multiple mergers of smaller progenitors. For the most massive ellipticals these mergers tend to be “dry” and so contribute no new star formation. Interestingly, the Galform model does not produce the dwarf elliptical sequence which should emerge at mag. Thus, the model prediction concerning the shape of the LF for low luminosity ellipticals (with mag) and the model prediction that they form through disk instability events is uncertain.
-
•
The intermediate morphological types, S0-Sbc, are characterized by an early period of merging and disk instability events which form the bulge, followed by an extended period of steady, uninterrupted disk growth.
-
•
The model results concur with several observational results including the type averaged galaxy merger rate, measurements of the specific star formation rate, the secular evolution of spiral bulges, the seemingly anti-heirarchical evolution of elliptical galaxies and the factor of 2 growth in the luminosity density of elliptical galaxies since z 1. With regard to the last point however, the model predicts significant evolution at the high luminosity end of the -band elliptical galaxy LF that has yet to be confirmed observationally.
Acknowledgments
AJB acknowledges support from the Gordon and Betty Moore Foundation and would like to acknowledge the hospitality of the KITP at the University of California, Santa Barbara where part of this work was completed. This research was supported in part by the National Science Foundation under Grant No. NSF PHY05-51164.
References
- Abraham et al. (1996) Abraham R. G., Tanvir N. R., Santiago B. X., Ellis R. S., Glazebrook K., van den Bergh S., 1996, MNRAS, 279, L47
- Agertz et al. (2009) Agertz O., Teyssier R., Moore B., 2009, MNRAS, 397, L64
- Balcells & Peletier (1994) Balcells M., Peletier R. F., 1994, Astronomical Journal, 107, 135
- Barnes & Hernquist (1992) Barnes J. E., Hernquist L., 1992, Annual Review of A&A, 30, 705
- Bell & de Jong (2000) Bell E. F., de Jong R. S., 2000, MNRAS, 312, 497
- Bell et al. (2003) Bell E. F., McIntosh D. H., Katz N., Weinberg M. D., 2003, ApJ Supplement Series, 149, 289
- Bell et al. (2004) Bell E. F., Wolf C., Meisenheimer K., Rix H., Borch A., Dye S., Kleinheinrich M., Wisotzki L., McIntosh D. H., 2004, ApJ, 608, 752
- Benson et al. (2003) Benson A. J., Bower R. G., Frenk C. S., Lacey C. G., Baugh C. M., Cole S., 2003, ApJ, 599, 38
- Benson et al. (2003) Benson A. J., Frenk C. S., Baugh C. M., Cole S., Lacey C. G., 2003, MNRAS, 343, 679
- Bertone & Conselice (2009) Bertone S., Conselice C. J., 2009, MNRAS, 396, 2345
- Blanton (2006) Blanton M. R., 2006, ApJ, 648, 268
- Bower et al. (2006) Bower R. G., Benson A. J., Malbon R., Helly J. C., Frenk C. S., Baugh C. M., Cole S., Lacey C. G., 2006, MNRAS, 370, 645
- Brown et al. (2007) Brown M. J. I., Dey A., Jannuzi B. T., Brand K., Benson A. J., Brodwin M., Croton D. J., Eisenhardt P. R., 2007, ApJ, 654, 858
- Chen et al. (2009) Chen Y., Wild V., Kauffmann G., Blaizot J., Davis M., Noeske K., Wang J., Willmer C., 2009, MNRAS, 393, 406
- Christodoulou et al. (1995) Christodoulou D. M., Shlosman I., Tohline J. E., 1995, ApJ, 443, 551
- Cole et al. (2000) Cole S., Lacey C. G., Baugh C. M., Frenk C. S., 2000, MNRAS, 319, 168
- Cool et al. (2008) Cool R. J., Eisenstein D. J., Fan X., Fukugita M., Jiang L., Maraston C., Meiksin A., Schneider D. P., Wake D. A., 2008, ApJ, 682, 919
- Croton et al. (2006) Croton D. J., Springel V., White S. D. M., Lucia G. D., Frenk C. S., Gao L., Jenkins A., Kauffmann G., Navarro J. F., Yoshida N., 2006, MNRAS, 365, 11
- Dahlen et al. (2007) Dahlen T., Mobasher B., Dickinson M., Ferguson H. C., Giavalisco M., Kretchmer C., Ravindranath S., 2007, ApJ, 654, 172
- de Vaucouleurs (1959) de Vaucouleurs G., 1959, Handbuch der Physik, 53, 275
- de Vaucouleurs et al. (1991) de Vaucouleurs G., de Vaucouleurs A., Corwin H. G., Buta R. J., Paturel G., Fouque P., 1991, Third Reference Catalogue of Bright Galaxies
- Devereux et al. (2009) Devereux N., Willner S. P., Ashby M. L. N., Willmer C. N. A., Hriljac P., 2009, ApJ, 702, 955
- Devereux et al. (1987) Devereux N. A., Becklin E. E., Scoville N., 1987, ApJ, 312, 529
- Domínguez-Palmero & Balcells (2008) Domínguez-Palmero L., Balcells M., 2008, A&A, 489, 1003
- Domínguez-Palmero & Balcells (2009) Domínguez-Palmero L., Balcells M., 2009, ApJ, 694, L69
- Dutton (2009) Dutton A. A., 2009, MNRAS, 396, 121
- Efstathiou et al. (1982) Efstathiou G., Lake G., Negroponte J., 1982, MNRAS, 199, 1069
- Faber et al. (2007) Faber S. M., et al., 2007, ApJ, 665, 265
- Fakhouri & Ma (2009) Fakhouri O., Ma C., 2009, MNRAS, 394, 1825
- Genel et al. (2009) Genel S., Genzel R., Bouché N., Naab T., Sternberg A., 2009, ApJ, 701, 2002
- Graham & Worley (2008) Graham A. W., Worley C. C., 2008, MNRAS, 388, 1708
- Harker et al. (2006) Harker G., Cole S., Helly J., Frenk C., Jenkins A., 2006, MNRAS, 367, 1039
- Hatton et al. (2003) Hatton S., Devriendt J. E. G., Ninin S., Bouchet F. R., Guiderdoni B., Vibert D., 2003, MNRAS, 343, 75
- Hopkins et al. (2008) Hopkins P. F., Cox T. J., Keres D., Hernquist L., 2008, ApJ Supplement Series, 175, 390
- Hubble (1936) Hubble E. P., 1936, Realm of the Nebulae
- Jogee et al. (2009) Jogee S., Miller S. H., Penner K., Skelton R. E., Conselice C. J., Somerville R. S., Bell E. F., Zheng X. Z., Rix H., Robaina A. R., Barazza F. D., Barden M., Borch A., Beckwith S. V. W., Caldwell J. A. R., 2009, ApJ, 697, 1971
- Lacey & Cole (1993) Lacey C., Cole S., 1993, MNRAS, 262, 627
- López-Sanjuan et al. (2009) López-Sanjuan C., Balcells M., Garc a-Dab C. E., Prieto M., Crist bal-Hornillos D., Eliche-Moral M. C., Abreu D., Erwin P., Guzm n R., 2009, ApJ, 694, 643
- Lotz et al. (2004) Lotz J. M., Primack J., Madau P., 2004, Astronomical Journal, 128, 163
- Mandelbaum et al. (2009) Mandelbaum R., Li C., Kauffmann G., White S. D. M., 2009, MNRAS, 393, 377
- Mandelbaum et al. (2006) Mandelbaum R., Seljak U., Cool R. J., Blanton M., Hirata C. M., Brinkmann J., 2006, MNRAS, 372, 758
- Masjedi et al. (2008) Masjedi M., Hogg D. W., Blanton M. R., 2008, ApJ, 679, 260
- Oppenheimer & Davé (2006) Oppenheimer B. D., Davé R., 2006, MNRAS, 373, 1265
- Parkinson et al. (2008) Parkinson H., Cole S., Helly J., 2008, MNRAS, 383, 557
- Parry et al. (2009) Parry O. H., Eke V. R., Frenk C. S., 2009, MNRAS, 396, 1972
- Peletier & Balcells (1996) Peletier R. F., Balcells M., 1996, Astronomical Journal, 111, 2238
- Pérez-González et al. (2008) Pérez-González P. G., Trujillo I., Barro G., Gallego J., Zamorano J., Conselice C. J., 2008, ApJ, 687, 50
- Ratnatunga et al. (1999) Ratnatunga K. U., Griffiths R. E., Ostrander E. J., 1999, Astronomical Journal, 118, 86
- Schade et al. (1996) Schade D., Carlberg R. G., Yee H. K. C., Lopez-Cruz O., Ellingson E., 1996, ApJ, 464, L63
- Simard et al. (2002) Simard L., Willmer C. N. A., Vogt N. P., Sarajedini V. L., Phillips A. C., Weiner B. J., Koo D. C., Im M., Illingworth G. D., Faber S. M., 2002, ApJ Supplement Series, 142, 1
- Springel et al. (2005) Springel V., White S. D. M., Jenkins A., Frenk C. S., Yoshida N., Gao L., Navarro J., Thacker R., Croton D., Helly J., Peacock J. A., Cole S., Thomas P., Couchman H., Evrard A., Colberg J., Pearce F., 2005, Nature, 435, 629
- Steinmetz & Navarro (2002) Steinmetz M., Navarro J. F., 2002, New Astronomy, 7, 155
- Stewart et al. (2009) Stewart K. R., Bullock J. S., Barton E. J., Wechsler R. H., 2009, ApJ, 702, 1005
- Stewart et al. (2008) Stewart K. R., Bullock J. S., Wechsler R. H., Maller A. H., Zentner A. R., 2008, ApJ, 683, 597
- Strateva et al. (2001) Strateva I., Ivezic Z., Knapp G. R., Narayanan V. K., Strauss M. A., Gunn J. E., Lupton R. H., Schlegel D., Bahcall N. A., Brinkmann J., Brunner R. J., Castander F. J., Doi M., Fukugita M., Gyory Z., Hamabe M., Hennessy G., Ichikawa T., Kunszt P. Z., Lamb D. Q., McKay T. A., Okamura S., 2001, Astronomical Journal, 122, 1861
- Thomas et al. (2005) Thomas D., Maraston C., Bender R., de Oliveira C. M., 2005, ApJ, 621, 673
- Watanabe et al. (1985) Watanabe M., Kodaira K., Okamura S., 1985, ApJ, 292, 72
- Weinberg et al. (2004) Weinberg D. H., Dav R., Katz N., Hernquist L., 2004, ApJ, 601, 1
- Willmer et al. (2006) Willmer C. N. A., Faber S. M., Koo D. C., Weiner B. J., Newman J. A., Coil A. L., Connolly A. J., Conroy C., Cooper M. C., Davis M., Finkbeiner D. P., Gerke B. F., Guhathakurta P., Harker J., Kaiser N., Kassin S., Konidaris N. P., Lin L., Luppino G., Madgwick D. S., Noeske K. G., Phillips A. C., Yan R., 2006, ApJ, 647, 853
Appendix A Robustness of Model Morphologies
In this appendix we explore to effects which could influence the morphological properties of model galaxies, and demonstrate that, in fact, our results are robust to these effects.
A.1 Resolution Study
Since morphological evolution in our model is driven at least partly by merging activity, it is important to assess whether the resolution of the N-body merger trees that we utilize causes us to miss some lower mass merging activity and, therefore, to incorrectly estimate morphologies of some galaxies. While we currently do not have suitable N-body merger trees with higher resolution available to us for a resolution study, we can instead utilize merger trees constructed using a modified extended Press-Schechter approach (see Parkinson et al. 2008) which is designed to produce trees which are statstically equivalent to those found in N-body simulations. The advantage of this approach is that it allows us to increase the resolution to almost arbitrarily high levels. While the results will not precisely match those obtained using N-body trees they are sufficiently close to allow us to explore the effects of changing resolution. Figure 14 below shows the results of a resolution study carried out in this way on the morphologically segregated luminosity function.
The thickest lines correspond to the case of N-body merger trees drawn from the Millennium Simulation (i.e. used in this paper). The remaining lines were all generated using the exact same model parameters but with merger trees constructed using the Parkinson et al. (2008) algorithm. Of these lines, the thickest has a resolution matched to that of the Millennium Simulation. As can be seen (Fig. 14), it does not produce luminosity functions in precise agreement with those obtained using Millennium Simulation merger trees (since the analytic merger trees are not exactly statistically equivalent to the N-body ones), but they are very close. The thinner lines represent results obtained when the mass resolution in the analytic merger trees is increased (i.e. shifted to smaller masses) by factors of 4 and 16. It can clearly be seen that there is no significant change in the predicted luminosity functions. As such, we conclude that galaxy morphologies are well converged in our model when using trees with the Millennium mass resolution. (This is a consequence of the effects of supernovae feedback, which makes galaxy formation in lower mass halos highly inefficient and, therefore, to have little effect on more massive galaxies.)
A.2 Alternative Treatment of Disk Instabilties
The instability of galaxy disks is a difficult process to treat analytically. Our standard approach assumes that any unstable disk will quickly develop a strong bar and destroy itself entirely, turning the galaxy into a pure spheroid. Recent, high resolution hydrodynamical simulations (Agertz et al. 2009) show that unstable disks experience local instabilities leading to fragmentation and the incomplete destruction of the disk. To at least partially assess the importance of the assumptions we make regarding disk instabilities we have implemented an alternative disk instability treatment in our model in which only just enough mass is transferred from the disk to the spheroid component to restabilize the disk—an approach which has been adopted by other semi-analytic models (Hatton et al. 2003; Croton et al. 2006). Figure 15 shows the effect of switching to this alternative treatment on the morphologically segregated luminosity function. The thickest lines show results utilizing Millennium Simulation trees with our standard treatment of disk instabilities. Medium thickness lines show the same treatment of instabilities but with analytic merger trees with resolution matched to that of the Millennium Simulation. Finally, the thinnest lines show results of using the alternative treatment of instability events with analytic merger trees.
The net result of switching to the alternative treatment of instabilities is to slightly increase the number of bulgeless galaxies at all luminosities, with a corresponding decrease in the numbers of intermediate and pure spheroid galaxies. The changes do not alter the qualitative trends of morphological mix with luminosity. However, in order to reproduce quantitatively the observed morphological mix of galaxies at would require adjusting the range of B/T ratios used to segregate galaxies into the three broad morphological classes (Table 1). The sense of the required adjustment for the E (“pure spheroid”) class would be to smaller B/T ratios, which is inconsistent with their observed morphology and may be a sign that our standard treatment of disk instabilities is more realistic.