22email: gianfranco.gentile@ugent.be 33institutetext: Observatoire Astronomique, Université de Strasbourg, CNRS UMR 7550, F-67000 Strasbourg, France
33email: benoit.famaey@astro.unistra.fr 44institutetext: AIfA, Universität Bonn, D-53121 Bonn, Germany
44email: pavel@astro.uni-bonn.de 55institutetext: Dipartimento di Fisica Generale “Amedeo Avogadro”, Università degli studi di Torino, Via P. Giuria 1, I-10125, Torino, Italy
55email: angus@ph.unito.it 66institutetext: Istituto Nazionale di Fisica Nucleare (INFN), Sezione di Torino, Torino, Italy
Current data on the globular cluster Palomar 14 are not inconsistent with MOND
Abstract
Context. Certain types of globular clusters have the very important property that the predictions for their kinematics in the Newtonian and modified Newtonian dynamics (MOND) contexts are divergent.
Aims. Here, we caution the recent claim that the stellar kinematics data (using 17 stars) of the globular cluster Palomar 14 are inconsistent with MOND.
Methods. We compare the observations to the theoretical predictions using a Kolmogorov-Smirnov test, which is appropriate for small samples.
Results. We find that, with the currently available data, the MOND prediction for the velocity distribution can only be excluded with a very low confidence level, clearly insufficient to claim that MOND is falsified.
Key Words.:
globular clusters: individual: Palomar 14 – dark matter – Gravitation1 Introduction
A plethora of observational data on various astronomical scales seem to support the idea that the amount of visible matter in the Universe is several times smaller than the total amount of matter (e.g. Hinshaw et al. 2009). The current paradigm of structure formation and evolution in the Universe is known as the Cold Dark Matter (CDM) model. However, as long as the dark matter particle has not been discovered (and its cosmological abundance confirmed), it is worth considering alternative theories to explain the current data.
For instance, MOND (modified Newtonian dynamics) was proposed by Milgrom (1983) as an alternative to galactic dark matter. MOND stipulates that below a certain gravitational acceleration cm s-2 the actual gravitational acceleration is stronger than expected in Newtonian gravity (). Asymptotically, in MOND it reaches the value for . This allows it to naturally explain various galaxy scaling relations (e.g., Faber & Jackson 1976, Tully & Fisher 1977, McGaugh et al. 2000, McGaugh 2004, Gentile 2008, Donato et al. 2009, Gentile et al. 2009).
The effects of MOND and dark matter are however often rather degenerate and model-dependent since the gravitational potential predicted by MOND can almost always be attributed by a Newtonist to an ad hoc dark matter distribution. Objects for which the predictions of the two theories are unambiguously different are unfortunately rare. We note that galaxy clusters are not good discriminant tests: indeed, in galaxy clusters, the acceleration predicted by MOND is not large enough (e.g., Sanders 1999), but some form of hot dark matter can be added within the MOND context to make the data consistent with the predictions (e.g., Angus et al. 2009). If there were systems where MOND predicted more gravity than observed, they would make a strong case against MOND.
One example of such objects that should be (almost) devoid of cold dark matter in the CDM cosmological model, and for which MOND predicts significantly stronger gravity than that attributable to visible matter, are tidal dwarf galaxies (TDGs). However, from the observations of three young TDGs around NGC 5291, Gentile et al. (2007) found that MOND remarkably fits the data with zero free parameters, whereas CDM fails to explain them.
Apart from TDGs, another type of object that has recently been put forward as a discriminant test for CDM and MOND are the globular clusters of our own Galaxy (Baumgardt et al. 2005). Of particular interest are those that are diffuse and distant from the Milky Way, to ensure that the internal acceleration probes the deep MOND regime (which is not always necessarily the case: see NGC 2419 in Baumgardt et al. 2009) and that, simultaneously, the gravitational acceleration due to the Milky Way (external field) is weak enough. In MOND the deviation from a Newtonian behaviour should start appearing around , whereas in the “Newtonian gravity plus CDM” picture no discrepancy is expected since globular clusters should contain (almost) no cold dark matter.
In a recent paper, Jordi et al. (2009) analysed the data of 17 stars from the globular cluster Palomar 14, and claimed that (within the assumption of Palomar 14 being on a circular orbit) MOND is inconsistent with the observed velocity dispersion: the MOND prediction is too high, whereas the data are consistent with the Newtonian prediction (with no dark matter). They discuss two separate cases, depending on the inclusion or not of a star (Star 15), which based on its line-of-sight velocity is not a definite member of the cluster. However, given such a small sample size, an appropriate test should be used to discern between the hypotheses. An example of such a test is the Kolmogorov-Smirnov (KS) test (e.g. Soong 2004). An illustrative example of the uncertain value of the velocity dispersion measured with a small number of stars is NGC 2419: the original analysis by Olszewski et al. (1993) yielded a velocity dispersion for 12 stars of 2.70.8 km, which was re-evaluated by Baumgardt et al. (2009) with 40 stars to be 4.10.5 km, i.e. about two sigma greater than the original. This gives a perfectly reasonable M/L in MOND, although the velocity dispersion profile, if confirmed, could be a problem for MOND (Sollima & Nipoti 2009). This will allow a very interesting test of MOND when data points at larger radii will be obtained in NGC 2419. In any case, this is an excellent example of an underestimation of the true velocity dispersion due to an originally too small sample size.
Therefore, the question we ask in the present research note is the following: do the Palomar 14 data really exclude MOND, given the small number of stars used in the analysis of Jordi et al. (2009)? We then also investigate the minimum number of stars needed to exclude MOND in a globular cluster similar to Palomar 14. Or, equivalently, we ask how many globular clusters like Palomar 14 would be needed to exclude MOND.
| Name | velocity | obs cdf | Gauss cdf | obs cdf | Gauss cdf |
|---|---|---|---|---|---|
| (km s-1) | with Star 15 | with Star 15 | w/o Star 15 | w/o Star 15 | |
| 15 | 69.99 | 0.059 | 0.034 | - | - |
| 8 | 71.38 | 0.118 | 0.234 | 0.063 | 0.209 |
| 3 | 71.75 | 0.177 | 0.332 | 0.125 | 0.302 |
| 14 | 71.80 | 0.235 | 0.347 | 0.188 | 0.316 |
| 12 | 71.83 | 0.294 | 0.356 | 0.250 | 0.324 |
| HH042 | 71.94 | 0.353 | 0.388 | 0.313 | 0.356 |
| 16 | 72.14 | 0.412 | 0.450 | 0.375 | 0.416 |
| 5 | 72.21 | 0.471 | 0.472 | 0.438 | 0.437 |
| 13 | 72.33 | 0.529 | 0.509 | 0.500 | 0.475 |
| 17 | 72.39 | 0.588 | 0.528 | 0.563 | 0.494 |
| 2 | 72.47 | 0.647 | 0.553 | 0.625 | 0.519 |
| 1 | 72.53 | 0.706 | 0.572 | 0.688 | 0.538 |
| 7 | 72.64 | 0.765 | 0.606 | 0.750 | 0.572 |
| 6 | 72.65 | 0.824 | 0.609 | 0.813 | 0.575 |
| HV004 | 73.23 | 0.882 | 0.768 | 0.875 | 0.740 |
| 9 | 73.50 | 0.941 | 0.828 | 0.938 | 0.805 |
| HV055 | 73.62 | 1.000 | 0.851 | 1.000 | 0.830 |
2 Method
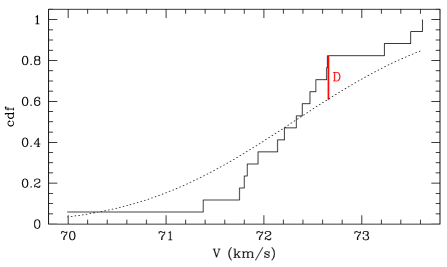
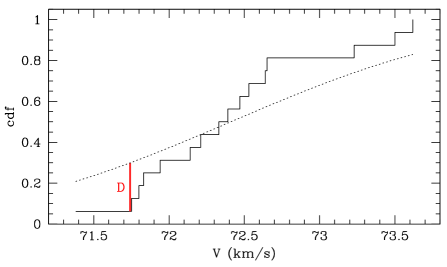
Given the small sample size, the formal error on the velocity dispersion is not sufficient to discriminate between various models, so we use the KS-test to redo the analysis of Jordi et al. (2009). The KS-test compares two cumulative distribution functions (cdfs), then the maximum difference D between these two cdfs yields a P-value.
Here we compare the cdf of the data (separately for the samples with and without Star 15) to the cdf of a Gaussian with dispersion equal to 1.27 km s-1 (the MOND prediction with M/L=2, Baumgardt et al. 2005, Jordi et al. 2009). We note that there is no evidence, independent from dynamics itself, about the centre of the Gaussian therefore we chose the centres that minimise D (in other words, the centres that maximise the P-value).
The MOND prediction for the velocity dispersion was derived by Baumgardt et al. (2005). First, they calculated the internal and external field gravitational accelerations ( and , respectively) of a number of globular clusters, including Pal 14. Then, based on results obtained by Milgrom (1986), they found that the MOND prediction is simply given by the Newtonian one multiplied by , because Pal 14 is in deep MOND regime and is larger than . Baumgardt et al. (2005) assume M/L=2 from the observed M/L ratios of globular clusters: Mandushev et al. (1991) find M/L=1.21 from 32 clusters, whereas Pryor & Meylan (1993) find M/L=2.3 from 56 clusters. Baumgardt et al. (2005) state that the latter value is more plausible because the modelling used in Pryor & Meylan (1993) takes mass segregation into account. To get an estimate of the uncertainty on the M/L, the data compilation by Dabringhausen et al. (2008) suggest that M/L ratios of globular clusters have a spread of roughly 0.5 dex.
3 Results
In Table 1 we list the observed and predicted cdfs (Gaussians with a standard deviation of 1.27 km s-1), separately for the sample with and without Star 15. The two predicted cdfs are different because they have different centres (72.30 km s-1 for the sample with Star 15 and 72.41 km s-1 for the sample without Star 15). We also show them in Figs. 1 and 2. In both cases, there are two regions where the difference goes close to the maximum: around 71.75 km s-1 and around 72.65 km s-1, respectively. And in both samples, the difference between the two observed and predicted cdf are very similar at these two velocities. With Star 15, the maximum difference is 0.215, and without Star 15 the maximum difference is 0.239. These values of correspond to P-values of 0.360 and 0.273, respectively. This means that using the KS-test, the data presented in Jordi et al. (2009) can exclude the MOND with M/L=2 hypothesis only with 64% and 73% confidence, depending on the inclusion of Star 15. These confidence levels are clearly not sufficient to exclude MOND. We note that if the M/L is not 2, but rather 1.1 (a possibility considered by Jordi et al. 2009), then MOND is perfectly consistent with a velocity dispersion of 0.85 km s-1.
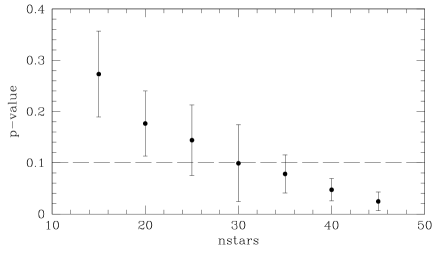
Now we can ask ourselves: if one wanted a P-value of 0.1 (i.e. an exclusion confidence of 90 %), how many stars would one need (with the hypothesis that they follow a Gaussian with standard deviation equal to the measured one)? We measure a dispersion of 0.85 km s-1 with Star 15 and 0.63 km s-1 without Star 15. Hence, we create a series of Monte-Carlo realizations, using the software package R (Ihaka & Gentleman 1996), of increasing sample size. We create 10 realizations per sample size. Then, we compare these mock data sets to the MOND prediction using the same method as above, take the mean P-value for each sample size, and look for the minimum number of stars such that P 0.1 is obtained. Our results (shown in Figs. 3 and 4) are that for the mock data sets equivalent to the sample with Star 15 (i.e., the mock data sets that follow a Gaussian with standard deviation = 0.85 km s-1) a minimum of about 80 stars (or alternatively 80/17 5 clusters) would have been needed to exclude the MOND hypothesis with a confidence level of 90%, whereas without star 15 this minimum number of stars decreases to about 30.
4 Discussion
In this research note, we showed that current observational data on Pal 14 are not significantly discrepant with the theoretical prediction of MOND. Let us however also note that this theoretical prediction is not really unique, and depends on many factors, such as stellar M/L, rotation and anisotropy. For instance, in Angus (2008, thesis), the velocity dispersion of Pal 14 was discussed before any velocity dispersion was published: the line of sight velocity dispersion for various M/Ls and velocity anisotropies were computed (radial, isotropic and centrally isotropic with increasing tangentially biased orbits). It was found that lower velocity dispersions (consistent with 0.85 km) were attainable with very radial orbits, and in that case the line of sight velocity dispersion profile would moreover not be flat in the outskirts. Rotation could also play a role although the round appearance of Pal 14 justifies the no-rotation assumption. Of course, the most important uncertainty comes from the M/L ratio itself.
Then, another possible oversight may be the mass segregation of stars within the globular cluster: if significant energy partitioning has occured due to the short MOND relaxation time (Ciotti & Binney 2004), this would mean that the low-mass, unobserved, stars could have a larger spread in configuration space and a higher velocity dispersion. Also, as already noted in Jordi et al. (2009), the MOND theoretical prediction was based on assuming a purely circular orbit for Pal 14 around the Milky Way, while if it is on an eccentric orbit, it could (i) have lost many low mass stars at perigalacticon leading to a decrease of the theoretical stellar M/L, and (ii) be “frozen” in the Newtonian regime due to the period of recovery while transiting from the large external field endured at perigalacticon. Finally, we note that the fact that MOND cannot be excluded also implies, in the Newtonian plus dark matter cosmological framework, that the current data of Pal 14 cannot exclude a certain amount of unseen mass in the cluster. With the assumption of a stellar M/L of 2, a velocity dispersion of 1.27 km s-1 would imply a total-to-luminous mass ratio of 2 to 4.
5 Conclusion
Even assuming an isotropic MOND model with no rotation for a globular cluster on a circular orbit with M/L=2, we showed that, based on a KS test, which is the relevant statistical test for small samples, the currently available data are insufficient to discriminate between Newtonian gravity and MOND in Palomar 14, contrary to the claim of Jordi et al. (2009). While the objects proposed by Baumgardt et al. (2005) provide one of the best discriminating test between MOND and cold dark matter plus Newtonian dynamics, more observations would be needed to exclude the aforementioned MOND model if the observed velocity dispersion is representative of the true one: about 80 stars in Pal 14, or about 5 similarly problematic globular clusters for this model. In this respect, even though it might still not be conclusive, velocity data of 21 stars in Pal 3 and 24 stars in Pal 4 will be of prime interest for testing fundamental physics in our Galactic backyard.

Acknowledgements.
GG is a postdoctoral researcher of the FWO-Vlaanderen (Belgium). BF acknowledges support from the Hulmboldt foundation and the CNRS. GWA is supported by the Univsersity of Torino and Regione Piemonte, and by the INFN grant PD51.References
- (1) Angus, G., Famaey, B. & Diaferio, A. 2009, arXiv:0906.3322
- Baumgardt et al. (2005) Baumgardt, H., Grebel, E. K., & Kroupa, P. 2005, MNRAS, 359, L1
- Baumgardt et al. (2009) Baumgardt, H., et al. 2009, MNRAS, 396, 2051
- (4) Ciotti, L., & Binney, J. 2004, MNRAS, 351, 285
- Dabringhausen et al. (2008) Dabringhausen, J., Hilker, M., & Kroupa, P. 2008, MNRAS, 386, 864
- (6) Donato, F., et al. 2009, MNRAS, 397, 1169
- (7) Faber, S., & Jackson, R. 1976, ApJ, 204, 668
- Gentile et al. (2007) Gentile, G., et al. 2007, A&A, 472, L25
- (9) Gentile, G. 2008, ApJ, 684, 1018
- (10) Gentile, G., Famaey, B., Zhao, H. S., & Salucci, P. 2009, Nature, 461, 627
- Harris & van den Bergh (1984) Harris, W. E., & van den Bergh, S. 1984, AJ, 89, 1816
- Hilker (2006) Hilker, M. 2006, A&A, 448, 171
- Hinshaw et al. (2009) Hinshaw, G., et al. 2009, ApJS, 180, 225
- Holland & Harris (1992) Holland, S., & Harris, W. E. 1992, AJ, 103, 131
- (15) Ihaka, R., & Gentleman, R., 1996, Journal of Computational and Graphical Statistics, 5(3),299, URL: http://www.r-project.org/.
- Jordi et al. (2009) Jordi, K., et al. 2009, AJ, 137, 4586
- Mandushev et al. (1991) Mandushev, G., Staneva, A., & Spasova, N. 1991, A&A, 252, 94
- (18) McGaugh, S. S., et al. 2000, ApJ, L99
- (19) McGaugh, S.S. 2004, ApJ, 609, 652
- Milgrom (1983) Milgrom, M. 1983, ApJ, 270, 365
- Milgrom (1986) Milgrom, M. 1986, ApJ, 302, 61
- (22) Olszewski, E. W., Pryor, C., & Shommer, R. B., ASP Conf. Series, 48, 99
- Pryor & Meylan (1993) Pryor, C., & Meylan, G. 1993, Structure and Dynamics of Globular Clusters, 50, 357
- Sanders (1999) Sanders, R. H. 1999, ApJ, 512, L23
- (25) Sollima, A., & Nipoti, C. 2009, arXiv:0909.1656
- Soong (1994) Soong, T. T., 2004, Fundamentals of Probability and Statistics for Engineers. Publisher: John Wiley & Sons
- (27) Tully, R. B. & Fisher, J. R. 1977, A&A, 54, 661