The Structure of the Accretion Disk in the Accretion Disk Corona X-Ray Binary 4U 1822–371 at Optical and Ultraviolet Wavelengths
Abstract
The eclipsing low-mass X-ray binary 4U 1822–371 is the prototypical accretion disk corona (ADC) system. We have obtained new time-resolved UV spectroscopy of 4U 1822–371 with the Advanced Camera for Surveys/Solar Blind Channel on the Hubble Space Telescope and new - and -band photometry with the 1.3-m SMARTS telescope at Cerro Tololo Inter-American Observatory. We use the new data to construct its UV/optical spectral energy distribution and its orbital light curve in the UV, , and bands. We derive an improved ephemeris for the optical eclipses and confirm that the orbital period is changing rapidly, indicating extremely high rates of mass flow in the system; and we show that the accretion disk in the system has a strong wind with projected velocities up to 4000 km s-1. We show that the disk has a vertically-extended, optically-thick component at optical wavelengths. This component extends almost to the edge of the disk and has a height equal to 0.5 of the disk radius. As it has a low brightness temperature, we identify it as the optically-thick base of a disk wind, not as the optical counterpart of the ADC. Like previous models of 4U 1822–371, ours needs a tall obscuring wall near the edge of the accretion disk, but we interpret the wall as a layer of cooler material at the base of the disk wind, not as a tall, luminous disk rim.
1 Introduction
4U 1822–371 is a low-mass X-ray binary star (LXMB) with an orbital period of hr (Mason et al., 1980). The compact star in the system is an X-ray pulsar with spin period s (Jonker & van der Klis, 2001) and is, therefore, a neutron star. The UV/optical spectrum of 4U 1822–371 is rich with emission and absorption lines (Charles et al., 1980; Mason & Cordova, 1982a; Mason et al., 1982; Harlaftis et al., 1997; Cowley et al., 1982, 2003; Jonker et al., 2003; Hutchings et al., 2005). Doppler tomography of the He II and O VI emission lines confirms expectations that there is an accretion disk around the neutron star fed by a stream of gas from the secondary star (Casares et al., 2003).
4U 1822–371 is one of the rare eclipsing LXMBs (Mason et al., 1980; White et al., 1981). Many analyses of the eclipse have been published (White et al., 1981; White & Holt, 1982; Mason & Cordova, 1982a, b; Hellier & Mason, 1989; Baptista et al., 2002; Cowley et al., 2003) and, although the detailed results of the various analyses often differ greatly, there is substantial agreement on several points. The eclipse is a transit of the secondary star across the accretion disk and, since the eclipse is very broad at optical wavelengths, the accretion disk is large, although exactly how large is uncertain: Mason & Cordova (1982b) find to 0.38 and Hellier & Mason (1989) find , where is the radius of the disk and is the separation of the stars. The X-ray eclipse is also broad. Its flux at minimum is at about 50% of the uneclipsed flux level and it has no sharp features, showing that the X-ray emission comes from a partially-eclipsed extended cloud around the neutron star - an accretion disk corona (ADC) (White et al., 1981; Mason & Cordova, 1982a). The corona extends to in the plane of the disk and is vertically extended. Estimates of the ratio of its height to its radius in the plane of the disk range from 0.3 to 1 (White & Holt, 1982; Mason & Cordova, 1982a; Hellier & Mason, 1989). The orbital inclination lies in the range .
The ratio of the X-ray luminosity of 4U1822–371 to its optical luminosity, , lies between and , much less than that for typical LXMBs, indicating that the ADC is optically thick and blocks most of the X-ray emission from the inner disk and neutron star (Griffiths et al., 1978; Mason et al., 1980). Fits to the X-ray spectrum using realistic Comptonization models yield electron temperatures near K and electron scattering optical depths in the range –26 depending on the geometry of the ADC and the Comptonization model (Parmar et al., 2000; Iaria et al., 2001). The mean unabsorbed apparent luminosity of 4U 1822–371 in the 0.1–100 keV energy range is for a distance of 2.5 kpc (Iaria et al., 2001). As most of the X-ray flux escapes roughly perpendicularly to the orbital plane and is beamed away from the Earth, the true luminosity is much greater than the apparent luminosity. If one corrects for the ADC obscuration by simply multiplying by a factor to raise to the typical value for LXMBs (), the true X-ray luminosity is . Even this should be taken as a lower limit because the disk is observed edge-on, reducing . A true luminosity near the Eddington luminosity is not impossible.
All solutions for the X-ray eclipse have invoked a vertically-extended wall of optically-thick material whose height varies with angle around the neutron star (White et al., 1981). The wall generally has been identified as a vertically extended disk rim, and, indeed, Hellier & Mason (1989) showed the wall must be near the edge of the disk. The rim invoked by Hellier & Mason (1989) has , while the maximum height of the rim invoked by White & Holt (1982) approached . Iaria et al. (2001) also needed a thick belt of absorbing material around the ADC to match the observed X-ray spectral energy distribution (SED). Placing the belt at the edge of the disk, they found the angle subtended by the absorbing region is , or . These rims are an order of magnitude taller than the expected thickness of the disk proper and cannot be pressure supported. White & Holt (1982) invoked turbulence to support the rim but the turbulence would have to be highly supersonic, needing Mach numbers between 7 and 15. While it is not inconceivable that supersonic turbulence could be generated by the impact of the accretion stream on the disk, it is unclear how supersonic turbulence could be maintained around the entire circumference of the disk.
It has been universally assumed that the only contributors to the UV/optical continuum are 1) the accretion disk, 2) its extended rim, which may be irradiated and have a higher temperature on its surface towards the neutron star, and 3) the irradiated secondary star (Mason & Cordova, 1982b; Hellier & Mason, 1989; Puchnarewicz et al., 1995). It also has been assumed that the ADC is optically thin at UV/optical wavelengths, even though it is optically thick to electron scattering at X-ray wavelengths. These contradictory preclude a UV/optical contribution from the ADC or from vertical structures other than the rim.
The ADC and the eclipses lend particular importance to 4U 1822–371. ADC sources are more numerous than suggested by the small number that have been identified. The luminosity of an ADC is typically times less than the luminosity of the inner disk and neutron star, so ADCs are visible only in those systems with orbital inclinations near enough to that the outer accretion disk or the ADC itself blocks most of the flux from the more luminous components of the binary (White & Holt, 1982). Many ADC sources must be lurking among the low-inclination LXMBs, perhaps 5 – 10 times more than are currently known. 4U 1822–371 is the prototype for these systems. Models for accretion onto neutron stars and black holes in X-ray binaries or onto supermassive black holes in AGN need much more than flat, unadorned accretion disks. They must also include high-temperature flows, vertical extension, winds, and irradiation, all of which can vary with time (Narayan et al., 1998; Blandford & Begelman, 1999; Wijers & Pringle, 1999; Narayan et al., 2000; Lasota, 2001). ADCs are examples of high-temperature accretion flows and vertically-extended structures. The eclipses of 4U 1822–371 offer the opportunity to map these structures in detail.
We have obtained new HST objective-prism ultraviolet spectroscopy and and photometry of 4U 1822–371, from which we construct its SED and its orbital light curves in the UV, , and bands (Section 2). In Section 3 we derive an improved ephemeris for the optical eclipses and confirm that the orbital period is changing rapidly, indicating extremely high rates of mass flow in the system. In Section 4 we show that the accretion disk has a strong wind with projected velocities up to 4000 km s-1. The core of this paper is Section 5, in which we model the orbital light curves with our light curve synthesis program. We show that much of the disk is vertically extended and optically thick at UV/optical wavelengths. This vertical structure extends almost to the edge of the disk and has a height equal to 0.5 of the disk radius. As this structure has a brightness temperature near K, we identify it as the optically-thick base of the disk wind, not as the optical counterpart of the ADC. We, too, need a tall obscuring wall near the edge of the accretion disk, but we interpret the wall as layer of cooler material at the base of the disk wind, not as a tall disk rim. Our results are summarized in Section 6.
2 Observations and Data Reduction
We observed 4U 1822–371 with the ANDICAM optical/IR photometer on the SMARTS 1.3-m telescope at CTIO using Johnson and CTIO/CIT filters (DePoy et al., 2003). We obtained one or two observations per night over two observing seasons, the first season from 2005 June 30 to September 15, the second from 2006 March 29 to October 20. The data were reduced to instrumental magnitudes with IRAF111IRAF is distributed by the National Optical Astronomy Observatory, which is operated by the Association of Universities for Research in Astronomy, Inc., under the cooperative agreement with the National Science Foundation, and the instrumental magnitudes were converted to absolute fluxes using the photometric standard stars PG1657+078 for the band and 2MASS J18254777-3706131 for the band (Landolt, 1992), both of which were observed on three photometric nights in 2007 June.
We also obtained a time series of objective-prism ultraviolet spectrograms of 4U 1822–371 with the Hubble Space Telescope (HST) using the Advanced Camera for Surveys/Solar Blind Channel (ACS/SBC) and the PR130L prism (Pavlovsky et al., 2006). We obtained 300 spectrograms in two visits between HJD 2453828.7 and HJD 2453830.9 (2006 April), each visit lasting five HST orbits. The spectrograms were integrated for 45 seconds and separated by a 40-second dead time, with occasional long exposures of 350 seconds when data were transfered from the ACS internal buffer memory to the HST solid state data recorder. The spectrograms cover the wavelength range from 1222 Å to 2002 Å, but we used only the wavelengths from 1222 to 1900 Å because there is a significant red leak in the SBC at wavelengths greater than 1900 Å. The spectral resolution is near 1300 Å, but decreases to near the C IV doublet and to near 1900 Å. The UV data were reduced with the aXe package in STSDAS (Kuemmel et al., 2004).
The time-averaged mean UV spectrum of 4U 1822–371 is shown in Figure 1. The prominent emission lines are N V at 1240 Å, a blend of O IV, O V, and Si IV near 1370 Å, the C IV doublet at 1548/1550 Å, and He II at 1640 Å. There are also interstellar absorption lines from blends of Si II/C I near 1260 Å and O I/Si III near 1300 Å.
3 The UV/Optical Ephemeris and Orbital Light Curves
Because the and light curves are sparsely sampled, it was not possible to extract times of minima for individual eclipses. Instead we measured a single mean time of minimum for each season by folding the -band data on the orbital period from Parmar et al. (2000) to form seasonal mean orbital light curves. The times of minimum light extracted from the mean light curves are HJD for the 2005 data and HJD for the 2006 data. To form UV light curves the flux in each UV spectrogram was integrated from 1222 Å to 1900 Å and then divided by Å. We folded the light curves on the Parmar et al. (2000) period and extracted two times of minimum light, one for each HST visit: and .
The four new eclipse times plus all of the previously published optical eclipse times are listed in Table 1. A fit to the eclipse times yielded the ephemeris
| (1) |
where is the eclipse number. The diagram for this ephemeris is shown in Figure 2. The quadratic term in the optical ephemeris is consistent with the low-significance quadratic term derived by Baptista et al. (2002) and agrees with the quadratic term in the X-ray ephemeris, , to within the measurement errors (Parmar et al., 2000). The of our new optical ephemeris lags the from the X-ray ephemeris of Parmar et al. (2000) by seconds. Although the lag is only marginally statistically significant, it cannot be dismissed because the X-ray and optical/UV flux emanate from different regions and could be eclipsed at slightly different times. Recently, Burderi et al. (private communication) derived a new X-ray ephemeris for 4U 1822-371. Using this new ephemeris the lag is 122 seconds.
The rate of change of the orbital period is and the timescale for a change in orbital period is . One must generally be cautious about interpreting timescales for orbital period changes as evolutionary timescales because mass-transfer binaries often show short-term systematic advances and delays in times of eclipse that can mimic rapid period changes. The X-ray binary EXO 0748-676 shows this behavior (Wolff et al., 2009) and there are many examples among cataclysmic variables (see Warner, 1995). However, the eclipse times for 4U 1822–371 span 27 years and the accumulated phase shift is , an order of magnitude larger than the random phase shifts observed in EXO 0748-676 and cataclysmic variables. It appears safe, therefore, to identify the value of measured from the ephemeris as the time scale for orbital evolution.
On dimensional grounds one has . If mass and angular momentum are conserved, for example, then (Warner, 1995), where is the mass of the neutron star, , and is the mass of the secondary star. For and , we find yr-1. This is an extremely high rate of accretion, corresponding to times the Eddington luminosity. In this we agree with the analysis of Heinz & Nowak (2001). We do not agree that the flow of mass and angular momentum can be characterized by a single parameter. Specifically, the angular momentum per unit mass can vary enormously in various parts of the flow and depends on the detailed properties of the flow. Absent a precise description for the flow of mass and angular momentum, it is not possible to infer accurate rates of mass transfer and mass loss from the evolutionary timescale, nor even a ratio of the two rates. Few cataclysmic variables have rates of mass transfer greater than (Warner, 1995), so we suspect that the rate of mass transfer in 4U 1822–371 is at least a factor of two smaller than the value for conservative mass transfer. Yet, a mass transfer rate of is still extremely high and much of the transferred mass cannot be accreting onto the neutron star, but leaves the system altogether.
Figure 3 shows the UV light curves of 4U 1822–371 from the two HST visits folded on the orbital period given by equation 1; and Figures 4 and 5 show the two seasons of - and -band photometry also folded on the orbital period. The folded UV light curves and the -band light curve from 2006 have been averaged into 200 equal-width phase bins. The -band light curves from both 2005 and 2006 and the -band light curve from 2005 have fewer observations, and have not been binned. We define the internal error of a data point to be the standard deviation that includes photon counting noise and calibration errors. The internal errors of the UV fluxes are small, typically only 0.5%; the internal errors of - and -band data were typically 4 – 5% but occasionally somewhat larger. The error bars in the figures correspond to these internal errors.
The light curve of 4U 1822–371 shows large-amplitude non-repeating variability (“flickering”) and, because of this variability, individual orbital light curves can differ substantially from the mean orbital light curve (Baptista et al., 2002). Let us define the external error of a data point as the standard deviation introduced by the non-repeating variability. We estimated the external error of the UV fluxes by comparing the light curves of 4U 1822–371 from the two HST visits. After folding all the UV data together to form a single (noisy) light curve, we divided the light curve into four phase sections (0.11 – 0.23, 0.33 – 0.52, 0.62 – 0.9, and 0.9 – 1.11) and fit a polynomial to each section. The standard deviation of the data points about the fitted polynomial ranged from 5% to 9%. We equate the external error of the data points in each section to the standard deviation for the section. Much the same method was used to determine the external error in the - and -band data except that the light curves were divided into just two sections covering phases 0.25 – 0.70 and phases 0.70 – 1.25. The error bars in Figure 11 correspond to these external errors. When calculating the of models fitted to the light curves (Section 5), we will use the larger of the internal and external errors for each data point. With the exception of a few data points in the - and -bands, the external errors are much larger than the internal errors and it is these large external errors that dominate the fit.
The shape of the - and -band light curves changed systematically between 2005 and 2006. While the 2006 light curves are roughly symmetrical about phase 0.0, the 2005 light curves are asymmetric, having a large hump near phase 0.2. The asymmetric light curves from 2005 are similar to the optical light curves shown in Mason et al. (1980), Harlaftis et al. (1997), and Baptista et al. (2002). The more symmetric light curves from 2006 are similar to our UV light curves – also obtained in 2006 – and to the optical light curves shown in Cowley et al. (2003).
Figure 6 shows the X-ray light curve of 4U 1822–371 between 1996 January 5 and 2008 March 5 from the All Sky Monitor (ASM) on the Rossi X-ray Timing Explorer (RXTE)222Results provided by the ASM/RXTE teams at MIT and at the RXTE SOF and GOF at NASA’s GSFC. http://xte.mit.edu. Each point in the figure is the monthly average count rate summed over the three ASM passbands. The dates on which optical eclipses were observed are marked on the figure. The X-ray light curve shows a low-amplitude variability superimposed on a slow decrease in flux. The pronounced changes in the optical/UV light curves from year to year were not accompanied by large changes in the X-ray light curve.
4 The UV Spectrum, UV/Optical Spectral Energy Distributions, and Evidence for a Strong High-Velocity Wind
Although the direction to 4U 1822–371 is within of the direction to the galactic center, 4U 1822–371 is close to Baade’s window and its reddening is low. Mason & Cordova (1982a) find a color excess with upper and lower bounds of 0.29 and 0.01 based on the depth of the 2200 Å interstellar absorption feature. According to Iaria et al. (2001) the photoelectric absorption at soft X-ray energies corresponds to a neutral hydrogen column density of cm-2. Adopting mag cm2 (Güver & Özel, 2009) and , we find mag and mag in agreement with Mason & Cordova (1982a).
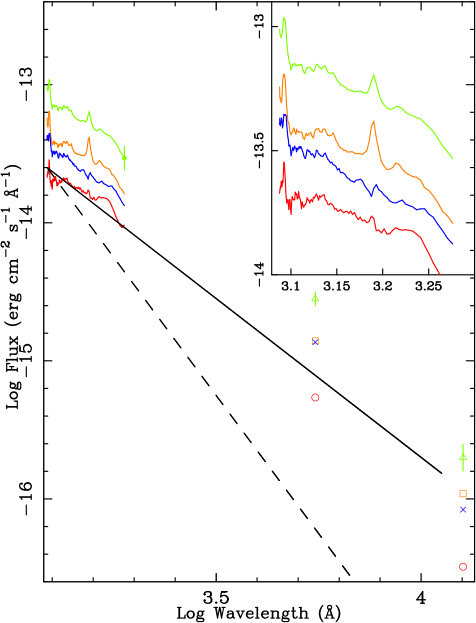
Figure 7 shows de-reddened UV and - and -band fluxes calculated for and the extinction law of Cardelli et al. (1989) for . The top (green) line and triangles in the figure show the mean fluxes over orbital phases 0.75 – 0.85 and 0.15 – 0.25, during which the system is uneclipsed and contribution from the irradiated face of secondary star is minimized. The next (orange) line and squares show the fluxes during eclipse. The third (blue) line and crosses are the green minus orange fluxes, giving the flux from that part of the system that is eclipsed. All three of the SEDs roughly follow an distribution from the UV to the -band, and then fall significantly below in the -band. The photometry of Mason & Cordova (1982b) shows that the SED steepens further to a blackbody slope in the and bands. While it is tempting to identify the SEDs with the theoretical SED for an optically-thick, steady-state -model accretion disk, this identification is probably not correct. It is difficult to make an -model disk produce the same SED at mid-eclipse, when all but the outer parts of the disk are obscured, as it produces when it is not eclipsed and the entire disk is visible. Moreover, as we will show in the next section, most of the disk is hidden by optically-thick vertically-extended structures and is invisible at UV/optical wavelengths, so the theoretical SED of a simple -model disk is not relevant.
The bottom (red) line and open circles in Figure 7 show the mean fluxes at phases 0.25 – 0.75 minus the uneclipsed (green) fluxes. This red SED isolates the flux in the large hump in the light curve at orbital phases opposite the eclipse. The flux contributed by the irradiated face of the secondary star is maximized at these phases. The flux from the irradiated secondary should be roughly a multi-temperature blackbody distribution. The red SED appears to be flattening near , suggesting that the flux-weighted temperature of the heated face is K.
With the exception of the N V line, the flux in the UV emission lines is neither reduced during eclipse nor enhanced at other orbital phases. This shows clearly in the spectrum of the eclipsed parts of the system (the blue spectrum), which is nearly devoid of emission lines. The emission lines must, then, arise from optically-thin material far above and below the disk. After accounting for the extra width introduced by the poor spectral resolution of the UV spectrogram, we find the full width at zero intensity of the C IV emission line to be Å. We compare this to its width in the HST Faint Object Spectrograph spectrograms from which the data presented by Puchnarewicz et al. (1995) were derived. In these spectrograms the width is near 40 Å. These widths correspond to projected velocities up to km s-1. Thus the lines come from a high-velocity wind. Neither the strength nor the width of the C IV line depend on orbital phase.
Since the material in the wind must be continuously replenished by outflowing gas closer to the disk, there must be a base to the wind. We do not observe C IV emission from the base of the wind, so either the base does not produce C IV emission or it is hidden by vertically-extended optically-thick material further out in the disk. The N V line is an exception. Its strength decreases by % during eclipse and arises nearer the orbital plane.
5 Light Curve Analysis and a Model for 4U 1822–371
5.1 Preliminaries
5.1.1 The Light Curve Synthesis Program
We modeled the UV/optical light curves of 4U 1822–371 using a light curve synthesis program333A full description of the program is available at http://pisces.as.utexas.edu/robinson/XRbinary.pdf. we wrote to model X-ray binaries (e.g. UW Cor Bor, Mason et al. 2008) and related objects (e.g. SS Cygni, Bitner et al. 2007). The program assumes that the orbits of the stars are circular, the secondary star fills its Roche Lobe, and the primary star is a point source surrounded by an accretion disk. The accretion disk can have a complicated geometry. It can be non-circular, non-axisymmetric, and vertically extended; and it can have a rim, an interior torus, and bright or dark spots. The flux from the secondary star has a realistic spectrum using Kurucz stellar atmospheres (Kurucz, 1996) but the remaining parts of the system emit like a blackbody. The program includes heating by irradiation. Because the geometry and temperature distributions in the model can be complex and asymmetric, the program resorts to ray tracing to calculate both irradiation and the orbital light curve. The program outputs synthetic light curves for Johnson/Cousins filter bandpasses and for square bandpasses over user-specified wavelength ranges. If provided with an observed light curve, our code calculates the for the fit of the synthetic light curve to the observed light curve. A calling program allows the user to find the model parameters that minimize either by a grid search through parameter space or by a simplex algorithm.
5.1.2 The Masses and Dimensions of 4U1822–371
The arrival times of the X-ray pulses from the neutron star yield accurate values for the projected semi-major axis of the neutron star orbit and the mass function , where is the radius of the neutron star’s orbit and is the orbital inclination (Jonker & van der Klis, 2001). The orbital eccentricity is not measurably different from zero.
It appears to us that the masses of the two stars in 4U 1822–371 have not yet been determined with certainty. The mass function can be recast to the form . The eclipse solution limits the orbital inclination to a narrow range near , so . There have been several attempts to determine the mass ratio from the radial velocity curve of the secondary star. The spectrum of the heated face of the secondary star has He I absorption lines and a narrow emission line from N III , which is excited by the Bowen fluorescence mechanism (Harlaftis et al., 1997; Casares et al., 2003). The radial velocity curve of the He I absorption has been measured and its amplitude is (Harlaftis et al., 1997; Cowley et al., 2003; Casares et al., 2003). It is, however, unclear how to interpret because the absorption lines arise on only one face of the secondary and because the line profiles are probably distorted by helium emission lines from the accretion disk. The radial velocity curve also suffers from a phase shift of with respect to the pulsar ephemeris, further complicating its interpretation (Jonker et al., 2003; Casares et al., 2003).
The radial velocity curve of the N III emission line also has been measured and has an amplitude (Casares et al., 2003; Muñoz-Darias et al., 2008). We agree with Casares et al. (2003) that this is a firm lower limit to the amplitude of the secondary’s radial velocity curve, which translates to lower limits on the masses: and . Correcting from to the true amplitude of secondary star’s radial curve requires a model for the distribution of the N III emission across the face of the secondary star. Muñoz-Darias et al. (2005, 2008) have developed such a model and used it to deduce . In their model the N III line is emitted uniformly over the face of the irradiated secondary except where shadowed by a simple thin disk with a raised, optically-thick rim. We will show that a more complex model is required for the disk in 4U 1822–371. The K-correction derived from the thin disk model is likely be only qualitatively correct.
As the masses of most neutron stars in binary X-ray pulsars fall in a narrow range near (Thorsett & Chakrabarty, 1999; Nice et al., 2008), we adopted this value for most of our models. The mass function then becomes a relation between and , materially reducing the parameter space that needs to be explored when fitting models. This choice of neutron star mass also restricts other properties of 4U1822–371 to lie in a narrow range: If lies in the range , then , , and the separation of the centers of mass of the two stars is . Since the secondary star must fill its Roche lobe, its radius is close to , placing it close to the observed main-sequence mass-radius relation (Drilling & Landolt, 2000). The temperature of a main-sequence star with this mass and radius is K. This is a low enough temperature that we ignore flux from the secondary star except from those parts of its surface that are heated by irradiation.
Because Muñoz-Darias et al. (2008) argue for a high-mass neutron star in 4U 1822–371, we have also explored the effect of neutron star mass on our results, adopting the extreme value for a few models. For and the mass function yields , and . The radius of the secondary star is , again placing it close to the main-sequence mass-radius relation. A main-sequence star with a mass of has a temperature near K. Fits of these higher-mass models to the light curves yielded small quantitative differences in the fitted parameters but the overall results were qualitatively almost identical. The derived orbital inclinations, for example, were typically higher by and the heights of the disk rim increased by 10-15%. This also means, though, that the mass of the neutron star is not constrained by the optical/UV light curves. We report results only for the models.
5.1.3 The Accretion Disk
As discussed in the introduction, the unobscured X-ray luminosity of 4U 1822–371 is high, possibly near Eddington; and the high mass flow rates deduced from the rapidly changing orbital period also suggest a luminosity near Eddington. Since the X-ray luminosity of 4U 1822–371 is relatively constant in the sense that no large-amplitude outbursts have been observed, the accretion disk in 4U 1822–371 is at least roughly in a steady state. These considerations suggest strongly that the accretion disk is optically thick and its inner edge is near the neutron star.
While we will not necessarily limit our disk models to -model disks, an optically-thick -model disk is the default model for the outer parts of the disk in 4U 1822–371. The maximum radius of the disk is thought to be set by viscous dissipation induced by tidal interactions with the secondary star. For a mass ratio the tidal truncation radius is cm (Frank et al., 2002). Let us calculate a typical temperature and thickness of the disk at a radius that is large, but less than the radius of its outer edge. For , , a mass flow rate of , and a radius of cm an optically-thick steady-state -model disk has and K (Frank et al., 2002). These values depend only weakly on , , and . Except where it is hit by the stream of transferred material from the secondary star, the outer, vertical rim of the disk should not be even as hot as this low temperature. We will see that the visible parts of the 4U 1822–371 system have a brightness temperature near K at UV/optical wavelengths. The temperature of the rim is so much lower that it is a minor contributor to the flux. If the rim is vertically extended, its inner surface may be heated to higher temperatures but this will only emphasize the low surface brightness of the outer surface of the rim.
As a result, our models emit negligible flux from the disk rim. In the previously published models for the UV/optical light curve of 4U 1822–371, the disk rim is a significant contributor, often the dominant contributor to the UV/optical flux. This is shown most clearly in Figure 9 of Hellier & Mason (1989). Many of the differences between our results and earlier results flow from the different handling of the disk rim flux.
5.2 The Disk Is Large, Its Center Obscured
We first establish that the accretion disk is large and its center obscured at UV/optical wavelengths. The left panel in Figure 8 shows the eclipse portion of the binned UV light curve normalized to 1.0 just outside eclipse. The eclipse is wide, lasting in phase. The panel also shows two synthetic light curves, both calculated for a disk that is geometrically flat, has a nearly flat temperature distribution (), and is eclipsed at an orbital inclination . One light curve was calculated for , the other for , and both have been normalized to match the flux at mid-eclipse to emphasize the effect of disk width on the light curve. Disks with are needed to fit the observed eclipse.
The dashed line in the right panel of Figure 8 is the synthetic light curve for a geometrically-thin, optically-thick, steady-state -model disk with a temperature distribution. The radius of the disk is , its temperature is 20,000 K at the outer edge, and the orbital inclination is . The bright central regions of this model disk produce an eclipse light curve with a deep, narrow center in striking disagreement with the observed eclipse. The solid line in the panel is the synthetic light curve for a disk model with similar geometry but with a flatter temperature distribution to reduce the brightness of its central regions ( and ). This model matches the general shape of the observed eclipse and, indeed, the fit is formally excellent. We do not conclude that the disk actually has a flat temperature distribution as we consider a flat distribution physically unrealistic. We do conclude that the flat temperature distribution is mimicking the true appearance of the disk, a disk that appears not to have bright central regions. As argued in the previous section, the central regions of the disk must be hot and bright, so the central regions of the disk must be obscured by disk structures extending above and below the orbital plane.
We now consider two broad groups of models for obscuring the central disk. The first group includes models similar to standard thin-disk models. In these models the edge of the disk is tall enough to hide the center of the disk either because the disk has a large flare or because the disk is flat but has a vertically extended rim. In the second group of models the obscuration is produced by vertically-extended structures interior to the disk edge.
5.3 Obscuration by a Tall Disk Rim?
The top panel of Figure 9 shows the observed UV eclipse light curve and a synthetic light curve produced by a geometrically-thin disk with a vertically-extended rim. The orbital inclination of the model is , the disk radius is , and the rim height is , or . This rim is quite tall, raising concerns about the physical validity of the model; but the tall rim does produce a light curve that fits the observed light curve fairly well. Nevertheless, this model is fatally flawed. It has a combination of rim height and orbital inclination that leaves most of the central disk unobscured. Therefore, to avoid an eclipse that is too narrow and deep, the model must have a flat temperature distribution, thus failing to avoid the very problem it was contrived to solve. Worse, the neutron star is visible, disagreeing with X-ray observations. This is a generic and robust result for thin-disk tall-rim models. We have explored the parameter space for these models extensively, varying the orbital inclination, the disk radius and temperature, the rim height and temperature, and the irradiation of the inner surface of the rim by the inner disk and neutron star. Models that fit the observed light curve with an acceptable always have a flat temperature distribution and the neutron star is usually visible.
Flared disks – disks whose thickness increase with radius – automatically have thick rims that can hide the inner disk and neutron star. In our computer code the height of a flared disk above the orbital plane is given by
| (2) |
where and are the radii of the inner and outer edges of the disk, and is the thickness of the disk at its outer edge. If , the disk has a concave flare. The middle panel of Figure 9 shows a synthetic light curve for a flared disk. The model disk has , , , and . The synthetic light curve fits the observed light curve about as well as the light curves for thin disks with thick rims but it has the same fatal flaws: The disk has a flat temperature distribution and the neutron star is usually visible.
Models with concave flared disks have an important advantage over those with flat disks: The outer regions of the disk can be heated by irradiation from the neutron star and inner disk. The heating flattens the temperature distribution, providing a natural explanation for the flat distribution. The bottom panel of Figure 9 shows a synthetic eclipse light curve for a flared disk irradiated by the neutron star. The orbital inclination is , , , and . This value of is much larger than the standard for an -model disk, but lower values of did not fit the observed light curve well. The fit for this particular model is good but the neutron star remains visible.
In a final attempt to use the disk rim to block light from the center of the disk, we invoked a concave flared disk with an additional vertically-extended rim and allowed the disk and inner face of the rim to be irradiated by the neutron star. This model has enough free parameters to produce an excellent fit to the observed light curve at all orbital phases, not just the eclipse. But the inner disk and the neutron star still remain visible and the model fails. Thus, we reject this entire group of models.
5.4 Torus Plus Variable-Height Rim
The previous discussion leads us to consider vertically-extended disk structures closer to the neutron star. Inspired by the presence of the ADC at X-ray wavelengths, we give the disk vertical extension by adding an opaque torus (a donut with the neutron star centered in the hole of the donut). Our code allows the torus to have an elliptical cross section and specifies its geometry by three parameters: the distance from the center of the cross-section of the torus to the neutron star, which we call its radius or , the maximum height of the torus above and below the orbital plane, and the width of the torus between its inner and outer walls as measured in the orbital plane. The toroidal structure should not be taken too literally. Because 4U 1822–371 has a high orbital inclination, we observe the torus from the side and, like a donut viewed from the side, we observe only the outer wall of the torus. The observations give little information about the inner wall or about the interior of the torus. Furthermore, despite our original motivation for including the torus, we will see that the properties we derive for the torus are not consistent with the properties of an ADC and we will instead identify the torus with the optically-thick base of the disk wind.
We assume that the torus emits blackbody radiation and for simplicity we give the surface of the torus a single temperature except where it is heated by irradiation. The temperature of the torus is poorly constrained. The SED of 4U 1822–371 is not a blackbody distribution, which precludes assignment of a meaningful color temperature. The large uncertainty on the distance and reddening to 4U 1822–371 preclude measurement of an accurate brightness temperature, but the brightness temperature of the outer wall of the torus must be surprisingly low. Fits to the UV eclipse show that the outer wall extends to in the orbital plane (% of the disk radius) and the maximum height of the torus is (% of the disk radius), giving the torus a projected surface area of roughly . About half the projected area is eclipsed, , and the de-extincted eclipsed flux is erg/s/cm2/Å at 1600 Å (the blue line in Figure 7). The brightness temperature of the eclipsed surface of the torus can be calculated from , where is the distance to 4U 1822–371. For pc the monochromatic brightness temperature at 1600 Å is K. Although this temperature cannot be trusted to within a factor of two or so, it is times lower than temperatures typically associated with coronae. Thus, the brightness temperature of the torus – at least the outer wall of the torus – is not consistent with an ADC. The temperature is, however, high enough that the torus dominates the UV/optical flux from 4U 1822–371. This justifies our earlier claim that the flux from unirradiated surfaces of the secondary star and the outer surface of the disk rim can be ignored.
This torus-like structure is far too tall to agree with the thickness of an -model disk for any reasonable choice of parameters. Its temperature is far too low for it to be part of the ADC. What, then, is this vertical structure? Since we have already found a high velocity disk wind and have shown that there is much mass loss from the disk, we suggest that the vertical structure is simply the optically-thick base of the disk wind.
The torus by itself does not produce a synthetic light curve that fits the observed eclipse light curve adequately, but the addition of either an opaque vertically-extended rim or a flared disk yields an excellent fit. The best-fit synthetic light curve for a flared disk is shown in Figure 10. The model from which the light curve was calculated has an orbital inclination of , a concave flared disk with radius and edge height . The midpoint of the torus is at , its maximum height is , and its width is , so that the torus extends from to . The torus blocks flux from the neutron star and all the disk out to , and the edge of the flared disk blocks flux from most of the rest of the disk. Thus the torus solves the two problems that vitiated models with flat or flared disks and raised rims.
5.5 A Model for the Entire Orbital Light Curve
We now model the entire orbital light curve using the eclipse model from Section 5.4 as a starting point. The salient feature of the non-eclipse part of the orbital light curve is the large-amplitude, roughly-sinusoidal hump. The phase of the hump might lead one to suspect that the hump is caused primarily by the varying visibility of the irradiated face of the secondary star but our attempts to model the hump with just the irradiated secondary star yielded poor fits. The hump’s precise phase, its shape, and the variations of its shape from year to year cannot be produced by the irradiated secondary alone.
The model producing the synthetic light curve shown in Figure 10 had a torus and a disk with a dark, vertically-extended edge. We now allow the height of the edge to vary with azimuth around the neutron star. As its height varies, the rim blocks more or less of the flux from the torus, helping to produce the hump. In the previous section we introduced the vertically-extended edge by invoking a concave flared disk, but a flat disk with a vertically extended rim would have worked just as well. In the current context it is more convenient to model the edge with a flat disk and extended rim, allowing the rim height to vary with azimuth.
We also include flux from the heated secondary in the model and allow fits to the light curve to determine how much flux the secondary contributes. The secondary is heated in part by the torus and disk but mostly by X-ray flux. While we include X-ray flux in the model, it is not a physically meaningful quantity since the amount of flux needed depends sensitively on the geometry of the X-ray emitting regions, on the radiative transfer of the flux through the ADC and torus, and on the reprocessing and redistribution of the flux in the secondary star. As we have little information about any of these factors, we regard the X-ray flux as merely a convenient parameter to specify the irradiative heating of the secondary star. With the addition of a variable-height rim and flux from the irradiatively-heated secondary star we achieved successful fits to the entire orbital light curve and no further complications were needed.
While the foregoing discussion has been necessarily lengthy, the resulting model is actually rather simple. The parameters describing the geometry of the model are
-
•
The orbital inclination, which also fixes the mass ratio and the mass of the secondary star through the mass function,
-
•
the outer radius of the disk,
-
•
the height, width, and radius of the disk torus, and
-
•
the height of the disk rim as a function of azimuth around the neutron star.
We assume that the secondary star and the disk rim have low temperatures and do not contribute significant flux except where heated by irradiation. Fits to the light curve show that the inner regions of the disk are hidden by the torus and the outer regions are hidden by the disk rim, so the disk is not visible and its temperature is irrelevant. Thus the only temperature that needs to be specified is the monochromatic brightness temperature of the torus. Finally, the amount of X-ray energy irradiating the disk rim and the secondary star must be specified. There are also a few nuisance parameters such as the zero point in orbital phase, a scale factor on the flux, and various albedos that must be specified but are irrelevant to the model.
We fit the model to the observed UV light curve using a simplex algorithm to find the set of parameters that minimized the of the fit. We also examined parameter space extensively with grid searches to test the uniqueness of the fit. Within the context of the model the values of the fitted parameters are unique and robust. The resulting synthetic light curve is superimposed on the observed light curve in the top panel of Figure 11. The rim height as a function of azimuth angle is shown in Figure 12, where the azimuth angle is defined to be on the side of the disk opposite the secondary star and increases in the direction opposite the direction of orbital motion. We fit only the - and -band light curves obtained in 2006, the same year as the UV light curves were obtained. To fit the light curves we retained the values of all the parameters determined from the fit to the UV light curve except for those specifying the geometry and temperature of the torus. The fitted synthetic light curves in the - and -bands are shown superimposed on the observed light curves in the bottom two panels of Figure 11. The values of for the fits are 163.5 for 195 data points and thirteen free parameters in UV, 210.3 for 150 data points and four free parameters in , and 130.7 for 116 data points and four free parameters in , for a total reduced of 1.05.
Values for the fitted parameters are given in Table 2. The radius of the disk is and the disk rim can have a height up to , but the height for much of the disk is near , close to the -model values (Section 5.1). The height of the torus, , is the same in all three passbands, but the position of its outer wall is much different, in the UV, but in the - and -bands. This is a reflection of the obvious difference between the UV eclipse and the broader, flatter bottomed eclipse at longer wavelengths.
This model also fits the 2005 - and -band light curves, but with a change to the rim height with disk azimuth. The maximum disk rim height is approximately the same as the 2006 model with . However, the rim is now symmetric about the approximate location of the “hot spot” where the tidal stream encounters the disk and not the radius connecting the companion star and the neutron star. A detailed quantitative model is unwarranted due to the sparse sampling of the data.
On considering these results, a new issue arises. While we and Hellier & Mason (1989) before us needed to place the opaque wall near the edge of the accretion disk to fit the light curve, neither the X-ray nor the UV/optical light curves require it to be precisely at the disk edge. It could, in fact, be anywhere between the edge of the disk at and the outer wall of the torus in the - and -bands at . Although this is not a large change in position, it allows a significant re-interpretation of the wall. We placed the wall at the disk rim – and we suspect others placed it at the disk rim – primarily because there was no other disk structure to which the wall could be attached. With the addition of a disk torus the wall can plausibly be made part of the torus, becoming an opaque belt around the outside of the torus. The wall now becomes part of the disk wind, not a disk rim. This re-interpretation has a considerable advantage. When made part of the disk wind, the wall no longer need be in hydrostatic equilibrium, requiring impossibly high gas pressure or supersonic turbulence for support. It is simply a cooler, darker layer at the base of the disk wind.
6 Summary and Discussion
Combining our new times of eclipses with the previously published times, we have derived an improved ephemeris for the eclipses in the UV/optical light curves of 4U 1822–371 (equation 1). The quadratic term in the ephemeris yields a timescale for a change in orbital period of . The deduced rate of mass transfer is large, probably greater than . Mass cannot be accreting onto the neutron star at this rate without violating the Eddington limit, so much of the transferred mass must be lost from the system.
We have inferred a strong disk wind from the C IV emission line in the UV spectrum. The wind is axially symmetric and has projected outflow velocities up to 4000 km s-1. The flux in the C IV emission lines does not decrease during eclipses. Since regions less than above the disk are at least partially eclipsed, the C IV emission arises from regions yet further above the disk. The outflowing material closer to the disk either does not produce C IV emission or is hidden by other optically-thick structures.
Much of this paper was devoted to developing a model for the accretion disk in 4U 1822–371 from fits to the UV/optical orbital light curves. The following properties of the accretion disk appear to be robustly determined. The disk is large; the fitted radius is , close to the tidal truncation radius. To avoid an eclipse that is deeper and narrower than the observed eclipse, the neutron star and the central regions of the accretion disk must be obscured. The dual requirements that the models must produce synthetic light curves that fit the observed eclipse and must obscure the neutron star and central disk forces most of the obscuring material to be at intermediate radii in the disk, not at the edge of the disk. We modeled the obscuring material as an optically thick torus. The torus extends more than 3/4 of the way to the edge of the disk at UV wavelengths and nearly all the way to the edge in the - and -bands; and it extends to a height of above the disk at all wavelengths.
The surface brightness of the outer (visible) wall of the torus is only K. While this estimate is highly uncertain, the true brightness temperature is unlikely to be more than a factor of 2 – 3 higher and is far less than coronal temperatures. We have, therefore, interpreted the torus as the optically-thick base of the disk wind, not as the optical counterpart of the X-ray ADC.
We modeled the large hump in the orbital light curve of 4U 1822–371 with a combination of heated face of the secondary star and a variable-height, optically-thick wall located at the edge of the disk. All previous models for the orbital light curve have needed a similar wall, but we now suggest that the wall is actually slightly closer to the neutron star than the edge of the disk and is part of the disk wind, not the disk rim. The wall is a cooler, darker layer at the base of the disk wind just above the disk.
Our results thus yield a more complex view of the structure of the disk in 4U 1822–371. The previous X-ray observations have shown that there is a vertically-extended, optically-thick ADC stretching roughly half way out to the edge of the disk. Our UV/optical observations show that most of the outer disk emits a cooler disk wind. The wind is is optically thick close to the accretion disk but becomes optically thin at a height of above the disk. Close to the disk the wind is yet cooler and darker, forming a relatively dark wall around disk. The disk itself appears to be nearly entirely buried within and obscured by these vertically-extended structures.
References
- Baptista et al. (2002) Baptista, R., Bortoletto, A., & Harlaftis, E. T. 2002, MNRAS, 335, 665
- Blandford & Begelman (1999) Blandford, R. D. & Begelman, M. C. 1999, MNRAS, 303, L1
- Bitner et al. (2007) Bitner, M. A., Robinson, E. L. & Behr, B. B., 2007, ApJ. 622, 564
- Cardelli et al. (1989) Cardelli, J. A., Geoffrey, C. C., & Mathis, J. S. 1989, ApJ, 345, 245
- Casares et al. (2003) Casares, J., Steeghs, D., Hynes, R. I., Charles, P. A., & O’Brien, K. 2003, ApJ, 590, 1041
- Charles et al. (1980) Charles, P., Thorstensen, J. R., & Barr, P. 1980, ApJ, 241, 1148
- Cowley et al. (1982) Cowley, A. P., Crampton, D., & Hutchings, J. B. 1982, ApJ, 255, 596
- Cowley et al. (2003) Cowley, A. P., Schmidtke, P. C., Hutchings, J. B., & Crampton, D. 2003, AJ, 125, 2163
- DePoy et al. (2003) DePoy, D. L., Atwood, B., Belville, S. R., Brewer, D. F., Byard, P. L., Gould, A., Mason, J. A., O’Brien, T. P., Pappalardo, D. P., Pogge, R. W., Steinbrecher, D. P., & Teiga, E. J. 2003, in Presented at the Society of Photo-Optical Instrumentation Engineers (SPIE) Conference, Vol. 4841, Instrument Design and Performance for Optical/Infrared Ground-based Telescopes. Edited by Iye, Masanori; Moorwood, Alan F. M. Proceedings of the SPIE, Volume 4841, pp. 827-838 (2003)., ed. M. Iye & A. F. M. Moorwood, 827–838
- Drilling & Landolt (2000) Drilling, J. S., & Landolt, A. U. 2000, in Allen’s Astrophysical Quantities, 4th Ed., (New York: Springer-Verlag) Chap. 15
- Frank et al. (2002) Frank, J., King, A., & Raine, D. J. 2002, Accretion Power in Astrophysics: Third Edition (Accretion Power in Astrophysics, by Juhan Frank and Andrew King and Derek Raine, pp. 398. ISBN 0521620538. Cambridge, UK: Cambridge University Press, February 2002.)
- Griffiths et al. (1978) Griffiths, R. E., Gursky, H., Schwartz, D. A., Schwarz, J. Bradt, H., Doxsey, R. E., Charles, P. A., & Thorstensen, J. R. 1979, Nature, 276, 247
- Güver & Özel (2009) Güver, T. & Özel, F. 2009, MNRAS, 1480
- Harlaftis et al. (1997) Harlaftis, E. T., Charles, P. A., & Horne, K. 1997, MNRAS, 285, 673
- Heinz & Nowak (2001) Heinz, A., & Nowak, M. A. 2001, MNRAS, 320, 249
- Hellier & Mason (1989) Hellier, C. & Mason, K. O. 1989, MNRAS, 239, 715
- Hutchings et al. (2005) Hutchings, J. B., Cowley, A. P., Mann, r., Schmidtke, P. C., & Crampton, D. 2005, ApJ, 130, 210
- Iaria et al. (2001) Iaria, R., Di Salvo, T., Burderi, L., & Robba, N. R. 2001, ApJ, 557, 24
- Jonker & van der Klis (2001) Jonker, P. G. & van der Klis, M. 2001, ApJ, 553, L43
- Jonker et al. (2003) Jonker, P. G., van der Klis, M., & Groot, P. J. 2003, MNRAS, 339, 663
- Kuemmel et al. (2004) Kuemmel, M., Walsh, J., Larsen, S., & Hook, R. 2004, Space Telescope European Coordinating Facility Newsletter, Volume 37, p.14, 37, 14
- Kurucz (1996) Kurucz, R. L. 1996, in Astronomical Society of the Pacific Conference Series, Vol. 108, M.A.S.S., Model Atmospheres and Spectrum Synthesis, ed. S. J. Adelman, F. Kupka, & W. W. Weiss, 2–+
- Landolt (1992) Landolt, A. U. 1992, AJ, 104, 372
- Lasota (2001) Lasota, J.-P. 2001, New Astronomy Review, 45, 449
- Mason & Cordova (1982a) Mason, K. O., & Cordova, F. A. 1982a, ApJ, 255, 603
- Mason & Cordova (1982b) Mason, K. O. & Cordova, F. A. 1982b, ApJ, 262, 253
- Mason et al. (1982) Mason, K. O., Murdin, P. G., Tuohy, I. R. Seitzer, P., & Branduardi-Raymont, G. 1982, MNRAS, 200, 793
- Mason et al. (1980) Mason, K. O., Middleditch, J., Nelson, J. E., White, N. E., Seitzer, P., Tuohy, I. R., & Hunt, L. K. 1980, ApJ, 242, L109
- Mason et al. (2008) Mason, P. A., Robinson, E. L., Gray, C. L. & Hynes, R. I., 2008, ApJ, 685, 428
- Muñoz-Darias et al. (2005) Muñoz-Darias, T., Casares, J., & Martínez-Pais, I. G. 2005, ApJ, 635, 502
- Muñoz-Darias et al. (2008) Muñoz-Darias, T., Casares, J., & Martínez-Pais, I. G. 2008, AIP Conf. Proc., 983, 542
- Narayan et al. (1998) Narayan, R., Mahadevan, R., & Quataert, E. 1998, in Theory of Black Hole Accretion Disks, ed. M. A. Abramowicz, G. Bjornsson, & J. E. Pringle, 148
- Narayan et al. (2000) Narayan, R., Igumenshchev, I. V., & Abramowicz, M. A. 2000, ApJ, 539, 798
- Nice et al. (2008) Nice, D. J., Stairs, I. H., & Kasian, L. E. 2008, in “40 Years of Pulsars: Millisecond Pulsars, Magnetars, and More” ed. by Bassa, C. G. et al., AIP Conf. Proceedings, 983, 453
- Parmar et al. (2000) Parmar, A. N., Oosterbroek, T., Del Sordo, S., Segreto, A., Santangelo, A., Dal Fiume, D., & Orlandini, M. 2000, A&A, 356, 175
- Pavlovsky et al. (2006) Pavlovsky, C., et al. 2006, Advanced Camera for Surveys Instrument Handbook for Cycle 16, Version 7.1 (Baltimore: STScI)
- Puchnarewicz et al. (1995) Puchnarewicz, E. M., Mason, K. O., Cordova, F. A. 1995, Adv. Space Res., Vol. 16, No. 3, 65
- Thorsett & Chakrabarty (1999) Thorsett, S. E. & Chakrabarty, D. 1999, ApJ, 512, 288
- Warner (1995) Warner, B. 1995, Cataclysmic Variable Stars (Cambridge: Cambridge University Press)
- White et al. (1981) White, N. E., Becker, R. H., Boldt, E. A., Holt, S. S., Serlemitsos, P. J., & Swank, J. H. 1981, ApJ, 247, 994
- White & Holt (1982) White, N. E. & Holt, S. S. 1982, ApJ, 257, 318
- Wijers & Pringle (1999) Wijers, R. A. M. J. & Pringle, J. E. 1999, MNRAS, 308, 207
- Wolff et al. (2009) Wolff, M. T., Ray P. S., Wood K. S., & Hertz, P. L. 2009, ApJS, 183, 156


| Eclipse Time (HJD) | Error in | Ref. | |
|---|---|---|---|
| 2444044.8450 | 0.0060 | 1 | -0.0207 |
| 2444090.1140 | 0.0080 | 1 | -0.0128 |
| 2444101.0280 | 0.0080 | 1 | -0.0079 |
| 2444105.6650 | 0.0060 | 1 | -0.0131 |
| 2444106.5970 | 0.0060 | 1 | -0.0095 |
| 2444137.9350 | 0.0100 | 1 | -0.0062 |
| 2444411.1320 | 0.0080 | 2 | -0.0007 |
| 2444412.0580 | 0.0080 | 2 | -0.0031 |
| 2444664.8120 | 0.0080 | 3 | -0.0152 |
| 2444783.8940 | 0.0060 | 2 | -0.0048 |
| 2445579.5650 | 0.0030 | 4 | -0.0019 |
| 2445580.7250 | 0.0030 | 4 | -0.0025 |
| 2445615.3115 | 0.0020 | 4 | -0.0002 |
| 2445937.7110 | 0.0021 | 4 | 0.0004 |
| 2446234.5787 | 0.0018 | 4 | 0.0010 |
| 2447296.4798 | 0.0010 | 4 | 0.0040 |
| 2447379.3410 | 0.0010 | 4 | 0.0022 |
| 2447999.7674 | 0.0039 | 5 | 0.0011 |
| 2449163.0960 | 0.0028 | 6 | -0.0020 |
| 2449164.0237 | 0.0028 | 6 | -0.0027 |
| 2449164.2542 | 0.0028 | 6 | -0.0043 |
| 2449165.1852 | 0.0028 | 6 | -0.0018 |
| 2449166.1190 | 0.0028 | 6 | 0.0036 |
| 2450250.5308 | 0.0008 | 7 | -0.0003 |
| 2450250.7626 | 0.0008 | 7 | -0.0006 |
| 2450252.6196 | 0.0008 | 7 | -0.0004 |
| 2451264.8446 | 0.0035 | 5 | -0.0060 |
| 2451373.7094 | 0.0008 | 7 | -0.0007 |
| 2451756.4577 | 0.0012 | 7 | -0.0016 |
| 2451782.4542 | 0.0012 | 7 | -0.0015 |
| 2452089.7692 | 0.0008 | 7 | -0.0001 |
| 2453618.6767 | 0.0050 | 8 | -0.0023 |
| 2453828.9720 | 0.0010 | 8 | 0.0010 |
| 2453830.8299 | 0.0010 | 8 | 0.0020 |
| 2453932.7201 | 0.0040 | 8 | -0.0042 |
| Parameter | Value |
| Period (days) | 0.232109 |
| Inclination (degrees) | |
| () (fixed) | 1.35 |
| 0.2971 | |
| 1.1 | |
| 11In units of the orbital separation (see Section 5.1.2). | |
| UV Torus | |
| Location, 11In units of the orbital separation (see Section 5.1.2). | 0.165 |
| Torus Width11In units of the orbital separation (see Section 5.1.2). | 0.283 |
| Torus Edge Height11In units of the orbital separation (see Section 5.1.2). | 0.201 |
| Torus | |
| Location, 11In units of the orbital separation (see Section 5.1.2). | 0.245 |
| Torus Width11In units of the orbital separation (see Section 5.1.2). | 0.282 |
| Torus Edge Height11In units of the orbital separation (see Section 5.1.2). | 0.205 |
| Torus | |
| Location, 11In units of the orbital separation (see Section 5.1.2). | 0.243 |
| Torus Width11In units of the orbital separation (see Section 5.1.2). | 0.288 |
| Torus Edge Height11In units of the orbital separation (see Section 5.1.2). | 0.204 |