The spectral energy distribution of D-type symbiotic stars: the role of dust shells
Abstract
We have collected continuum data of a sample of D-type symbiotic stars. By modelling their spectral energy distribution in a colliding-wind theoretical scenario we have found the common characteristics to all the systems: 1) at least two dust shells are clearly present, one at 1000 K and the other at 400 K; they dominate the emission in the IR; 2) the radio data are explained by thermal self-absorbed emission from the reverse shock between the stars; while 3) the data in the long wavelength tail come from the expanding shock outwards the system; 4) in some symbiotic stars, the contribution from the WD in the UV is directly seen. Finally, 5) for some objects soft X-ray emitted by bremsstrahlung downstream of the reverse-shock between the stars are predicted. The results thus confirm the validity of the colliding wind model and the important role of the shocks. The comparison of the fluxes calculated at the nebula with those observed at Earth reveals the distribution throughout the system of the different components, in particular the nebulae and the dust shells. The correlation of shell radii with the orbital period shows that larger radii are found at larger periods. Moreover, the temperatures of the dust shells regarding the sample are found at 1000 K and 400 K, while, in the case of late giants, they spread more uniformly throughout the same range.
keywords:
binaries: symbiotic - stars: individual: BI Cru, SS73 38, V835 Cen, H1-36, HM Sge, V1016 Cyg, RR Tel, V627 Cas, R Aq1 Introduction
| Object | Coordinates | distance | ṀMira | ||||
|---|---|---|---|---|---|---|---|
| [kpc] | [years] | [days] | [M⊙/yr] | [K] | [K] | ||
| BI Cru | 12:23:27.4 -62:38:16.5 | 2 | - | 280 | - | 1300 | |
| SS73 38 | 12:51:26.2 -64:59:58.8 | 4.8 | - | 463 | - | - | |
| V835 Cen | 14:14:09 -63:25:45.3 | 2.8 | - | 450 | - | 2250 | 1000 |
| H1-36 | 17:49:48.2 -37:01:27.0 | 4.5 | 95 | 450-500 | 2500 | 700 | |
| HM Sge | 19:41:57.1 16:44:39.6 | 2.3 | 9020 | 527 | 3000 | 1400 | |
| V1016 Cyg | 19:57:05 39:49:36.0 | 2.930.75 | 8025 | 474 | 2450150 | 600 | |
| RR Tel | 20:04:18.52 -55:43:33.4 | 2.5 | - | 387 | 2300 | 1000 | |
| V627 Cas | 22:57:42 58:49:14.0 | 0.8 | - | 466 | - | 265050 | 100050 |
| R Aqr | 23:43:49.4 -15:17:40.3 | 0.2 | 44 | 395 | 2800 | 1000 |
The word ”symbiotic” was introduced by Merrill in 1944 and this term is currently used for the category of variable stars with composite spectrum. The main spectral features of these objects are: 1) the presence of a red continuum typical of a cool star , 2) the rich emission line spectrum, and 3) the UV excess. […] In addition to the peculiar spectrum, the very irregular photometric and spectroscopic variability is the major feature of symbiotic stars. So Viotti in 1993 introduced the symbiotic phenomenon.
Since then, a large number of symbiotic stars (hereafter SSs) was observed. In 1995 we started the analysis of SSs by interpreting the line spectra of RS Ophiuci (Contini et al. 1995) by means of shock-dominated models. At that time, it was established that both the WD and red giant stars loose winds which collide within and outwards the system (Nussbaumer 2000 and references therein). Therefore, to model the SS systems on a large scale, we adopted the colliding-wind scenario of Girard & Willson (1987) which leads to different shock fronts throughout the SS. The nebulae downstream are illuminated by the flux from the stars, therefore, a composite model (shock + photoionization) was needed, and successfully applied to HM Sge (Formiggini, Contini, Leibowitz 1995).
In certain objects accretion disks are formed at certain epochs. They blow up during the outburst of the hot component star. The presence of a disk is revealed by the jets that were observed and modelled, for instance, in BI Cru (Contini et al 2009b), He2-104 (Contini & Formiggini 2001), R Aqr (Contini & Formiggini 2003), CH Cyg (Contini et al. 2009c), etc. The line ratios observed in the jet regions show lower densities ( 200 ) and velocities (FWHM of 150-200 ) than those corresponding to the nebulae created by the wind collision ( 107 and 1000 , respectively). Therefore, also the continuum flux intensity is lower and does not significantly affect the SED.
We realized that the results of the line spectrum analysis of SSs should be used to constrain the spectral energy distribution (SED) of the continuum. The observations in the different wavelength ranges provided sufficiently reliable data. Therefore, not only the red giant star and some times even the WD could be recognized throughout the SED, but today the plural nature of the emitting nebulae and of the dust shells within the SS systems is well established (Contini 1997; Contini & Formiggini 2001, 2003; Angeloni et al. 2007a, hereafter Paper I; Angeloni et al. 2007b,c and references therein; Contini et al. 2009a,b,c and references therein).
Moreover, it is difficult to explain the observed IR SED of dusty SSs by a single temperature, and nowadays theoretical models and observations too have been confirming that several dust temperatures should be combined in order to reproduce the NIR-MIR data (Anandarao et al. 1988, Schild et al. 2001, Paper I). This will be definitively demonstrated by further data coming from the MIR-FIR windows that ISO, Spitzer, and AKARI have opened.
The present analysis focuses on a sample of D-type (i.e. dusty) SSs, producing a detailed picture of each system. The SS continua are analysed in a quantitative way mainly through the light-curve variability, through the cool and hot star spectra and through the emission line spectra in the optical and UV range. In particular, by modelling the data in the continuum, we could clearly recognise in each object the relative contribution of the dust shells and of the nebulae. The shells are ejected as a consequence of pulsations of the Mira, while the nebulae appear downstream of the shock fronts created by the collision of the star winds.
As mentioned above, the calculation of the spectra must account consistently for shocks and photoionization; therefore, we use for the calculation of the spectra the code SUMA111http://wise-obs.tau.ac.il/marcel/suma/index.htm, which simulates the physical conditions of an emitting gaseous nebula under the coupled effect of photoionization from an external source and shocks, and in which line and continuum emission from gas are calculated consistently with dust reprocessed radiation as well as with grain heating and sputtering. SUMA has been applied to interpret several SSs, as extensively reported in previous papers (e.g. Angeloni et al. 2007b; Contini et al. 2009b and references therein), as well as nova stars (V1974, Contini et al. 1997; T Pyx, Contini & Prialnik 1997) and supernova remnants (e.g. Kepler’s SNR, Contini 2004).
We present the D-type SS sample in Table 1. We gathered for each object the observational data from the literature and the results obtained by modelling the continuum SED, which were constrained by the analysis of the line spectra in each object.
Our aim is to characterize the SED of D-type SS; therefore we chose our targets on the basis of the best data available, in order to create a SED on a large wavelength range for each object. This has allowed to better constrain several physical parameters essential for a meaningful and comprehensive interpretation, taking into account some issues, e.g. the effects of intrinsic flux variability on our modelling method. In this way, we are able to compare the features common to the dusty SSs. Moreover the correlations of the characteristic physical properties such as luminosity, orbital period, dust shell sizes, etc., is discussed on the basis of reliable parameters.
In Sect. 2 the data are presented and discussed in the light of the photometric and spectroscopic variability. Sect. 3 deals with theoretical aspects: the colliding wind scenario, the calculation code, and the modelling method. In Sect. 4 the SEDs are analysed. The results are shown for the single SS in Sect. 5. Discussion and conclusion remarks follow in Sect. 6.
2 The sample
The study of the continuum SED of SSs in a large frequency range, from radio to X-ray, needs a large view of the data over all the spectral ranges. More specifically, we assembled the sample data by cross-checking the Belczyński et al. (2000) atlas with the ISO Data Archive (IDA), and then by selecting those objects which showed the best-quality observations. Then, we have looked for complementary data in other wavelength regions in order to create an extended SED of the data for each object. This has allowed to better constrain several physical parameters. At the same time, this has also suggested to discuss some specific issues, e.g. the effect of intrinsic flux variability on our modelling method, that we present at the end of this section. Comparing the sample introduced in Table 1 with the original one studied in Paper I, notice that CH Cyg has been removed because we have dedicated to it two detailed papers (Contini et al. 2009a,c). Moreover, a new object has been added: SS73 38. This SS has been chosen because virtually ignored in literature, and may thus represent a stimulating challenge for testing the validity of our modelling approach.
2.1 The ISO-SWS data
The core of the data we exploit in this paper is composed of spectra recorded by the Short Wavelength Spectrograph (SWS - de Graauw et al. 1996) on board of the Infrared Space Observatory (ISO), which covered the wavelength range between 2.38 m and 45.2 m. In the present context, we employ them mainly as fine MIR continuum tracers. All these spectra have been presented and analysed for the first time in Paper I, the only exception being HM Sge (originally discussed by Schild et al. 2001) and SS73 38 (still unpublished). Further technical details can be found in Paper I and references therein. The ISO-SWS journal of observations appears in Table 2.
2.2 Complementary data from literature
Some public surveys in the literature were particularly helpful in supplying observational data for the different objects of the sample. For the radio-mm range, the works by Purton et al. (1982), Ivison et al. (1992,1995) and Wendker (1995) have been fundamental.
In the IR, despite the significant variability in the NIR range (mainly due to the Mira pulsations) that results in a non-perfect alignment at the edges of some photometric data points taken in different periods, we were able to build an unambiguous SED within the observation uncertainties. In this spectral range, the 2MASS All-Sky Catalogue of Point Sources, the IRAS Catalogue of Point Sources, the MSX6C Infrared Point Source Catalogue (Egan et al. 2005), as well as the catalogue by Munari et al. (1992) have been fully exploited. The latter provides photometric data for several SSs from the U (0.33 m) to the L (3.54 m) band.
In the optical domain some papers presented photometric monitoring throughout the last years that allowed to choose data points in a few cases very close in time to the ISO observations: in particular, we refer to Skopal et al. (1996, 2002, 2004, 2007), Arkhipova et al. (2004), Taranova & Shenavrin (2000), Bergner et al. (1988), Munari et al. (1992), Gromadzki et al. (2009).
| Object | Coordinate center | ISO TDT | texp | Observation date | |
|---|---|---|---|---|---|
| (J2000) | number | [s] | cal. / JD (2450) | - | |
| BI Cru | 12:23:26.39 -62:38:16.5 | 25901615 | 1140 | 02-08-1996 / 297 | 0.571 |
| SS73 38 | 12:51:26.21 -64:59:58.8 | 60700908 | 1912 | 15-07-1997 / 644 | 0.288 |
| V835 Cen | 14:14:08.99 -63:25:45.3 | 60702103 | 1140 | 15-07-1997/ - | - |
| H1-36 | 17:49:48.24 -37:01:27.0 | 32400609 | 1140 | 06-10-1996/ - | - |
| HM Sge | 19:41:57.11 16:44:39.6 | 31901701 | 1140 | 01-10-1996/ 357 | 0.644 |
| ” | 19:41:57.06 16:44:40.2 | 54700107 | 1912 | 16-05-1997/ 584 | 0.749 |
| V1016 Cyg | 19:57:05.00 39:49:36.0 | 35500977 | 1140 | 05-11-1996/ 398 | 0.214 |
| ” | 19:57:04.99 39:49:35.9 | 55102706 | 1140 | 20-05-1997/ 588 | 0.612 |
| ” | 19:57:05.01 39:49:36.4 | 74601883 | 1140 | 01-12-1997/ 783 | 0.199 |
| RR Tel | 20:04:18.52 -55:43:33.4 | 12402160 | 1062 | 20-03-1996/ 162 | 0.664 |
| ” | 20:04:18.62 -55:43:33.1 | 54601206 | 1912 | 15-05-1997/ 583 | 0.757 |
| ” | 20:04:18.49 -55:43:33.7 | 73402079 | 1140 | 19-11-1997/ 771 | 0.245 |
| V627 Cas | 22:57:42.07 58:49:14.0 | 09604831 | 1044 | 21-02-1996/ - | - |
| R Aqr | 23:43:49.36 -15:17:40.3 | 18100530 | 1834 | 16-05-1996/ 219 | 0.213 |
2.3 Remarks about source variability


One of the most interesting aspect of SSs is the spectral and photometric variability. Nevertheless, it is highly unlikely that observations in such different ranges are coeval. So we try to understand whether, and for which purposes, the variability can be considered a second-order effect, particularly for those objects known to have had outburst episodes, i.e. displaying the largest flux variations.
We wonder whether the collection of data ranging from radio to UV, and belonging to a temporal interval that in some cases is as wide as a decade or more, might still be reliable to model the SEDs.
The first step has been to look at the literature, in order to understand how the community faces this fairly common problem.
We have found that several interesting results about radio and IR flux correlations were found out assembling observations taken within a temporal range of several years (e.g. Wright & Allen 1978; Seaquist et al. 1993). For instance, the SEDs of the jet emission from R Aqr and CH Cyg systems were built up by collecting data points taken in the years 1989-2002 (Galloway & Sokoloski 2004, Fig. 4). Moreover, a study based on MIR observations of the SS CH Cyg (Biller et al. 2006) surprisingly found that data taken at very different epochs (e.g. IRAS PSC, IRAS LRS, ISO, photometric points from Taranova & Shevranin 2000, 2004 and Bogdanov & Taranova 2001) are in good agreement with each other, despite CH Cyg being known as a variable SS which has gone through several outburst episodes even in the recent past.
The radio band deserves a special discussion: first, because the radio observations come from the ’70 and ’80 surveys, well before the ISO mission; second, because it is known that in SSs the radio emission can be significantly variable (Seaquist et al. 1984, 1993), even more than in the IR. A study by Matthews & Karovska (2006) of the near system o Ceti (spatially resolved for the first time thanks to the Very Large Array), has shown that radio variability has not altered the flux densities by more than 30% during the past 8.5 yr. Furthermore, an analysis of the continuum emission data at and wavelengths by Ivison et al. (1995), spanning a period of 4 years, has demonstrated that virtually all the objects of their large sample show flux density variations within a factor of 5. Translated in SED diagrams (see 4), this implies a vertical shift which still allows to discern between the main emission processes arising from the symbiotic nebulæ (bremsstrahlung and synchrotron). An interesting example of this is given by CH Cyg, which in the late ’80s showed bremsstrahlung and in the middle ’90s synchrotron emission in the radio range (Contini et al. 2009c). Summarizing, we can confidently state, on the basis of current literature, that symbiotic variability does not modify the general properties of such systems as much as to invalidate our approach.
Whatever the case, we would like to verify this assumption directly, by fully exploiting the data for the unfortunately few, well studied objects composing our sample. We have thus started verifying the agreement between the IRAS and ISO flux levels, although there is a time delay of 15 years. Moreover, whenever possible, we have also tried to join the IRAS and ISO spectra to the NIR observations coming from long-lived photometric surveys: in some cases (as for HM Sge and V1016 Cyg) we have assembled a SED composed by data taken within a temporal range not larger than 10 days, from the U band to the upper edge (45 m) of the ISO-SWS spectrum! Obviously, in this case the flux agreement is excellent.
Finally, some objects were observed by ISO-SWS more than once during its lifetime, making possible a direct comparison of the MIR spectral variability over different (tough unknown) Mira pulsation phases. In Fig. 1 we plot the ISO-SWS spectra for three well-studied SSs. Despite some known instrumental effects, such as the sudden worsening of the spectrum quality longwards of 28 m due to the mediocre performance of the SWS band 3E at 27.5 - 29 m) we can recognize some interesting general trends. The strongest flux variations, whose relative ratio is not larger than a factor of 0.6, arise from the cool star emission that dominates up to 5-6 m. The dust thermal emission (although not constant) varies within 0.3-0.4: this variability, as we discuss in Sect. 3, does not alter significantly our estimates of the dust shell sizes. For instance, by modelling the different ISO spectra for HM Sge, we find that the inferred dust shell size at 1000K varies by a factor 1.1, and the at 380K by a factor 1.2. Similarly, for V1016 Cyg, we find a variation of 1.1 for both the shells, well within the assumed uncertainty of our method.

3 The modelling
In the past years, theoretical models as well as observations have shown that in SSs both the hot and cool stars lose mass through strong stellar winds that collide within and outside the system, hence creating a complex network of wakes and shock fronts that result in a complicated structure of gas and dust nebulae (Nussbaumer 2000). This shock network results from the interaction of the fast WD wind with the slow, dense outflow from the Mira, and corresponds to the colliding wind configuration of Girard & Willson (1987), which is a theoretical basis to the more realistic picture of shock fronts disrupted by hydrodynamic instabilities.
In the light of this scenario, one can consider that two shock-fronts develop from the collision of the winds between the stars (Girard & Willson 1987, Kenny & Taylor 2005): one strong shock-front facing the WD (the reverse shock) and the other weak one facing the red giant. Similarly, in the extended circumbinary region, two shock fronts develop from the head-on-back collision of the winds: one expanding outwards and the second, virtually negligible, facing the system center (see the sketch presented by Contini et al. 2009c, Fig. 2). In the following, we refer to the two main shock fronts: namely, the reverse between the stars and the expanding outwards the system. The expanding shock front is disrupted by collision with the ISM inhomogeneities.
The gas entering the shock front is thermalized up to a maximum temperature of T=1.5 105 (/100 )2 (where is the shock velocity) in the region immediately behind the discontinuity. A high temperature zone appears in the downstream region. Then, the gas recombines following a relatively high cooling rate due to the high pre-shock densities characteristic of symbiotic nebulae and to compression downstream.
In the calculation code SUMA, the downstream region is cut in many plane-parallel slabs in order to follow as smoothly as possible the trend of the physical conditions, particularly, the temperature.
The calculations of the fluxes in the different slabs of the gas downstream is shown in Fig. 2 in the case of HM Sge, starting by the slabs at higher temperatures. Shock velocities can reach 400 in the region between the stars by head-on collision of the winds (Paper I). The high temperatures downstream lead to emission in the high frequency domain up to X-rays. On the other hand, the radiation from the WD, even at outburst, heats the gas to no more than 1-3 104 K in a relatively large zone downstream, leading to the bump in the optical range and to the high bremsstrahlung for 1010 1015 Hz.
The input parameters of the code are those relative to the shock:
the pre-shock density, ,
the shock velocity, , the pre-shock magnetic field, ,
and those relative to photoionization: the hot star ionizing radiation flux and its
colour temperature .
The abundances of He, C, N, O, Ne, Mg, Si, S, Ar and Fe,
relative to H, the dust-to-gas ratio and the geometrical thickness of the nebulae ,
are also accounted for.
The key parameter is obviously the shock velocity, . For high-velocity shocks, the very
high temperature reached in the post-shock region leads to the X-ray emission observed
in several SSs. Moreover, broad strong lines can also be observed along the whole
electromagnetic spectrum, particularly the coronal lines in the
infrared (Paper I): therefore, from the spectral point of view,
different line profiles trace different velocity regimes,
allowing to highlight the different physical conditions within a SS.
The dust grains are heated both radiatively by the primary and secondary radiation flux from the hot star and from hot gas downstream, respectively, and collisionally by the gas in each slab downstream. In a shock-dominated regime, collisional processes dominate and the grains can reach relatively high temperatures. The intensity of the dust re-radiation emission peak depends strongly on the dust-to-gas ratio, while the frequency corresponding to the peak depends on the shock velocity.
Furthermore, since the matter is highly inhomogeneous at the shock fronts because of instabilities at the fluid interface (e.g. the Rayleigh-Taylor, Kelvin-Helmholtz, Meshkov-Richtmyer), different physical conditions should be accounted for in each one of the symbiotic system, particularly regarding the density (e.g. in BI Cru - Contini et al. 2009c).
4 The continuum SED
In this paper we deal with the continuum SED of a sample of D-type SSs. The data in the X-ray, UV, optical, IR, and radio ranges are modelled by the free-bound and free- free flux (hereafter bremsstrahlung) calculated consistently by each model.
The IR continuum SED in SSs give some direct information about the system components, in particular, of the dust shells. Moreover, in the IR range, reprocessed radiation by dust grains coexisting with the gas in the nebulae is accounted for. It was found by modelling previous SSs that the peak of dust re-radiation calculated consistently with bremsstrahlung seldom emerges over it, adopting even high ratios. The SEDs in the IR are explained by the summed fluxes from dust at different temperatures, which are well recognizable, indicating that they most likely correspond to different shells.
In the radio and in the X-ray ranges, the continuum accounts for the emission from the shocked nebulae. The WD flux appears in some objects in the U band and in the UV range, even if the shocked nebulae also contribute (see Contini et al. 2009c for detailed modelling).
| symb | radio - mm | IR | optical - UV |
|---|---|---|---|
| BI Cru | Ivison et al. 1995 | IRAS; ISO; 2MASS | Rossi et al. 1988; Gromadzki et al. 2009 |
| SS73 38 | Wendker et al. 1995 | IRAS; ISO; 2MASS | Gromadzki et al. 2009 |
| V835 Cen | Purton 1982; Ivison et al. 1995 | IRAS; ISO; Feast et al. 1983 | - |
| H1-36 | Purton 1977; Ivison et al. 1995 | IRAS; ISO | Allen 1983 |
| HM Sge | Purton 1982; Ivison et al. 1992 | IRAS; ISO; Taranova et al. 2000 | Arkhipova et al. 2004 |
| V1016 Cyg | Purton 1982; Ivison et al. 1992 | IRAS; ISO; Taranova et al. 2000 | Taranova et al. 2000 |
| RR Tel | Purton 1982; Ivison et al. 1995 | IRAS; ISO; 2MASS | Kharchenko 2001; Gromadzki et al. 2009 |
| V627 Cas | - | IRAS; ISO | Bergner et al. 1988 |
| R Aqr | Purton 1982; Ivison et al. 1992 | IRAS; ISO; 2MASS | Kharchenko 2001; Gromadzki et al. 2009 |
4.1 The continuum from gaseous nebulae
The continuum SED of SSs gives more direct informations about the system components than the line spectra do. However the latter are more constraining the models. For instance, the relative chemical abundances for each model can be found out modelling the line ratios, while only dramatic changes in the abundances of carbon, nitrogen, and oxygen, that are strong coolants, can strongly alter the continuum SED.
Since the observations are taken at the Earth, while the models are calculated at the nebula, to compare the models with the data, we define the factor =(ff r/d)2, where r is the distance of the nebula from the SS center, d the distance to Earth, and ff the filling factor. The factors, depending on the distance of the nebulae from the system center, not only constrain the models but also provide precious informations about the radius of shocked nebulae and dust shells within the system.
The results of modelling for single objects are presented in the next section. For some objects of the sample (i.e. RR Tel, HM Sge, R Aqr, H1-36, and BI Cru) we already analyzed in detail the emission line spectra in previous papers. Therefore, for the sake of consistency and also to verify the validity of our results about the continuum, we use the models consistently calculated on the basis of the emission line ratios. We are also aware that in the last years new data have appeared; moreover, the SUMA code has been updated. Therefore, we have also run new models based on those previously adopted which take into account the new features. For the other objects which either have been less observed or for which we have not considered explicitly the emission line spectra (V627Cas, V835Cen, SS38 and V1016 Cyg) we have used as a basis the main models which explained the SED of other objects, adopting always one model representing the shocked nebula downstream of the reverse shock between the stars, and the other representing the expanding shock.
4.2 The dust shells
Dust shells with different temperatures were discovered by the detailed modelling of single D-type SSs (e.g. Paper I, Angeloni et al. 2007b, Contini et al. 2009b)
According to hydrodynamic model atmospheres, the Mira variable pulsations lift up matter from the stellar surface and extend it to the atmosphere, which is modified by the shock waves created by stellar pulsations. Locally, the passing shocks cause a temporary variation of the thermodynamical conditions, influencing the formation of molecules and dust grains (Hoefner 2009). In fact the shock waves lead to a levitation of the stellar atmosphere, providing a cool and dense environment as required for an efficient formation and growth of dust grains.
The newly formed grains are accelerated by the stellar radiation field and initiate a slow massive outflow by transferring momentum to the surrounding gas. More particularly, while the interaction of a particle with a gravitational field depends solely on the particle mass, its interaction with a radiation field depends on its composition, structure, size, and density, as well as on the radiation wavelength. Thus, if in the outer layers of a star there are particles that are exceptionally absorbent at the leading wavelength of the photon -as determined by the temperature - then for these particles the radiation pressure might just overcome gravity (Prialnik 2000 ). The result would be an outer acceleration leading to a mass outflow of such particles and other entrained by them.
These particles are accelerated by the radiation pressure. Consequently a dust shell is ejected from the star. The dust shells can then be destroyed by evaporation, when the grains reach temperatures 1200 K, or by sputtering of the grains throughout strong shocks.
In addition IR observations have shown the existence of a cool emission component which indicates dusty circumstellar material.
We would like to investigate in detail the dust-to-gas ratio by mass in the shells. This is an interesting issue, not only in the specific case of symbiotic systems, but in the understanding of IR emission from starburst galaxies and luminous IR galaxies (e. g. Contini & Contini 2007), which is generally attributed to supernovae (e. g. Dweck 1987).
Moreover, extinction increases with dust mass and dust is created in the atmosphere of the giant star. On the other hand, the grains cannot survive close to the WD because they evaporate at temperatures 1500 K. So extinction of the Mira is generally greater than that of the WD in several SSs (one can notice it in H1-36 and HM Sge also looking at our Fig. 4, where the cool star is virtually unnecessary in modelling the data around log14.5.). However, in a system observed edge-on the WD is periodically occulted by the red giant star and by the network of shocked nebulae created by collision of the winds. This leads to complex light curves as those observed from e.g. CH Cyg.
Previous models for circumstellar shells deals with isolated stars. For instance Young et al. (1993) adopt a simple model of shell evolution, involving the interaction of the expelled material with the ISM. For oxygen rich Mirae, the models of Le Sidaner & Le Bertre (1996) consider a dust shell surrounding a central star which radiates as a black body. All the models lead to dust temperatures 800 K.
Our model is similar to that used for the shells in the CH Cyg system (Contini et al. 2009c), namely, the dust+gas shell moves outwards the Mira and a shock front forms on the external edge. The radiation flux from the hot star reaches the shell on the shock front. We proceed as for the nebulae, considering many downstream slabs and calculating the physical conditions in each of them. Radiation is calculated by radiation transfer throughout the different slabs.
We adopt a shock velocity of 30 . The shocks form by head-on collision of the shell with the wind from the WD between the stars and by head-on-back collision with the giant wind or by collision with the interstellar matter beyond the binary system. The code SUMA is used for the calculations. The other significant input parameters used for the calculations are =6 109 , =3 10-3 gauss, similar to those adopted by Contini et al. (2009c, Table 1).
The results show that dust grains are heated to 1000 K collisionally by the gas which reaches temperature T 104 K throughout the shock front and downstream. Recall that shells with dust temperatures of 1000 K are present in late-type stars (Danchi et al. 1994) as well as in SSs, showing that collisional heating dominates. The radiation from the WD will most easily destroy the grains by heating them beyond the evaporation critical temperature ( 1500 K).
The best fit to R Aqr continuum SED in the IR (Fig. 3) is obtained by by mass 0.1, which is of the order of the dust-to-gas ratios found in SN and by a factor of 103 higher than in the ISM.
The reprocessed emission by dust is well reproduced by the black body (bb) flux at 1000 K because only the first few slabs of the shell close to the shock front, emit a strong flux. In the following slabs, the grain temperature rapidly decreases following the high cooling rate of the gas. So, generally, the emission from a shell is well approximated by a bb flux at a certain temperature. In the following, we represent the shell emissions by bb fluxes at the temperature best fitting the data in the continuum SED.
Beyond the Mira, on the side opposite to the WD, the shock accompanying the shell accelerates throughout the decreasing density slope in the Mira extended atmosphere. At =100 and =2 107 the grains are collisionally heated to 440 K, as observed in different objects.
| Object | U | |||||||
|---|---|---|---|---|---|---|---|---|
| BI Cru | ||||||||
| rev | 400 | 1.e5 | 1.e-3 | 2.65e4 | 1 | 1.e14 | 4.e-4 | |
| exp | 150 | 1.6e3 | 1.e-3 | 2.65e4 | 25 | 1.e15 | 4.e-4 | |
| lobes | 210 | 2.e4 | 1.e-3 | - | - | 1.e18 | 4.e-4 | |
| SS73 38 | ||||||||
| rev | 400 | 1.e5 | 1.e-3 | 2.65e4 | 1 | 1.e14 | 4.e-4 | |
| exp | 70 | 3.e4 | 1.e-4 | - | - | 5.e15 | 4.e-5 | |
| V835 Cen | ||||||||
| rev | 400 | 1.e5 | 1.e-3 | 2.65e4 | 1 | 1.e14 | 4.e-4 | |
| exp | 70 | 3.e4 | 1.e-4 | - | - | 5.e15 | 4.e-5 | |
| H1-36 | ||||||||
| rev | 140 | 2.5e5 | 1.e-3 | 1.5e5 | 2.e-3 | 2.8e12 | 4.e-4 | |
| exp | 70 | 3.5e3 | 1.e-3 | 1.5e5 | 2.5e-3 | 1.e15 | 4.e-4 | |
| HM Sge | ||||||||
| rev | 500 | 5.e5 | 1e-3 | 1.6e5 | 1. | 1.4e14 | 4.e-5 | |
| exp | 210 | 2.e4 | 1.e-3 | - | - | 1.e18 | 4.e-4 | |
| V1016 Cyg | ||||||||
| rev | 500 | 5.e5 | 1e-3 | 1.6e5 | 1. | 1.4e14 | 4.e-5 | |
| exp | 70 | 3.e4 | 1.e-4 | - | - | 5.e15 | 4.e-5 | |
| RR Tel | ||||||||
| rev1 | 80 | 1.e6 | 1.e-3 | 1.4e5 | 0.2 | 5.5e13 | 4.e-4 | |
| exp | 45 | 2.e6 | 1.e-3 | 1.4e5 | 2.e-4 | 1.e14 | 4.e-4 | |
| revXX | 500 | 1.e6 | 1.e-3 | 1.4e5 | 0.2 | 5.9e13 | 2.e-4 | |
| V627 Cas | ||||||||
| rev | 400 | 1.e5 | 1.e-3 | 2.65e4 | 1 | 1.e14 | 4.e-4 | |
| exp | 70 | 3.e4 | 1.e-4 | - | - | 5.e15 | 4e-5 | |
| R Aqr | ||||||||
| revHII | 120 | 6e4 | 2e-3 | 8e4 | 6e-3 | 2e14 | 4e-4 | |
| exp150 | 150 | 4e3 | 1.e-4 | - | - | 2.5e15 | 4e-4 | |
| exp300 | 300 | 1.e3 | 1.e-4 | - | - | 4.e-4 |
5 Results
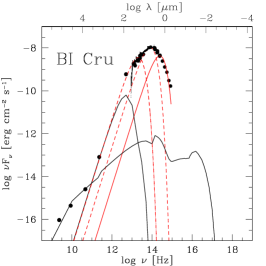
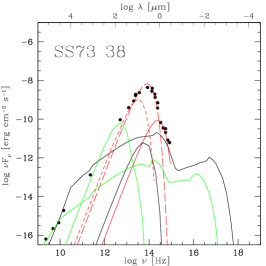
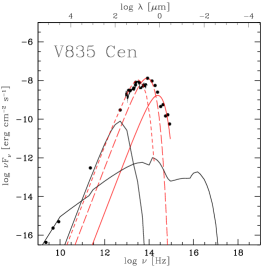
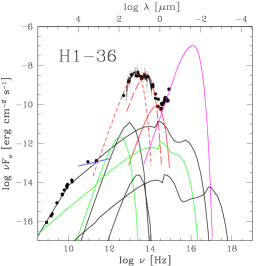
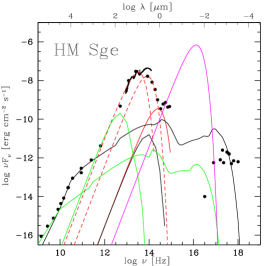
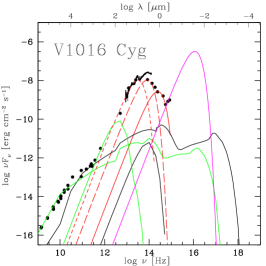
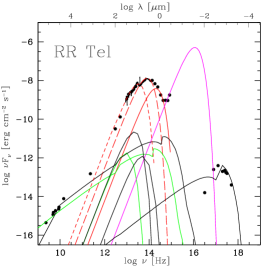
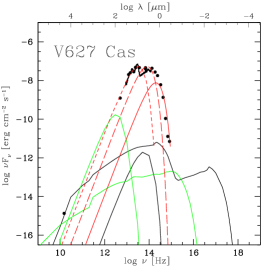
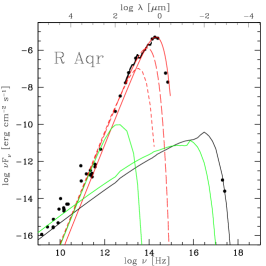
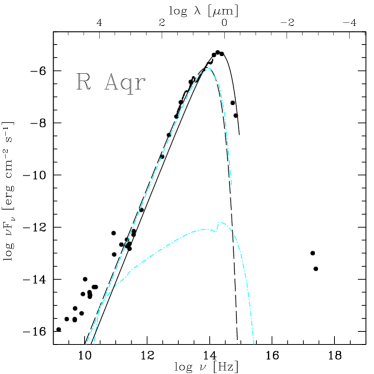
We present in Fig. 4 the results of modelling the continuum SEDs of D-type SSs.
The input parameters adopted for the best fit of models to data (Table 4) are obtained by
cross-checking the line spectra in most of the objects. They
represent the physical conditions in the different nebulae within the SS.
Some significant results appear in Table 5
In column 2 the best fit temperature of the Mira is given, in columns 3 and 4 the radius of the
reverse and expanding shocks appear, followed in columns 5 and 6 by the radius of the dust shells
at 1000K and 400 K, respectively.
A first look at the diagrams in Fig. 4 reveals that the component types of SSs are similar. A reverse and an expanding shocks are usually present, as well as multiple dust shells. Virtually in all the objects, the peak of the dust shell at 1000 K shows the maximum flux throughout the entire continuum SED, from radio to X-ray.
The self-absorbed free-free radiation flux in the radio range corresponds to the reverse shock.
On the other hand, the expanding shock is responsible for the radio emission in the low
frequency tail. Moreover, between log()=16.6 and 18 the X-rays can be strongly absorbed
(Zombeck 1990).
Brief notes on the single objects are presented in the following.
BI Cru
A careful analysis of BI Cru as a colliding-wind SSs has been recently described by Contini et al. (2009b).
We refer to that paper for any further details about models and results.
Here it is worth mentioning that the IR SEDs show the presence of two, relatively cooler, dust shells at 800 K and 250 K.
BI Cru has a very unusual near-IR spectrum, with strong CO in emission
(Whitelock et al. 1983, Fig. 3)
which suggests that something other
than dust may give a significant contribution to the flux.
For instance the presence of SiO molecules in D-type SSs (Paper I) was predicted from the intensity
ratio of characteristic Si lines. Unfortunately, no millimeter spectra are available for this object.
SS73 38
The data in the radio range are well reproduced by the same models adopted for HM Sge. The datum at the highest frequencies represents the summed contribution of the flux from the red giant (T=3000 K) and bremsstrahlung from the reverse-shock nebula.
Also in this case, two dust shells are found. Nonetheless, the dust temperatures are slightly higher than in BI Cru,
being respectively at 1000K and 400K. These appear to be the standard values for dust shell
in SSs as revealed on the basis of our analysis.
V835Cen
Only the model with =210 appears in the modelling.
The spectra from V835 Cen by Gutierrez-Moreno & Moreno (1996) show the presence of the
[OII]3728 line which indicates relatively low densities. In fact, the
critical density for collisional deexcitation is low ( 3000 ).
Moreover, the presence of the [FeVII] lines with a [FeVII]6087/[OIII]5007
0.07 is compatible with shock velocities 200 (see the grid calculated for the shock dominated spectra by Contini & Viegas 2001).
This leads to a model similar to that adopted for the lobes of BI Cru.
The model is shock-dominated, i.e. not constrained by the
WD temperature.
The red giant flux is reproduced by a bb corresponding to T=3000 K.
Two dust shells are revealed, at 1000 K and 400 K respectively.
H1-36
This SS was modelled in detail by Angeloni et al. (2007b).
We refer to that paper for any further details about models and specific results.
The Mira is at T=2500 K and the dust shells are at T=850 K and at 250 K.
HM Sge
The reverse model is described in Paper I.
The expanding model, adopted phenomenologically, is similar to that used
for BI Cru lobes.
The Mira temperature is approximated by T= 3000 K
and also in this case the dust shells are at T= 1000 K and 400 K.
The X-ray data (Kwok & Lehay 1984) indicate that there is a strong
absorption in the X-ray domain.
Within the 1016 -1018 Hz range X-ray are heavily absorbed
with absorption cross sections increasing towards lower frequencies (Zombeck 1990),
thus improving the fit to this object, as shown in Fig. 4.
V1016 Cyg
The line spectrum presented by Schmid & Shield (1990) shows lines from different
ionization levels and from different elements. The line ratios are very similar
to those of the HM Sge line spectrum, therefore we use
the models adopted for HM Sge (Paper I).
The temperature of the Mira is approximated by T=3000 K.
Two shells at 1000K and 400K are confirmed in the IR SED.
RR Tel
Also the IR SED of RR Tel is well reproduced by emission from dust shells at 1000 and 400 K. The temperature of the giant is of 2450 K. The nebulae were modelled by Contini & Formiggini (1999, Table 1) with models rev1, exp, and revXX, as reported also in Table 4.
The emission from the WD is emerging in the UV frequency range and is reproduced by a bb corresponding to T= 1.4 105 K, in agreement with the temperature adopted to explain the line spectra.
RR Tel modelling reveals also that the shock front facing the
red giant, which is generally negligible in other SSs, is
contributing to the spectra, while the contribution of the expanding shock
in the extended external region is in this case not relevant.
The two component (reverse and expanding) which contribute
to the lines are hardly recognizable in the SED because the shock velocities
are very similar.
Model revXX which explains the X-ray is very similar to those found in Paper I
by fitting the IR line ratios.
V627Cas
There is only one datum in the radio, an upper limit which constrains
the models. The radii of the nebulae thus are also upper limits. We used the reverse shock model from BI Cru.
The temperature of the Mira is approximated by T=2450 K, while two main shells of
dust at T=1000 K and 400 K are recognizable in the IR.
R Aqr
This SS was modelled in details by Contini & Formiggini (2003),
therefore we take their models to explain the data.
The Mira temperature is approximated by T=2500 K.
Interestingly, this is the only case where just one dust shell (at T=1000K) is evident from the IR data.
The data are not enough to permit to understand whether a cooler shell is actually present,
or if R Aqr is a peculiar system under this aspect.
6 Discussion
A consistent understanding of the symbiotic phenomenon has been possible only after their binary nature was acknowledged. Moreover, the study of dust grains and, in general, of dust shell properties in SSs is interesting not only in itself, but also in the light of SSs as colliding-wind systems, namely systems where shocks are at work. We thus have the unique opportunity of studying in a relatively small region both dust condensation and destruction processes, as well as the mutual interaction of grains with a very dynamic ambient gas. The results of dust features in SSs are given in a previous paper (Paper I).
After having briefly described the single objects one by one, we would like to investigate some common properties that appear evident in our analysis. This can be done because we can apply to the continuum SED from the nebulae, the solutions of the calculations used for modelling the line spectra. They are unique because the line ratios are strongly constraining. The models are further cross-checked comparing the calculated fluxes with the observed absolute fluxes. This leads, for instance, to the calculation of the radius of the nebulae which must be compatible with the geometrical dimensions of the system (e.g. the binary separation for the reverse shock, etc).
There is strong evidence that virtually all SSs of the sample have at least two dust shells, at about ”standard” temperatures. It can be asked whether are there two dust shells or dust with a range of temperatures. Considering single AGB stars, it seems that there is a monotonic continuity of grain temperature profiles, starting from the highest value defined by the dust temperature at the condensation radius. We could refer more properly to dust within a temperature range. In SSs, on the other side, the colliding-wind binary nature of the system causes a real discontinuity in the dust spatial distribution (e.g. more than a single dust shell) since the WD radiation field and shocks modify the local physical conditions, in some cases even preventing (Paper I) or altering (Angeloni et al. 2007c) the dust condensation sequence.
Two peaks are generally directly recognizable from the SED. Other peaks between them, corresponding to intermediate temperatures, would be less intense in order to be unseen. Lower fluxes would correspond to radii smaller than that of the hot dust shell. This is unsuitable to a smooth distribution of dust temperatures with radii.
Actually the theoretical models predict the shell temperatures and radii by the direct comparison with the SED observational data. It can be noticed from the diagrams in Fig. 4, that the dust thermal emission emerges from the SED profile as an infrared excess easily recognizable as a black body like bump corresponding to T1000 K. Moreover, a cooler dust shell (T 400 K) often appears, while dust reprocessed radiation from the shocked nebulae seldom emerges over the bremsstrahlung.
The shell radii are obtained by adjusting the results of consistent modelling (Table 5) to the continuum absolute fluxes observed at Earth. Comparing dust shell sizes with the most likely values reported in the literature for symbiotic binary separation, it seems that the hottest (T 1000K) dust shells are the ”classic” circumstellar shells known to surround Mira and other AGB stars, while the coolest (T 400K) ones are likely to be circumbinary structures, namely they surround the whole system. This seems to be a peculiar feature of D-type systems.
The 1000 K shell would always be distinguishable, because it is actually an expanding dusty envelope somehow ”detached” from the star itself: in fact, the suitable physical and chemical conditions for grain formation are usually reached beyond a few stellar radii (see e.g. Danchi et al. 1995). Moreover, we have tried to demonstrate that the coolest dust shell is mainly circumbinary, and clearly recognizable on the SED only if the dust grains survive sputtering and evaporation.
In the following, we discuss some further correlations which highlight specific features of dust shells in SSs, e.g. the luminosity of symbiotic dust shells, the links between temperature of dust and radius of the corresponding shell, also in comparison with a sample of other dusty stars. Eventually, we have looked for any relations between dust shell radii and orbital periods.
| object | TMira | rrev | rexp | r1000 | r400 |
|---|---|---|---|---|---|
| BI Cru | 3000 | - | 7 | 1.5e141 | 1.6e152 |
| SS73 383 | 3000 | 6.3e13 | 3.5e15 | 1.5e14 | 2.2e14 |
| V835 Cen | 3000 | 3.4e14 | 8.9e15 | 7.9e13 | 2.5e14 |
| H1-36 | 2500 | 1.e14 | - | 4.4e141 | 4.7e152 |
| HM Sge | 3000 | 7.7e14 | 6.9e15 | 2.45e14 | 1.1e15 |
| V1016 Cyg | 3000 | 6.22e14 | 3.9e16 | 2.5e14 | 8.8e14 |
| RR Tel | 2450 | 1.36e15 | 1.1e15 | 3.4e14 | 8.6e14 |
| V627 Cas | 2450 | 1.9e14 | 1.2e16 | 1.5e14 | 5.37e14 |
| R Aqr | 2500 | 6.e14 | 6.e15 | 1.9e14 | - |
6.1 Dust shell luminosity
We consider the flux at the peak (Fpeak) of the bb emission, corresponding to the dust shell closest to the Mira, at the highest temperature. In Fig. 5 Fpeak vs. the square distance to Earth is shown for all the objects of the sample. Most of the sample objects have a shell corresponding to 1000 K. We have included also the objects with a shell at 800 K (BI Cru) and CH Cyg, which is not definitively classified as a D-type (see however Contini et al. 2009c), for comparison. The data are taken from the diagrams in Fig. 4 and Table 5. Recall that /, where is the flux, the luminosity, and the distance from Earth. The objects, except V835 Cen, follow as expected a straight line because the luminosity mainly depends on the temperature of the emitting shell. Moreover, the dusty material had not yet the time to merge with the interstellar matter. The line in the diagram is defined by HM Sge, V1016 Cyg, SS73 and R Aqr.
We employ this diagram to guess out a likely distance from Earth of SS73 38. In fact, from the diagram in Fig. 4 we measure a flux of 10-8.2 at the peak of the 1000 K shell. The point at this flux on the line in Fig. 5 should correspond to a distance of 3.6 kpc slightly less than the 4.8 kpc given by Gromadzki et al. (2009), and derived exploiting the period-colour relation for Miras as in Whitelock et al. (2006). Moreover, for V835Cen, Whitelock (1987) gives a distance of 2.8 kpc in agreement with Fig. 4 diagram, while the 9.4 kpc distance by Feast et al. (1983) is clearly over predicted.

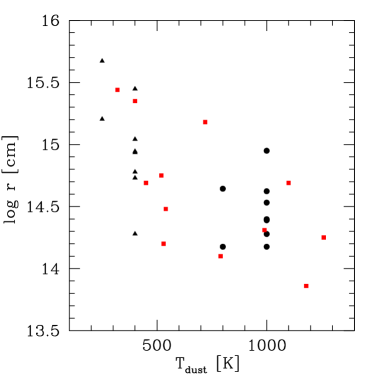
6.2 Dust shell radius
In Fig. 6 we have plotted the radius of the shells versus the dust temperature. Comparing with the data of Danchi et al. (1994) for isolated stars, the temperatures of symbiotic dust shells reach similar values. However, the dust shell temperatures regarding the sample are generally concentrated at 1000 K and 400 K, while in the case of late giants, they spread more uniformly throughout the same range. The origin of the gap can be ascribed to the WD radiation which can lead to evaporation of the grains in its proximity.
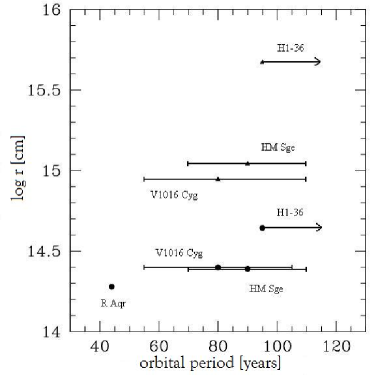
6.3 Orbital periods
Unfortunately, reliable values for symbiotic orbital parameters are known only for S-types. Some further speculations have been proposed also for the quite rare D’-type objects (Zamanov et al. 2006), but no definite results exist for D-types. For these dusty objects, there are just rough constraints about binary separation based on dynamical considerations (i.e. hosting a Mira giant forces the system to have an orbital period of at least some decades of years) and, in any case, the uncertainties in several basic parameters are too large.
Nonetheless, we would like to investigate how the dust shells periodically ejected by the Mira feel the influence of the compact, much hotter object. Presumably, the very circumstellar region around the WD is dust-free, because grains can not survive such high temperatures (Munari et al. 1992). In contrast, the region of the Mira facing the center of the system might not be so disturbed by the diluted WD radiation field as to prevent the condensation of dust grains, because of the large binary separation.
Another aspect that must be taken into account is the turbulent character of the interbinary colliding-wind regions, which leads to sputtering rather than evaporation, as the most important grain destruction mechanism (Paper I).
In order to find out if the symbiotic character influences also the dust shell parameters, we investigate the correlation between the dust shell radii, as calculated by the SED modelling, and the orbital periods as reported in literature for some objects of our sample. Fig. 7 shows that, within the error bars, a significant trend is recognizable: the longer the orbital period, the larger the shell radii. Even though these results cannot be quantifi ed yet (our sample is not statistically significant and uncertainties in several basic parameters are too large), this correlation looks meaningful enough to encourage further investigations. Eventually, a last consideration is common to Figs. 5, 6 and 7. The representing points of the dust shell radius lie in two distinct regions of the diagrams: the first one, at log r 14.7, populated by the hottest shells, and the other one at log r 15, by the coolest ones. Interestingly, the gap in the shell radius distribution overlaps the median strip corresponding to the typical binary separation for D-type SS. This indicates that dust grains cannot condensate, or easily evaporates, along the WD orbit where the radiation field of the hot component is too harsh for grain survival.
The presence of a companion star splits the system into two regions, an interbinary one and a circumbinary. The interbinary region is filled by the shell surrounding the Mira and expands with a velocity of about 30 , hence reaching a distance of about 1014 cm in a very short time ( 1 year) with respect to the orbital period, and then expands outwards. Close to the WD the dust grains are easily evaporated, hence causing the gap in the distribution of dust throughout the system. This is reflected by the distribution of the shell radii in Fig. 6. When the shell reaches a distance of 1015 cm, its mass, calculated by the mass loss rate (mshell 10-6 M⊙ assuming ṁ=10-7 M⊙ /y), is of the same order of the mass swept up from the circumstellar region (mswept 1.3 10-6 M⊙ , adopting a shell geometrical thickness of 1013 cm and a gas density of 107 ), therefore, the shell will lose any identity by merging with the interstellar medium. This could explain why just one external shell is recognizable. New spectra in the extreme far-IR, allowing to detect cooler and cooler dust, will reveal other outer structures before merging with the ISM.
7 Concluding remarks
We have collected continuum data in the IR for a sample of D-type SSs. For most of the objects the detailed modelling of the line spectra and the continuum SED in previous specific works leads to an accurate description of the physical characteristics and of the morphological structure throughout each system. For the other objects we have guessed the constraining parameters from a first analysis of the line ratios and/or by similarity with other well-known objects.
The study of dust grains and, in general, of dust shell properties in SSs is interesting not only in itself, but also in the light of SSs as colliding-wind systems, namely systems where shocks are at work. We thus have the unique opportunity of studying in a relatively small regions both dust condensation and destruction processes, as well as the mutual interaction of grains with a very dynamic ambient gas.
By modelling the SED continuum for each object, we have found the common characteristics to all the systems: 1) at least two dust shells are clearly present at about 1000 K and 400 K, 2) the radio data are explained by thermal self-absorbed emission from the reverse shock between the stars, while 3) the data in the long wavelength tail come from the expanding shock outwards the system. 4) In some system the contribution from the WD in the UV can be directly seen. Finally, 5) soft X-ray produced by bremsstrahlung from the reverse-shock nebula between the stars, are predicted for some objects.
The results thus confirm the validity of the colliding wind model and the important role of the shocks. The dust shells which were so important in explaining some features in the light curve at different phases of the CH Cyg (Contini et al. 2009c) are well recognizable in all the D-type objects. We wonder whether their presence will have an impact on the IR light curve at certain phases.
The flux peak of the 1000 K dust shells are inversely correlated with the square distance to Earth. This permitted to guess out the distance of SS73 38 and to select the appropriate distance of V835 Cen.
By consistent modelling of the dust shell at 1000 K in R Aqr, we have found that the dust-to-gas ratio by mass is 0.1, even higher than that evaluated for supernovae.
The comparison of the flux calculated at the nebula with those observed at Earth reveals the distribution throughout the system of the different components, both nebulae and dust shells. The correlation of shell radii with the orbital period show that larger radii are found at larger periods. Moreover, the temperatures of the dust shells regarding the sample, are generally concentrated at 1000 K and 400 K, while in the case of late giants, they spread more uniformly throughout the same range because the WD radiation most probably leads to evaporation of the grains in its proximity.
Acknowledgments
We are very grateful to the referee for constructive criticism and helpful comments. We thank E. Leibowitz for interesting conversations. RA remembers M. Mariani for his constant encouragement during the very preliminary version of this work.
References
- Allen (1983) Allen, D. A. 1983, MNRAS, 204, 113
- Allen (1974) Allen, D.A. 1974, Inf. Bull. Var. Stars, 911
- Anandarao et al. (1988) Anandarao, B. G., Taylor, A. R., & Pottasch, S. R. 1988, A&A, 203, 361
- Angeloni et al. (2007a) Angeloni, R., Contini, M., Ciroi, S., & Rafanelli, P. 2007a, AJ, 134, 205, Paper I
- Angeloni et al. (2007b) Angeloni, R., Contini,M., Ciroi, S., & Rafanelli, P. 2007b, A&A, 471, 825
- Angeloni et al. (2007c) Angeloni, R., Contini,M., Ciroi, S., & Rafanelli, P. 2007c, A&A, 472, 497
- Arkhipova et sl. (2004) Arkhipova, V. P., Esipov, V. F., Ikonnikova, N. P., & Noskova, R. I. 2004, VizieR Online Data Catalog, 903, 297
- Belczyński et al. (2000) Belczyński, K., Mikołajewska, J., Munari, U., Ivison, R. J., & Friedjung, M. 2000, A&As, 146, 407
- Bergner et al. (1988) Bergner, Y. K., Miroshnichenko, A. S., Yudin, R. V., Yutanov, N. Y., Kuratov, K. S., & Mukanov, D. B. 1988, Soviet Astronomy Letters, 14, 262
- Biller et al. (2006) Biller, B. A., et al. 2006, ArXiv Astrophysics e-prints, arXiv:astro-ph/0604336
- Bogdanov & Taranova (2001) Bogdanov, M. B., & Taranova, O. G. 2001, Astronomy Reports, 45, 797
- Contini (1997) Contini, M. 1997, ApJ, 483, 887
- Contini (2003) Contini, M. 2003, MNRAS, 339, 125
- Contini (1994) Contini, M. 2004, A&A, 422, 591
- Contini, Formiggini (1999) Contini, M., & Formiggini, L. 1999, ApJ, 517, 925
- Contini, M. & Formiggini, L. (2001) Contini, M. & Formiggini, L. 2001 A&A, 375, 579
- Contini & Formiggini (2003) Contini, M. & Formiggini, L. 2003, MNRAS, 339, 148
- Contini & Prialnik (1997) Contini, M. & Prialnik, D. 1997, ApJ, 475, 803
- Contini& Contini (2007) Contini, M. & Contini, T. 2007 AN, 328, 953
- Contini & Viegas (2001) Contini, M., Viegas, S.M. 2001 ApJS, 132, 211
- Contini et al. (1995) Contini, M., Orio, M., Prialnik, D. 1995, MNRAS, 275, 195
- contini et al. (2009a) Contini, M., Angeloni, R., Rafanelli, P. 2009a, A&A, 496, 759
- contini et al. (1997) Contini, M., Collodel, L., Rafanelli, P. in Astronomical Time Series, Eds. D. Maoz, A. Sternberg, and E.M. Leibowitz, 1997 (Dordrecht: Kluwer), p. 203
- contini et al. (2009b) Contini, M., Angeloni, R., Rafanelli, P. 2009b, MNRAS, 396, 807
- contini et al. (2009c) Contini, M., Angeloni, R., Rafanelli, P. 2009c, AN, 330, 816
- Danchi et al. (1994) Danchi, W. C., Bester, M., Degiacomi, C. G., Greenhill, L. J., & Townes, C. H. 1994, AJ, 107, 1469
- de Graauw et al. (1996) de Graauw, T., et al. 1996, A&A, 315, L49
- Dougherty et al. (1995) Dougherty, S. M., Bode, M. F., Lloyd, H. M., Davis, R. J., & Eyres, S. P. 1995, MNRAS, 272, 843
- Dwek (1987) Dwek, E. 1987, ApJ, 322, 812
- Egan et al. (1995) Egan, M. P., van Dyk, S. D., Sloan, G. C., Kraemer, K. E., Price, S. D. 2005, AAS,20713208
- Feast et al. (1983) Feast, M. W., Whitelock, P. A., Catchpole, R. M., Roberts, G., & Carter, B. S. 1983, MNRAS, 202, 951
- Feast et al. (1983) Feast, M. W., Catchpole, R. M., Whitelock, P. A., Carter, B. S., & Roberts, G. 1983, MNRAS, 203, 373
- Formiggini et al. (1995) Formiggini, L., Contini, M., Leibowitz, E.M. 1995, MNRAS, 277, 107
- Galloway & Sokoloski (2004) Galloway, D. K., & Sokoloski, J. L. 2004, ApJ, 613, L61
- Girard & Willson (1987) Girard, T., & Willson, L. A. 1987, A&A, 183, 247
- Gromadzki et al. (2009) Gromadzki, M., Mikłajewska, J., Whitelock, P., & Marang, F. 2009, Acta Astronomica, 59, 169
- Gutierrez & Moreno (1996) Guitierrez-Moreno, A., Moreno, H. 1996, PASP, 108, 972
- Hoefner (2009) Hoefner, S. 2009, arXiv:0903.5280
- Hollis et al. (1997) Hollis, J. M., Pedelty,J. A., & Lyon, R. G. 1997, ApJl, 482, L85
- Ivison et al. (1992) Ivison, R. J., Hughes, D. H., & Bode, M. F. 1992, MNRAS, 257, 47
- Ivison et al. (1995) Ivison, R. J., Seaquist, E. R., Schwarz, H. E., Hughes, D. H., & Bode, M. F. 1995, MNRAS, 273, 517
- Kenny & Taylor (2005) Kenny, H. T., & Taylor, A. R. 2005, ApJ, 619, 527
- Kharchenko (2001) Kharchenko, N. V. 2001, Kinematika i Fizika Nebesnykh Tel, 17, 409
- Kotnik-Karuza et al. (2002) Kotnik-Karuza, D., Friedjung, M., & Selvelli, P. L. 2002, A&A, 381, 507
- (45) 1984, ApJ, 283, 675
- Lee et al. (2003) Lee, H.-W., Sohn, Y.-J., Kang, Y. W., & Kim, H.-I. 2003, ApJ, 598, 553
- Le Sidaner (1996) Le Sidaner, P., Le Bertre, T. 1996, 1996 A&A, 314, 896
- Matthews & Karovska (2006) Matthews, L. D., & Karovska, M. 2006, ApJL, 637, L49
- Munari (1992) Munari, U. 1992 A&A, 257, 163
- Munari et al. (1992) Munari, U., Yudin, B. F., Taranova, O. G., Massone, G., Marang, F., Roberts, G., Winkler, H., & Whitelock, P. A. 1992, A&AS, 93, 383
- Munari et al. (1996) Munari, U., Yudin, B. F., Kolotilov, E. A., & Tomov, T. V. 1996, A&A, 311, 484
- Nussbaumer (2000) Nussbaumer, H. 2000, ASP Conf. Ser. 204: Thermal and Ionization Aspects of Flows from Hot Stars, 204, 317
- Parimucha (2003) Parimucha, Š. 2003, Contributions of the Astronomical Observatory Skalnate Pleso, 33, 99
- Prialnik (2000) Prialnik, D. 2000, in ’An Introduction to the Theory of Stellar Structure and Evolution’, Cambridge
- Purton et al. (1977) Purton, C. R., Allen, D. A., Feldman, P. A., & Wright, A. E. 1977, MNRAS, 180, 97P
- Purton et al. (1982) Purton, C. R., Feldman, P. A., Marsh, K. A., Allen, D. A., & Wright, A. E. 1982, MNRAS, 198, 321
- Richards et al. (1999) Richards, A. M. S., Bode, M. F., Eyres, S. P. S., Kenny, H. T., Davis, R. J., & Watson, S. K. 1999, MNRAS, 305, 380
- Rossi et al. (1988) Rossi, C., Altamore, A., Ferrari-Toniolo, M., Persi, P., & Viotti, R. 1988, A&A, 206, 279
- Schild & Schmid (1996) Schild, H., & Schmid, H. M. 1996, A&A, 310, 211
- Schild et al. (2001) Schild, H., Eyres, S. P. S., Salama, A., & Evans, A. 2001, A&A, 378, 146
- Schmid & Schild (2002) Schmid, H. M., & Schild, H. 2002, A&A, 395, 117
- Schwarz & (1992) Schwarz, H. E., & Corradi, R. L. M. 1992, A&A, 265, L37
- Seaquist et al. (1984) Seaquist, E.R., Taylor, A.R., Button, S. 1984, ApJ, 284, 202
- Seaquist et al. (1993) Seaquist, E. R., Krogulec, M., & Taylor, A. R. 1993, ApJ, 410, 260
- (65) Skopal, A., et al.: 1996, MNRAS, 282, 327
- Skopal et al. (2002) Skopal, A., Bode, M. F., Crocker, M. M., Drechsel, H., Eyres, S. P. S., & Komžík, R. 2002, MNRAS, 335, 1109
- Skopal (2004) Skopal, A. 2004, ASP Conf. Ser. 318: Spectroscopically and Spatially Resolving the Components of the Close Binary Stars, 318, 367
- Skopal et al. (2007) Skopal, A., Vaňko, M., Pribulla, T., Chochol, D., Semkov, E., Wolf, M., & Jones, A. 2007, Astronomische Nachrichten, 328, 909
- Taranova & Shenavrin (2000) Taranova, O. G.,& Shenavrin, V. I. 2000, Astronomy Letters, 26, 600
- Taranova & Shenavrin (2004) Taranova, O. G., & Shenavrin, V. I. 2004, Astronomy Reports, 48, 813
- Viotti (1993) Viotti, R. 1993, in Cataclismic variables and related objects, NASA SP-507, Friedjung,M.,Hack,M.,Viotti,M.
- Wendker (1995) Wendker, H. J. 1995, A&As, 109, 177
- Whitelock et al. (1983) Whitelock, P. A., Feast, M. W., Roberts, G., Carter, B. S., & Catchpole, R. M. 1983, MNRAS, 205, 1207
- Whitelock (1987) Whitelock, P. A. 1987, IAU Coll. 103,47
- Whitelock (1987) Whitelock, P. A. 1987, PASP, 99, 573
- Whitelock et al. (2006) Whitelock, P. A., Feast, M. W., Marang, F., & Groenewegen, M. A. T. 2006, MNRAS, 369, 751
- Wright & Allen (1978) Wright, A. E., & Allen, D. A. 1978, MNRAS, 184, 893
- Young (1993) Young,K, Phillips, T.G., Knapp, G.R. 1993, Apj, 409, 725
- Zamanov et al. (2006) Zamanov, R. K., Bode, M. F., Melo, C. H. F., Porter, J., Gomboc, A., Konstantinova-Antova, R. 2006, MNRAS, 365, 1215
- Zombeck (1990) Zombeck, M. V. 1990, Handbook of Space Astronomy and Astrophysics (Cambridge: Cambridge Univ. Press)