“UKIRT at 30 – A British Success Story”, Royal Observatory of Edinburgh, 14-16 September, 2009
The HiZELS/UKIRT large survey for bright Ly emitters at 111In this work, an H km s-1 Mpc-1, and cosmology is used and magnitudes are given in the Vega system. For full details, please refer to Sobral et al. (2009b).
David Sobral1, Philip Best1, Jim Geach2, Ian Smail2, Jaron Kurk3, Michele Cirasuolo4,
Mark Casali5, Rob Ivison4, Kristen Coppin2 & Gavin Dalton6
1- IfA, Edinburgh University, UK; - ICC, Durham University, UK; - MPE, Garching, Germany; - ESO, Garching, Germany;
- Oxford University, UK
Abstract
We present the largest area survey to date (1.4 deg2) for Ly emitters (LAEs) at , as part of the Hi- Emission Line Survey (HiZELS). The survey, which primarily targets H emitters at , uses the Wide Field CAMera on the United Kingdom Infrared Telescope and a custom narrow-band filter in the band to reach a Ly luminosity limit of erg s-1 over a co-moving volume of Mpc3 at . Two candidates were found out of 1517 line emitters, but those were rejected as LAEs after follow-up observations. This improves the limit on the space density of bright Ly emitters by 3 orders of magnitude and is consistent with suppression of the bright end of the Ly luminosity function beyond . Combined with upper limits from smaller but deeper surveys, this rules out some of the most extreme models for high-redshift Ly emitters. The potential contamination of narrow-band Ly surveys at by Galactic brown dwarf stars is also examined, leading to the conclusion that such contamination may well be significant for searches at , and .
1 Introduction
Understanding how and when the first stars and galaxies formed is one of the most fundamental problems in astronomy. Furthermore, whilst many sophisticated models of early galaxy formation and evolution have been constructed, it is clear that observations of the most distant galaxies are mandatory to really test, refine, or refute such models. Indeed, considerable manpower and telescope time have been invested in such observations, with the detection of a Gamma Ray Burst (GRB) at (Tanvir et al., 2009) being one of the most recent highlights of this extraordinary endeavor. However, despite the recent success in using GRBs to find the most distant sources, the current samples of high redshift galaxies have been mostly assembled using two methods: the broad-band drop-out technique and narrow-band imaging surveys.
The widely-used drop-out technique (pioneered at by Steidel et al., 1996) requires very deep broad-band imaging, and can identify galaxies as z-band drop-outs (e.g. Bouwens et al., 2008; Richard et al., 2008). Furthermore, the use of this technique, combined with the recent installation of the Wide Field Camera 3 (WFC3) on the Hubble Space Telescope (HST), has led to the identification of roughly 20 candidates (e.g. Bouwens et al., 2009; Oesch et al., 2009; McLure et al., 2009). While this is an efficient method for identifying candidates, it still requires detailed spectroscopic follow-up to confirm them, especially to rule out contributions from other populations with large z breaks, such as dusty or evolved galaxies and ultra-cool galactic stars (e.g. McLure et al., 2006). Confirming the candidates is actually quite a significant challenge, since the typical candidates found so far are just too faint for spectroscopic follow-up.
The narrow-band imaging technique has the advantage of probing very large volumes looking for Ly in emission. Whilst it can only detect sources with strong emission lines, and still depends on the Lyman-break technique to isolate very high-redshift emitters, it can yield suitable targets for follow-up spectroscopy with the current instrumentation. Narrow-band Ly searches at have been extremely successful in detecting and confirming emitters (e.g. Hu et al., 1998) and, so far, this technique has resulted in the spectroscopic confirmation of the highest redshift galaxy (: Iye et al., 2006). Even more recently, Hibon et al. (2009) identified 7 candidate Ly emitters at . There have been attempts to detect Ly emitters at (e.g. Willis & Courbin, 2005; Cuby et al., 2007; Willis et al., 2008), but all such studies have been unsuccessful to date, having surveyed very small areas (a few tens of square arcmins at most).
With the advent of wide-field near-IR detectors it is now possible to increase the sky area studied by over 2 to 3 orders of magnitude and reach the regime where one can realistically expect to detect objects. This is a key aim of, for example, the narrow-band component of the UltraVISTA Survey (c.f. Nilsson et al., 2007). It is also an aim of HiZELS, the Hi-Z Emission Line Survey (c.f. Geach et al., 2008; Sobral et al., 2009a, b; Garn et al., 2009), that we are carrying out using the WFCAM instrument on the 3.8-m UK Infrared Telescope (UKIRT). HiZELS is using a set of existing and custom-made narrow-band filters in the , and bands to detect emission lines from galaxies at different redshifts over 10 square degrees of extragalactic sky. In particular, the narrow-band filter (hereafter NBJ) is sensitive to Ly at .
2 Data, selection and candidates
Deep narrow-band (NB, 3, erg s-1 cm-2) imaging was obtained across 1.4 deg2 in the UKIRT Infrared Deep Sky Survey Ultra Deep Survey (UKIDSS UDS; Lawrence et al., 2007) and the Cosmological Evolution Survey (COSMOS; Scoville et al., 2007) fields, both of which have a remarkable set of deep multi-wavelength data available – this resulted in the selection of 1517 potential line emitters. The NBJ filter (m) is sensitive to Ly emission at , probing a co-moving volume of 1.12 Mpc3 – by far the largest probed by a narrow-band survey at these wavelengths. Details regarding the observations, data reduction and the general selection of NBJ emitters can be found in Sobral et al. (2009a).
For a source to be considered a candidate Ly emitter it is required to: i) be selected as a narrow-band emitter in Sobral et al. (2009a); ii) have at least one other detection in the near-infrared; iii) be visually believable in NBJ and the other band(s), avoiding noisy areas; and iv) be undetected ( and direct visual analysis) in the available visible band imaging (,,,,z) – subaru and ACS/hst.
No candidates were found in the UKIDSS UDS field, with all emitters that passed tests i) to iii) being clearly detected in z-band imaging. In COSMOS, however, 2 candidates were found that satisfied all criteria. The brightest source was followed-up spectroscopically using the CGS4 instrument on UKIRT in January 2009 – these data failed to confirm an emission line. Both candidates were then re-observed using WFCAM (further imaging in February 2009), resulting in the non-detection of both candidates. Further investigation shows that the sources are likely to be artifacts caused by an unfortunate coincidence of a set of slightly hot pixels (not sufficient to be flagged as bad pixels) which, combined with the ditter pattern, produced a few excess at one location on the combined image.
3 Ly luminosity function at
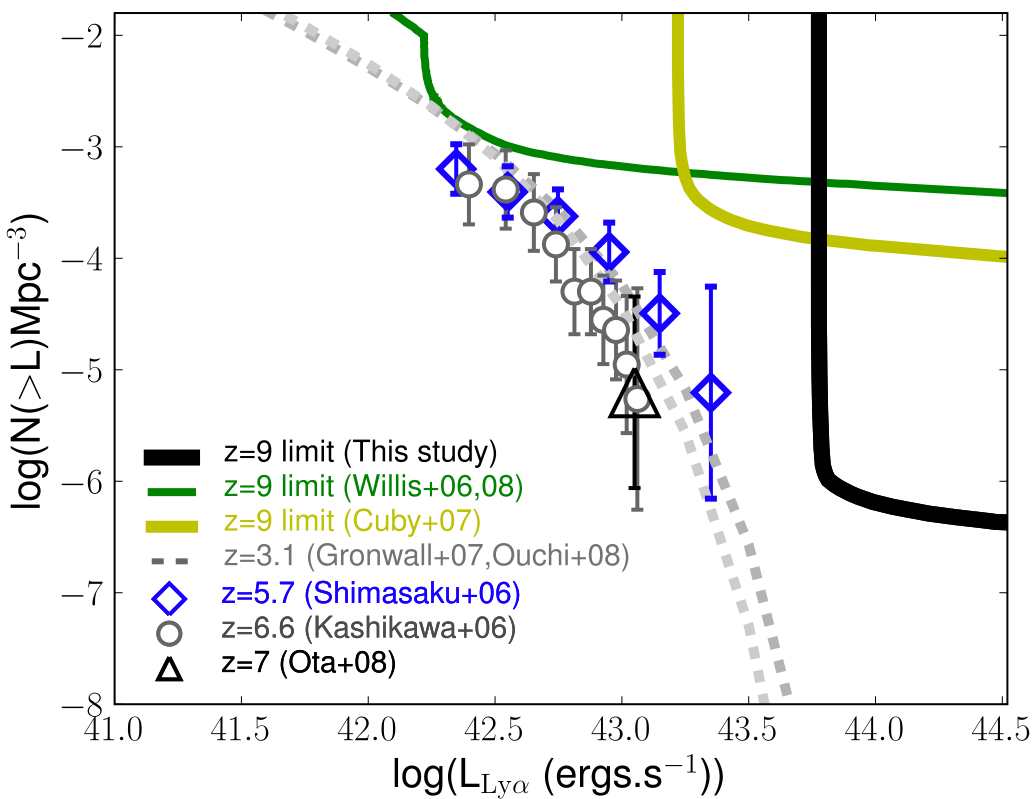
A non-detection of ( erg s-1) Ly emitters at , in a co-moving volume of 1.12 Mpc3 allows the tightest constraint on the bright end of the Ly luminosity function, as previous surveys (Willis & Courbin, 2005; Cuby et al., 2007; Willis et al., 2008) have only covered very small areas (a factor 1000 smaller). However, since those surveys have gone significantly deeper (up to a factor of 100), combining all the results from the literature can constrain the Ly luminosity function across a wide range of luminosities (10 erg s-1). The left panel of Figure 1 presents such constraints, indicating the inverse of the volume selection function for each survey. These are compared to the measured Ly luminosity functions from to , revealing that there is little evolution in the bright end of the luminosity function between and . Nevertheless, those bright emitters seem to become much rarer at (Kashikawa et al., 2006), indicating that is not increasing from onwards. The results presented here are also consistent with no (or negative) evolution in (log(L∗)0.5) from to .
3.1 Comparison with models and future surveys
Many authors have made predictions regarding the Ly luminosity function at , either by extrapolating the luminosity function of these emitters from lower redshift, or by using numerical or semi-analytical models. The semi-analytical models discussed here are obtained from galform (Baugh et al., 2005) – these are based on CDM, having been successful in reproducing a wide range of galaxy properties at different redshifts, including Ly emitters up to (c.f. Baugh et al., 2005; Le Delliou et al., 2006; Orsi et al., 2008). The observational approach, as in Nilsson et al. (2007), extrapolates the Schechter function parameters based on those obtained in the redshift range. In practice, this results in little evolution but a significant negative evolution. Finally, the phenomenological approach in Thommes & Meisenheimer (2005) assumes that Ly emitters at high redshift are spheroids seen during their formation phase. Each galaxy is assumed to be visible as a Ly emitter during a starburst phase of fixed duration that occurs at a specific redshift, drawn from a broad distribution (c.f. Thommes & Meisenheimer, 2005).
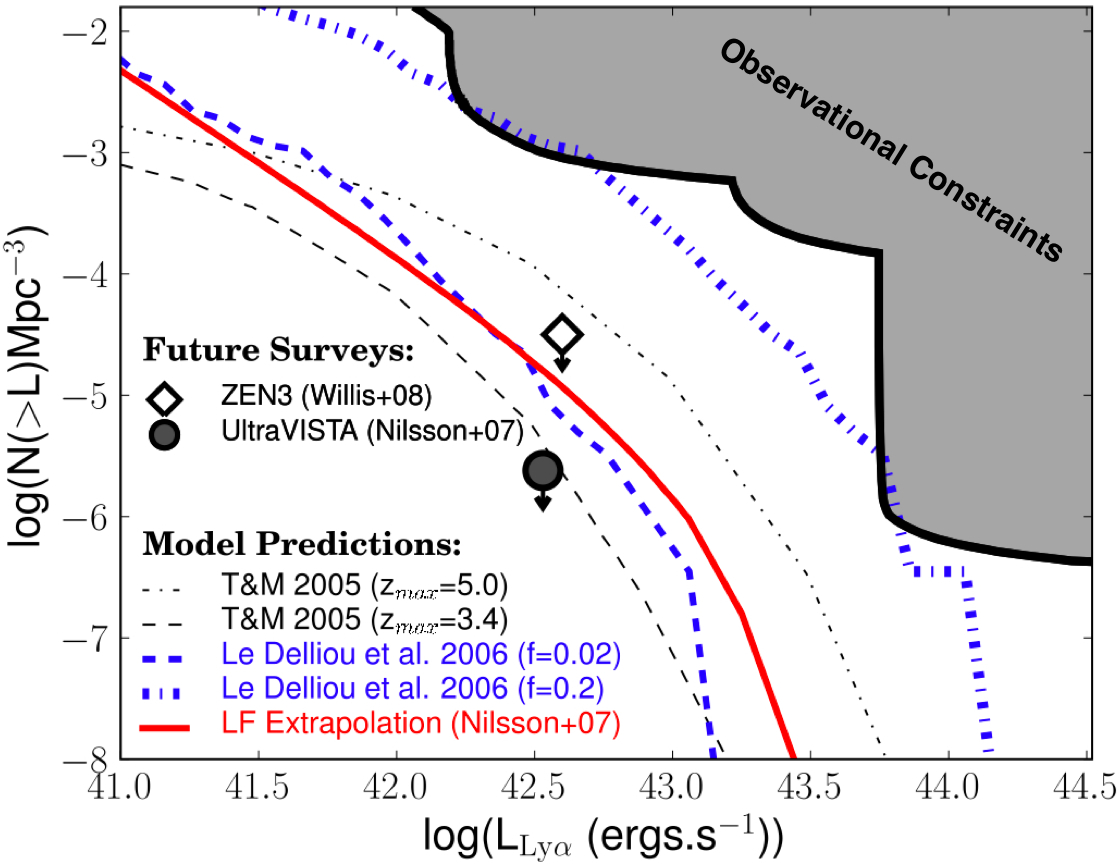
The right panel of Figure 1 presents predictions from galform (Le Delliou et al., 2006), the observational luminosity function extrapolation from Nilsson et al. (2007) and updated phenomenological predictions (Thommes & Meisenheimer, 2005) assuming peak redshifts of and . While most predictions are consistent with the current limits, galform models with high escape fractions are marginally rejected both at faint and bright levels. Earlier phenomenological models (e.g. the model of Thommes & Meisenheimer, 2005, not shown in Figure 1) are also clearly rejected by our results.
4 High-redshift Ly searches and cool galactic stars
It has become widely realised in recent years that broad-band searches for galaxies using the Lyman-break technique may suffer from significant contamination by cool Galactic L, T, and possibly Y-dwarf stars (e.g. McLure et al., 2006). These low-mass brown dwarfs display extremely red colours reaching as high as (e.g. Burningham et al., 2008), coupled with relatively flat colours. Such colours can mimic very closely those expected of a star forming galaxy with a strong Lyman-break.
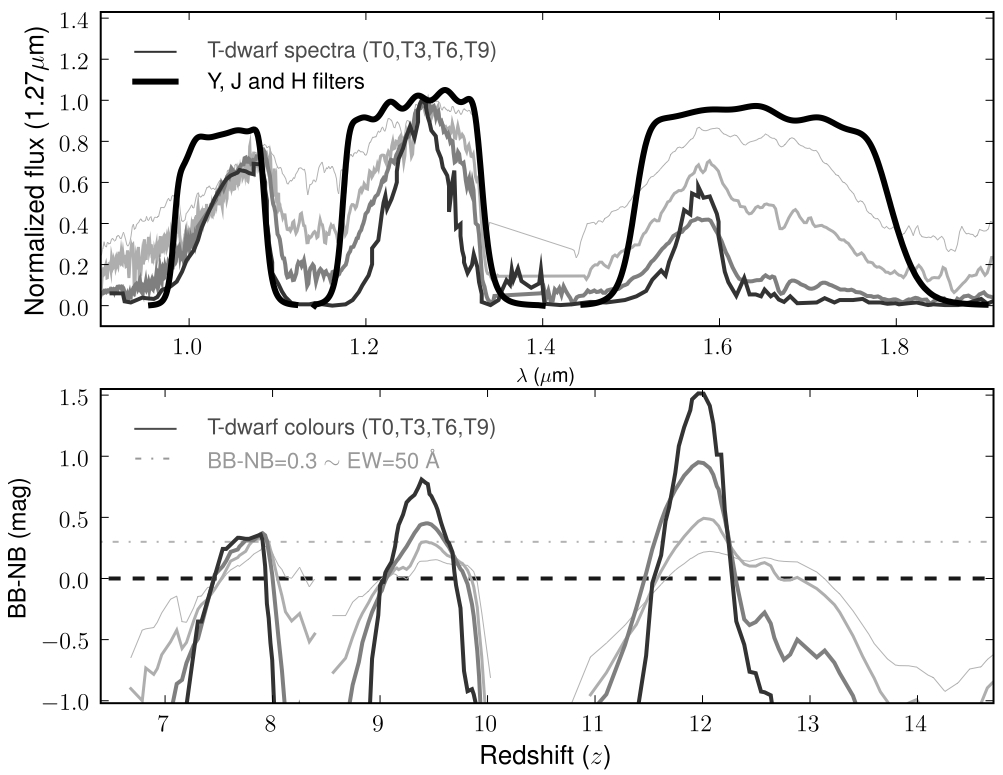
Since the near-infrared continuum spectra of low mass brown dwarfs show considerable structure due to broad molecular absorption features (especially methane and ammonia; e.g. Leggett et al., 2007), as shown in the top panel of Figure 2, they can easily produce a positive broad-band minus narrow-band (BB-NB) colour (see lower panel of Figure 2) if the narrow-band filter is located within one of the spectral peaks (this is much less of an issue for surveys which difference two closely-located narrow-band filters). Ly narrow-band surveys in the redshift ranges , and are therefore prone to contamination by cool Galactic stars – this includes the and atmospheric windows for narrow-band searches of Ly emitters. Narrow-band surveys at redshifts , or between – which include both HiZELS () and the narrow-band component of the UltraVISTA Survey (; e.g. Nilsson et al 2007) – will not only be free of such contamination, but can potentially select very cool T-dwarf stars via a narrow-band deficit (due to the strong methane absorption feature at these wavelengths). Indeed, motivated by such finding, a T-dwarf search was conducted among narrow-band deficit sources from Sobral et al. (2009a). The results show that all those sources are galaxies with , probably placing the H and [Oiii] emission lines just outside the narrow-band coverage, but contributing significantly to the measured flux, which results in the observed narrow-band deficits. No T-dwarf candidate was found.
5 Summary
-
•
Deep narrow-band imaging in the band (m) has been used to search for bright Ly emitters at over an area of 1.4 deg2. No Ly emitter was found brighter than erg s-1.
-
•
The Ly luminosity function constraints at have been significantly improved for erg s-1 and combined with constraints from deeper but much smaller previous surveys. The results rule out significant positive evolution of the Ly LF beyond ; they are in line with recent semi-analytic & phenomenological model predictions, rejecting some extreme models.
-
•
It has been shown that for narrow-band searches, T-dwarfs can mimic Ly emitters at , and ; they will not contaminate the future UltraVISTA narrow-band survey (and can even be identified via a narrow-band deficit), but they may contaminate narrow-band Ly searches within the and atmospheric windows.
These results show that bright erg s-1 Ly emitters are extremelly rare. Although the area coverage is absolutely important, a depth+area combination is likely to be the best approach for gathering the first sample of these very high-redshift galaxies. In fact, that is the strategy of the narrow-band component of the UltraVISTA survey (c.f. Nilsson et al., 2007), using the VISTA telescope, which will map 0.9 deg2 of the COSMOS field to a planned 5 luminosity limit of erg s-1 and a surveyed volume of 5.41 Mpc3 (see right panel of Figure 1) at . This combination lies below all current predictions for the Ly LF and the survey is expected to detect 2-20 Ly emitters at . Furthermore, the continuation of HiZELS on UKIRT and the extension of the narrow-band survey to a wider area offers a complementary approach which might be able to detect one of the brightest Ly emitters at , perfectly suited for spectroscopic follow-up and potentially enabling the detailed studies which simply won’t be possible for much fainter emitters, even if they are detected.
References
- Baugh et al. (2005) Baugh C. M., Lacey C. G., Frenk C. S., Granato G. L., Silva L., et al. 2005, MNRAS, 356, 1191
- Bouwens et al. (2008) Bouwens R. J., Illingworth G. D., Franx M., Ford H., 2008, ApJ, 686, 230
- Bouwens et al. (2009) Bouwens et al. 2009, arXiv:0909.1803
- Burningham et al. (2008) Burningham et al. 2008, MNRAS, 391, 320
- Cuby et al. (2007) Cuby J.-G., Hibon P., Lidman C., Le Fèvre O., et al. 2007, AAP, 461, 911
- Garn et al. (2009) Garn T., Sobral D., Best P. N., Geach J. E., Smail I., et al. 2009, arXiv:0911.2511
- Geach et al. (2008) Geach J. E., Smail I., Best P. N., Kurk J., Casali M., Ivison R. J., Coppin K., 2008, MNRAS, 388, 1473
- Gronwall et al. (2007) Gronwall et al. 2007, ApJ, 667, 79
- Hibon et al. (2009) Hibon P., Cuby J., Willis J., Clément B., et al. 2009, arXiv:0907.3354
- Hu et al. (1998) Hu E. M., Cowie L. L., McMahon R. G., 1998, ApJL, 502, L99+
- Iye et al. (2006) Iye et al. 2006, Nature, 443, 186
- Kashikawa et al. (2006) Kashikawa et al. 2006, ApJ, 648, 7
- Lawrence et al. (2007) Lawrence et al. 2007, MNRAS, 379, 1599
- Le Delliou et al. (2006) Le Delliou M., Lacey C. G., Baugh C. M., Morris S. L., 2006, MNRAS, 365, 712
- Leggett et al. (2007) Leggett S. K., Marley M. S., Freedman R., Saumon D., et al.. 2007, ApJ, 667, 537
- McLure et al. (2009) McLure R. J., Dunlop J. S., Cirasuolo M., et al. 2009, arXiv:0909.2437
- McLure et al. (2006) McLure R. J., Jarvis M. J., Targett T. A., Dunlop J. S., Best P. N., 2006, MNRAS, 368, 1395
- McLure et al. (2006) McLure et al. 2006, MNRAS, 372, 357
- Nilsson et al. (2007) Nilsson K. K., Orsi A., Lacey C. G., Baugh C. M., Thommes E., 2007, A&A, 474, 385
- Oesch et al. (2009) Oesch et al. 2009, arXiv:0909.1806
- Orsi et al. (2008) Orsi A., Lacey C. G., Baugh C. M., Infante L., 2008, MNRAS, 391, 1589
- Ota et al. (2008) Ota et al. 2008, ApJ, 677, 12
- Ouchi et al. (2008) Ouchi et al. 2008, ApJS, 176, 301
- Richard et al. (2008) Richard J., Stark D. P., Ellis R. S., et al. 2008, ApJ, 685, 705
- Scoville et al. (2007) Scoville et al. 2007, APJS, 172, 1
- Shimasaku et al. (2006) Shimasaku et al. 2006, PASJ, 58, 313
- Sobral et al. (2009a) Sobral D., Best P. N., Geach J. E., Smail I., et al. 2009a, MNRAS, 398, 75
- Sobral et al. (2009b) Sobral D., Best P. N., Geach J. E., Smail I., et al. 2009b, MNRAS, 398, L68
- Steidel et al. (1996) Steidel C. C., Giavalisco M., Pettini M., Dickinson M., Adelberger K. L., 1996, ApJL, 462, L17+
- Tanvir et al. (2009) Tanvir et al. 2009, Nature, 461, 1254
- Thommes & Meisenheimer (2005) Thommes E., Meisenheimer K., 2005, A&A, 430, 877
- Willis & Courbin (2005) Willis J. P., Courbin F., 2005, MNRAS, 357, 1348
- Willis et al. (2008) Willis J. P., Courbin F., Kneib J.-P., Minniti D., 2008, MNRAS, 384, 1039