Present address: ]Materials and Life Science Division, J-PARC Center, Japan Atomic Energy Agency, 2-4 Shirakata-Shirane, Tokai-mura, Naka-Gun, Ibaraki 319-1195, Japan
Bubble-bubble interaction: A potential source of cavitation noise
Abstract
The interaction between microbubbles through pressure pulses has been studied to show that it can be a source of cavitation noise. A recent report demonstrated that the acoustic noise generated by a shrimp originates from the collapse of a cavitation bubble produced when the shrimp closes its snapper claw. The recorded acoustic signal contains a broadband noise that consists of positive and negative pulses, but a theoretical model for single bubbles fails to reproduce the negative ones. Using a nonlinear multibubble model we have shown here that the negative pulses can be explained by considering the interaction of microbubbles formed after the cavitation bubble has collapsed and fragmented: Positive pulses produced at the collapse of the microbubbles hit and impulsively compress neighboring microbubbles to generate reflected pulses whose amplitudes are negative. Discussing the details of the noise generation process, we have found that no negative pulses are generated if the internal pressure of the reflecting bubble is very high when hit by a positive pulse.
pacs:
47.55.dp; 47.55.ddI Introduction
In a recent paper, Versluis et al. reported that the snapping shrimp (Alpheus heterochaelis) living in the ocean can generate a cavitation bubble by rapidly closing its large snapper claw ref1 . The rapid closure produces a negative pressure in seawater, by which cavitation nuclei (e.g., air microbubbles) are explosively expanded to a radius of a few millimeters. The cavitation bubble then collapses violently and emits a loud acoustic noise. The experimentally recorded acoustic signal presented in Ref. ref1 consists of a strong (positive) pressure pulse, clearly produced at the bubble collapse, and a subsequent broadband noise ref16 . A single-bubble theoretical model (the Keller-Miksis equation) succeeded to reproduce the strong pressure pulse (and a weak precursor signal) but failed to describe the broadband noise. Versluis et al. stated that the broadband noise is, partly, due to the reflection of the pressure pulse at nearby aquarium walls. However, the broadband noise begins earlier than the reflected wave reaches, immediately after the bubble collapse.
The broadband noise appears to consist of both positive and negative pressure pulses (or steep spikes) whose amplitudes are smaller than the first strong pulse. As demonstrated in Ref. ref1 and shown below, however, the single-bubble model cannot describe negative pulses. A key to resolving this inconsistency is given from an image recording of the cavitation bubble. In a series of high-speed images, it was found that at collapse the single cavitation bubble breaks apart through the surface instability and then an opaque cloud of microbubbles appears ref1 . The bubble cloud seems to grow and finally dissolve away.
We hypothesize that the interaction between the microbubbles through pressure pulses is a source of the negative pulses involved in the broadband noise. It is known that bubbles undergoing volume change interact with each other through the pressure waves that they emit. Bubble-bubble interaction of this type leads to a variety of phenomena, including attraction/repulsion between bubbles ref2 ; ref3 ; ref4 ; refRefadd7 ; ref5 ; ref6 , filamentary structure formation refRefadd8 , change of eigenfrequencies ref7 , superresonances refRefadd9 , emergence of transition frequencies ref6 ; ref8 , avoided crossing of resonance frequencies ref9 , sound localization ref10 , and suppression of cavitation inception ref11 ; ref12 . Because at generation the microbubbles are highly compressed, they must begin volume change (as observed) and emit pressure pulses at their collapse. Taking the bubble-bubble interaction through the pressure pulses into consideration, in this paper we suggest a possible origin of the negative pulses. Here we do not aim at providing a quantitative explanation because the actual sizes and number density of the microbubbles are now unknown. We instead attempt to elucidate the basic mechanism of negative pulse generation, reducing the problem to the interaction of only two bubbles.
The rest of this paper is organized as follows: In Sec. II, the model equations and assumptions used in this study are introduced. Section III presents numerical and theoretical results and discussions on the pressure pulses emitted by interacting bubbles, and Sec. IV summarizes the obtained results.
II Model equations
The theoretical model used in this study is the coupled Keller-Miksis equations ref4 ; ref12 , which describe the radial motion of two coupled spherical bubbles in a compressible liquid:
| (1) |
| (2) |
where is the instantaneous radius of bubble , is the center-to-center distance between bubbles and , and the overdots denote the time derivative . The surrounding liquid is assumed to be water with density kg/m3, viscosity kg/(m s), sound speed m/s, and surface tension N/m. The far-field pressure is assumed to be constant in time and equal to the atmospheric pressure, MPa. The gas in the bubbles is assumed to be a van der Waals gas (air) and the pressure inside bubble ( is determined by
| (3) |
where is the ambient radius and is the hard-core radius ( for air ref13 ). The polytropic exponent of the gas, , is assumed to be equal to its specific heat ratio (1.4 for air) because our interest is in the pressure pulses emitted at bubble collapse, where the bubble behavior is nearly adiabatic. We confirmed numerically that even when the heat exchange between the bubbles and water is taken into account by, e.g., a switching method for refRefadd1 , results are essentially the same as those shown below. The vapor pressure is neglected for simplicity. We do not consider mass exchange (i.e., evaporation/condensation, mass diffusion) and chemical reactions, which may occur inside the bubbles ref14 , since they are not essential for sound emission: As demonstrated in earlier work on single bubbles refRefadd2 ; refRefadd3 , models that do not take mass exchange and chemical reactions into account can describe bubble emitted pressure waves with sufficient accuracy.
The last term of Eq. (II) describes the bubble-bubble interaction through the bubble emitted pressure waves and acts as a driving force on bubble . This term was derived from the following simple formula, which corresponds to an equation for the pressure wave emitted by a pulsating sphere,
| (4) |
where is the distance measured from the center of bubble . This pressure equation can be given from the continuity and Euler equations of fluid flow (see, e.g., Refs. ref4 ; ref12 ), and is in the following used to examine the acoustic signal from the bubbles. Time-delay effects refRefadd4 due to the finite sound speed of water are neglected, but a remark will be made on a consequence of it. As a first approximation we neglect the translational motion of bubbles due to the secondary Bjerknes force (an interaction force proportional to refRefadd6 , that is, assuming . Hence, we set to be much larger than ( and consider only the first few periods of bubble oscillation, in which the translational velocity should be very small. As demonstrated below, the first one or two periods are sufficient for our discussion.
III Results and discussions
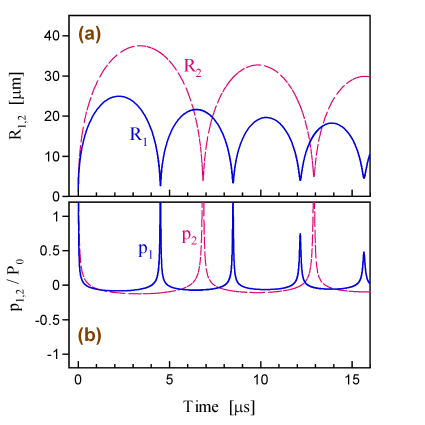
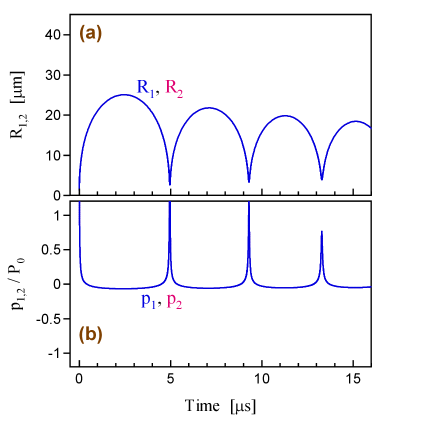
First we consider a single-bubble case to confirm that single bubbles can emit positive pulses only. The radius-time curves for two different bubbles of m, m with are shown in Fig. 1(a). Here, we set the initial condition as and in order to simulate the highly compressed state of the microbubbles at their generation. Due to the high internal pressure, the bubbles undergo rapid expansion and reach a maximum size of about . Then they collapse and rebound many times. The oscillation amplitudes decrease monotonically in time due to the viscosity and compressibility of water. The pressure waves from the bubbles measured at are shown in Fig. 1(b). From this, one knows that the single bubbles can emit positive pulses only. Between the positive pulses, one finds low-amplitude negative pressures, which resulted from a weak deceleration of the bubble surface acting when . Their amplitudes (and also fundamental frequencies) are, however, obviously much lower than those of the positive pulses and hence they are incapable of explaining the negative pulses in the acoustic signal. The positive pulses are produced at the bubble collapse where the bubble surface is strongly accelerated [i.e., in Eq. (4) has a very large value]. However, from Eq. (4) one finds that to produce a negative pulse the bubble surface needs to be strongly decelerated: this may be impossible when only single bubbles are considered.
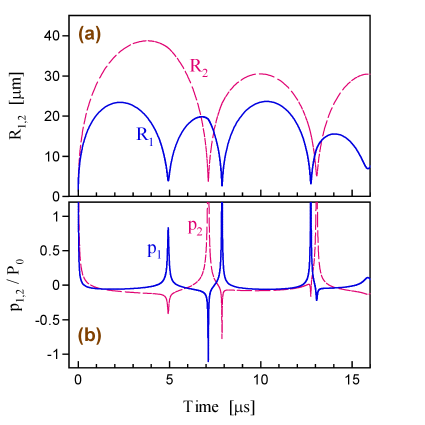
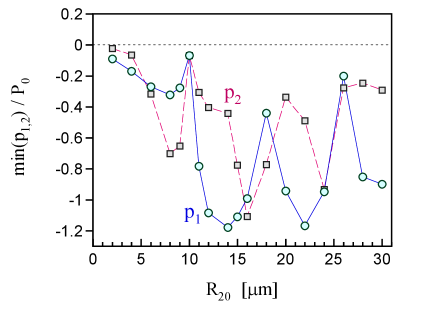
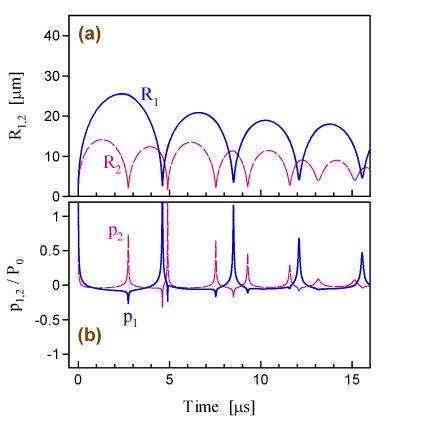
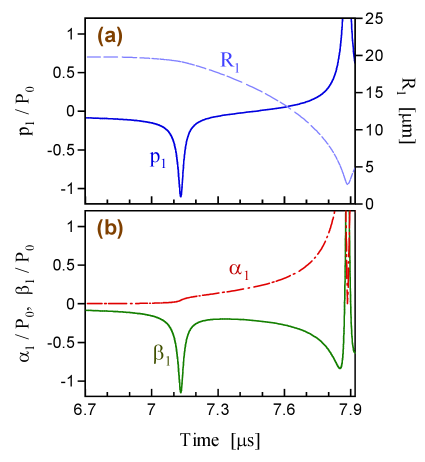
This difficulty is resolved by considering bubble-bubble interaction. As well known, when a pressure wave propagating in water hits the water-air interface, most of its energy is reflected and a reflected wave is produced whose phase is opposite to the incident wave. This is because air’s acoustic impedance is much smaller than water’s. It is also known that negative pressure waves generated when strong positive pulses from collapsing bubbles hit a water-air interface can be strong enough to cause secondary cavitation refRefadd10 . Since the surface of gas bubbles considered here is also a free surface, it would be able to produce negative pulses. In Fig. 2, we show a result for a double-bubble case. Here, we used the same parameters as in the above example except for . In this case, the change of oscillation amplitude is non-monotonic because of the modulation effect due to bubble-bubble interaction. In the bubble emitted pressures presented in Fig. 2(b), in contrast to the single-bubble case, not only positive pulses but also negative pulses appear. In order to confirm the robustness of this observation, we performed a parametric study. The result is presented in Fig. 3, where the maximum amplitudes of the negative pulses for m and are shown as functions of . This proves that strong negative pulses are emitted in most cases. From this figure it is also found that the maximum amplitudes have a complicated dependence on the ambient radius. The radius-time and pressure-time curves for m and m are shown in Figs. 4 and 5, respectively. For m, negative pulses are found but their amplitudes are very low. For m (i.e., , no negative pulses are found, implying that systems of identical bubbles do not emit negative pulses.
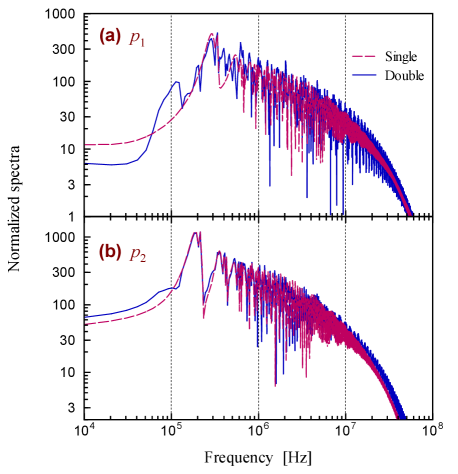
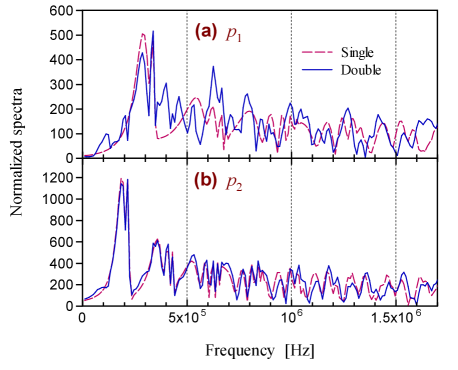
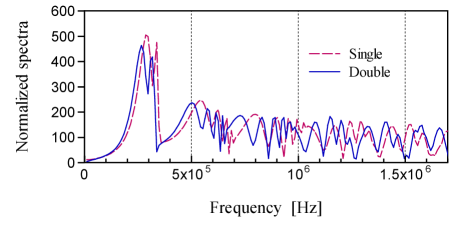
The frequency spectra for m and m taken from and in Figs. 1(b) and 2(b) are shown in Fig. 6. All of the presented spectra show a broad distribution. The peak frequencies in the single-bubble case are 0.287 MHz for and 0.185 MHz for , which are roughly the same as the repetition rates of the positive pulses deduced from Fig. 1(b) (about 0.27 MHz and 0.17 MHz, respectively). We found several qualitative differences between the spectra in the single- and double-bubble cases. One of the differences is clearly seen in Fig. 7, which shows the spectra in a frequency range around the peak frequencies. The spectrum of in the double-bubble case has a more complex structure than that in the single-bubble case, particularly in a frequency range between 0.1 MHz and 1 MHz: A number of characteristic peaks are added and the spectrum structure becomes much denser through the bubble-bubble interaction. Compared to , the change in the spectrum of is small: No qualitative differences are found between in the single- and double-bubble cases. This suggests that the larger bubble (bubble 2) has a more significant influence on the neighboring bubble and the dynamics of the neighboring smaller bubble (bubble 1) is thus changed more drastically (the same tendency is found also in systems of linearly oscillating bubbles in a sinusoidal sound field ref6 ). When m, the difference between the spectra in the single- and double-bubble cases is very small, as can be expected from the above observation that only positive pulses are emitted for ; see Fig. 8. The peak frequency is decreased by bubble-bubble interaction, which appears to be consistent with the fact that the natural frequency of identical bubbles oscillating in phase each other is lower than that of the individual bubbles ref7 ; ref8 ; refRefadd11 .
Let us consider how the negative pulses were produced. As can be seen in Fig. 2(b), the negative pulses from a bubble coincide with the positive pulses emitted by the other bubble at its collapse. This observation tells us that the negative pulses are produced when the positive pulses hit the surface of the neighboring bubble. Shown in Fig. 9 is a close-up view of and in Fig. 2 around the time ( s) of the first negative pulse from bubble 1. The figure also shows the inertia and acceleration portions of , that is,
| (5) |
and
| (6) |
One can see that the surface of bubble 1 is strongly decelerated in the period when it emits the negative pulse, though no noticeable disturbance is seen in because the duration of the deceleration is very short. This strong deceleration is clearly caused by the strong positive pulse from bubble 2, which impulsively compresses bubble 1. Deceleration is also observed in a following period where the bubble is shrinking, but no negative pressure is found because a large inertia ( cancels the effect from the deceleration (.
In order to more deeply understand the mechanism of negative pulse generation, we perform theoretical studies based on the coupled Keller-Miksis equations. First, we consider the relation between the amplitudes of the incident and reflected pulses. If (i.e., ) and at the time of collapse of bubble 2, where has a very large value, only the acceleration terms in Eq. (II) may be significant for bubble 1 and the remaining terms are thus negligible. Hence, the equation and also Eq. (4) are reduced to
| (7) |
| (8) |
In Eq. (7), is an acoustic Reynolds number defined here as
| (9) |
Since is much larger than unity ( for m, a typical minimum radius at collapse), Eq. (7) is further reduced to
| (10) |
If one measures and at the same distance from the corresponding bubbles (i.e., , Eq. (10) is rewritten using Eq. (8) as
| (11) |
Equation (10) proves that has the opposite sign from that of , that is, the surface of bubble 1 is strongly decelerated at the moment when bubble 2 collapses, where the surface of bubble 2 is strongly accelerated due to its high internal pressure. From Eq. (11), one finds that the ratio between and is simply determined by , and that the amplitude of the negative reflected pulse is large if is large when the pressure pulse from bubble 2 hits bubble 1. The numerical result shown in Fig. 2(b) gives and for the first negative pulse from bubble 1 (at s), and and for the second negative pulse from bubble 2 ( s), both of which reveals a reasonable agreement. However, Eq. (11) gives a less accurate result for the first negative pulse from bubble 2 ( s): but . This may be because and are not large enough to fully satisfy the assumptions used in deriving Eq. (10).
Next, we consider what occurs when . As shown in Fig. 5, no negative pulses are emitted for m, although strong positive pulses are emitted which definitely hit the neighboring bubble. Here we attempt to explain this observation. For and , at the final stage of bubble collapse where and are very large and , Eq. (II) may be reduced to
| (12) |
where we neglected the surface-tension and viscous forces and since their magnitudes should be much smaller than the internal pressure . Since ( for m at the first collapse) is much smaller than (, Eq. (12) is further reduced to
| (13) |
From this we have
| (14) |
This says that is positive at the bubble collapse and hence the bubbles emit positive pulses. This conclusion is consistent with the above numerical finding and is not altered even if is considered.
This result comes from the fact that, in the considered case where the bubbles collapse at the same time, the sound pressure from the neighboring bubble cannot exceed the bubbles’ internal pressure . The sound pressure generated by bubble 2, whose internal pressure is , must be smaller than when it is measured at the position of bubble 1, because the bubbles are separated by a finite distance . Since the internal pressure of bubble 1 is also , it is not exceeded by the sound pressure, and the right-hand side of Eq. (13) is thus positive: in other words, bubble 1 emits a strong positive pulse, resulting from the high internal pressure, whose absolute amplitude is greater than that of the negative reflected pulse. This finding suggests that the bubble surface, a free surface, does not always produce negative reflected pulses and the characteristics of the reflected waves depend on the state of the gas in the bubbles. The negative pulses found in Figs. 2(b) and 4(b) are produced because the positive pulses hit the neighboring bubble when its internal pressure is not high.
IV Summary
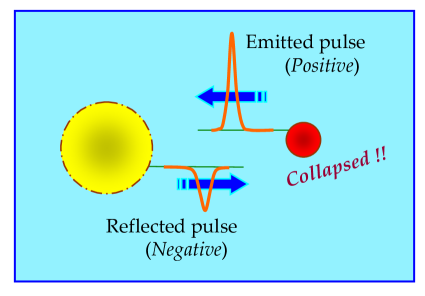
We have studied the interaction of microbubbles through pressure pulses to suggest a possible origin of the negative pulses found in broadband cavitation noise. The proposed scenario of noise generation is summarized as follows: When a large cavitation bubble collapses and fragments, a number of microbubbles are formed ref1 . The microbubbles expand rapidly and then collapse to emit positive pressure pulses (the right half of Fig. 10). The positive pulses hit and impulsively compress neighboring bubbles to cause a brief but strong deceleration of the bubble surface. This deceleration, which creates a strong tension in the surrounding liquid, produces negative reflected pulses (the left half of Fig. 10), and then a signal consisting of positive and negative pulses is generated. If the time-delay effect is considered, the positive and associated negative pulses are measured with a time interval determined by the relative position of the bubbles and the sound speed or shock-wave velocity of water (which can highly increase in the vicinity of collapsing bubbles refRefadd2 ; refRefadd5 ). Spectral analysis has revealed that the frequency spectrum of the cavitation noise, particularly from the smaller bubble in a double-bubble system, becomes much more complicated and denser by bubble-bubble interaction. Though only a few negative pulses were observed in the double-bubble cases studied here, considering a larger number of bubbles and multiple scattering of sound may allow us to explain the large number of pressure pulses found in the recorded broadband noise.
Discussing further details of the noise generation process, we have revealed that the amplitudes of the negative reflected pulses depend on the instantaneous radius and the state of the internal gas of the reflecting bubble. Interestingly, no negative pulses are generated when a system of identical bubbles is considered. This is because the positive pulse from a bubble hits the neighboring bubble just when it collapses, at which moment the bubble’s internal pressure is higher than the pressure of the incident positive pulse. This observation suggests that the surface of gas bubbles, a free surface, does not always produce a negative reflected pulse, and also that negative pulses cannot be described by theoretical models that consider only systems of identical bubbles. The presented findings would be useful to understand not only the shrimp emitted acoustic signal but also other types of cavitation noise found, e.g., in fluid machinery ref18 and medical applications ref19 .
Acknowledgements.
This work was partly supported by the Ministry of Education, Culture, Sports, Science, and Technology of Japan through a Grant-in-Aid for Young Scientists (B) (No. 20760122) and by the Japan Society for the Promotion of Science through a Grant-in-Aid for Scientific Research (B) (No. 20360090).References
- (1) M. Versluis, B. Schmitz, A. von der Heydt, and D. Lohse, Science 289, 2114 (2000).
- (2) Similar acoustic signals from cavitation bubbles can be found also in different fields; see, e.g., Ref. ref18 .
- (3) S. Kumar and C. E. Brennen, J. Fluid Mech. 255, 541 (1993); C. E. Brennen, Cavitation and Bubble Dynamics (Oxford University Press, New York, 1995).
- (4) V. F. K. Bjerknes, Fields of Force (Columbia University Press, New York, 1906).
- (5) E. A. Zabolotskaya, Sov. Phys. Acoust. 30, 365 (1984).
- (6) R. Mettin, I. Akhatov, U. Parlitz, C. D. Ohl, and W. Lauterborn, Phys. Rev. E 56, 2924 (1997).
- (7) A. A. Doinikov, J. Acoust. Soc. Am. 111, 1602 (2002).
- (8) M. Ida, Phys. Rev. E 67, 056617 (2003).
- (9) M. Ida, Phys. Fluids 17, 097107 (2005).
- (10) I. Akhatov, U. Parlitz, and W. Lauterborn, Phys. Rev. E 54, 4990 (1996).
- (11) A. Shima, Trans. ASME, J. Basic Eng. 93, 426 (1971).
- (12) I. Tolstoy, J. Acoust. Soc. Am. 80, 282 (1986); C. Feuillade, J. Acoust. Soc. Am. 98, 1178 (1995).
- (13) M. Ida, Phys. Lett. A 297, 210 (2002); M. Ida, J. Phys. Soc. Jpn. 71, 1214 (2002).
- (14) M. Ida, Phys. Rev. E 72, 036306 (2005).
- (15) Z. Ye and A. Alvarez, Phys. Rev. Lett. 80, 3503 (1998); M. Kafesaki, R. S. Penciu, and E. N. Economou, Phys. Rev. Lett. 84, 6050 (2000).
- (16) M. Ida, T. Naoe, and M. Futakawa, Phys. Rev. E 75, 046304 (2007).
- (17) M. Ida, T. Naoe, and M. Futakawa, Phys. Rev. E 76, 046309 (2007).
- (18) R. Löfstedt, B. P. Barber, and S. J. Putterman, Phys. Fluids A 5, 2911 (1993).
- (19) W. C. Moss, J. L. Levatin, and A. J. Szeri, Proc. R. Soc. London, Ser. A 456, 2983 (2000).
- (20) S. Fujikawa and T. Akamatsu, J. Fluid Mech. 97, 481 (1980); Y. Matsumoto and F. Takemura, JSME Int. J. Series B 37B, 288 (1994); K. Yasui, Phys. Rev. E 56, 6750 (1997); B. D. Storey and A. J. Szeri, Proc. R. Soc. Lond. A 456, 1685 (2000); R. Toegel and D. Lohse, J. Chem. Phys. 118, 1863 (2003).
- (21) J. Holzfuss, M. Rüggeberg, and A. Billo, Phys. Rev. Lett. 81, 5434 (1998).
- (22) S. W. Karng, Y. P. Lee, K.-Y. Kim, and H.-Y. Kwak, J. Korean Phys. Soc. 43, 135 (2003).
- (23) S. Fujikawa and H. Takahira, Acustica 61, 188 (1986); A. A. Doinikov, R. Manasseh, and A. Ooi, J. Acoust. Soc. Am. 117, 47 (2005).
- (24) A. A. Doinikov, Phys. Rev. E 64, 026301 (2001); N. A. Pelekasis, A. Gaki, A. Doinikov, and J. A. Tsamopoulos, J. Fluid Mech. 500, 313 (2004) and references therein.
- (25) Y. Tomita, T. Kodama, and A. Shima, Appl. Phys. Lett. 59, 274 (1991); D. Obreschkow et al., Phys. Rev. Lett. 97, 094502 (2006); E. Robert et al., Phys. Fluids 19, 067106 (2007).
- (26) S. T. Zavtrak, Sov. Phys. Acoust. 33, 145 (1987).
- (27) R. Pecha and B. Gompf, Phys. Rev. Lett. 84, 1328 (2000).
- (28) J.-L. Mestas et al., Proc. IEEE Ultrason. Symp. 3, 1816 (2004); Y. Liu et al., J. Acoust. Soc. Am. 118, 3328 (2005); Y. Liu et al., J. Acoust. Soc. Am. 120, 492 (2006).