M. Kawaharada et al.Constraints on Soft and Hard Excess Emission of Abell 2199 \Received2009/07/09\Accepted2009/11/26
galaxies: clusters: individual (Abell 2199) — X-rays: galaxies: clus ters
Suzaku Constraints on the Soft and Hard Excess Emissions from Abell 2199
Abstract
The nearby () cluster of galaxies Abell 2199 was observed by Suzaku in X-rays, with five pointings for ks each. From the XIS data, the temperature and metal abundance profiles were derived out to kpc (0.4 times virial radius). Both these quantities decrease gradually from the center to peripheries by a factor of , while the oxygen abundance tends to be flat. The temperature within ( kpc) is keV, and the 0.5–10 keV X-ray luminosity integrated up to is erg s-1, in agreement with previous XMM-Newton measurements. Above this thermal emission, no significant excess was found either in the XIS range below keV, or in the HXD-PIN range above keV. The 90%-confidence upper limit on the emission measure of an assumed 0.2 keV warm gas is (3.7–7.5) cm-3 arcmin-2, which is 3.7–7.6 times tighter than the detection reported with XMM-Newton. The 90%-confidence upper limit on the 20–80 keV luminosity of any power law component is erg s-1, assuming a photon index of 2.0. Although this upper limit does not reject the possible 2.1 detection by the BeppoSAX PDS, it is a factor of 2.1 tighter than that of the PDS if both are considered upper limits. The non-detection of the hard excess can be reconciled with the upper limit on diffuse radio emission, without invoking the very low magnetic fields (G) which were suggested previously.
1 Introduction
The intra-cluster medium (ICM) in clusters of galaxies, i.e, hot thermal plasmas in collisional ionization equlibria confined within their gravitational potential, constitutes the most dominant form of cosmic baryons that has ever been detected. Although the ICM radiates predominantly optically-thin thermal X-ray emission, some clusters have been reported to exhibit excess signals above the thermal emission at the lowest or highest energy ends of their X-ray spectra. One interpretation of the soft excess is emission from Warm Hot Intergalactic Medium (WHIM), which has been predicted from cosmological simulations (e.g. [Cen & Ostriker (1999)]) and is expected to solve the so-called missing baryon problem (e.g [Fukugita et al. (1998)]). Another interpretation of the spectral soft and/or hard excess is non-thermal emission from accelerated particles in galaxy clusters (e.g. [Lieu et al. (1999)]; [Fusco-Femiano et al. (1999)]): a power-low shaped spectrum can exceed the dominant thermal emission at both sufficiently high and low energies. This provides a possibility that galaxy clusters are giant accelerators in the universe. Thus, the search for soft and hard excess signals in clusters forms a very important research subject. However, the instrumental sensitivity in these photon energies has been insufficient, and hence the existence of these excess components has remained controversial (e.g. [Bregman & Lloyd-Davies (2006)]; [Nevalainen et al. (2007)]; [Rossetti & Molendi (2004)]; [Fusco-Femiano et al. (2007)]).
Among those galaxy clusters from which the excess emission has been reported, Abell 2199 is particularly interesting, because it has been suspected to exhibit both the soft and hard excess components. In fact, Kaastra et al. (1999) reported the detection of both, based on the BeppoSAX, Extreme Ultraviolet Explorer, and ROSAT observations. The two excess components were simultaneously expressed by a single power law with a photon index which is superposed on the thermal emission spectrum, and interpreted as inverse Compton (IC) photons produced when the cosmic microwave background (CMB) photons are scattered up by relativistic electrons in the cluster. However, as argued by Kempner & Sarazin (2000), the magnetic field in Abell 2199 would have to be unusually weak (G) in order for the relativistic electrons not to produce synchrotron emission beyond measured upper limits of diffuse radio emission. As an alternative interpretation, Kempner & Sarazin (2000) proposed non-thermal bremsstrahlung by supra-thermal electrons which are being accelerated in the cluster.
In the era of XMM-Newton, the possibility of thermal emission from a warm gas also became another popular idea to explain the soft excess in several clusters. Kaastra et al. (2004) reported a redshifted O VII emission line from a 0.2 keV warm gas in Abell 2199, along with Coma, Abell 1795, Sersic 159-03, MKW 3s, Abell 2052, and Abell 3112, and hence ascribed their soft excess to emission from WHIM. At the same time, Chandra has made progress on the ICM physics of Abell 2199 especially in the central region, such as an asymmetric temperature distribution in the direction perpendicular to the jets within of the center (Kawano et al. 2003), and a weak isothermal shock associated with the central active galactic nucleus (Sanders & Fabian 2006).
In order to examine the soft and hard excess phenomena of Abell 2199 with a better sensitivity, we observed the object with Suzaku (Mitsuda et al. (2007)). The excellent low-energy capability of XIS-BI (back illuminated CCD, Koyama et al. (2007)) and the low background of the silicon PIN detectors in the HXD (Takahashi et al. (2007); Kokubun et al. (2007)) have provided the best data in the soft and hard X-ray bands, respectively. As a result, we have obtained tight upper limits on both excess components, and strengthened the dominance of the thermal emission from this cluster.
In the present paper, quantities quoted from the literature are rescaled to the Hubble constant of , and errors are given at 90 % confidence range unless otherwise stated.
2 Observation and Data Preparation
2.1 Observation
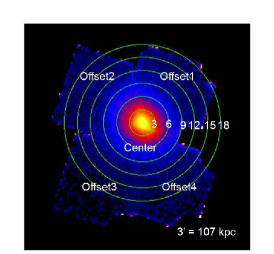
As shown in figure 1 and table 1, we observed Abell 2199 with Suzaku in the beginning of October 2006. The observation was conducted in 5 separate pointings (“Center” and “Offset1” through “Offset4”), for ks each, with the XIS field of view (FOV) partially overlapping. Throughout the 5 pointings, all the XIS sensors were in normal clock mode without window or burst options. These observations became one of the first ones in which spaced-row charge injection (SCI) was applied to the XIS detectors (Nakajima et al. 2008). In the present paper, we use data of XIS0, XIS1, XIS3 and the HXD-PIN. Although XIS2 was still operational, we do not use its data because a database of non X-ray background (NXB) for SCI-ON XIS2 is too small, which is available only until the anomaly in XIS 2 on 2009 November 9111http://www.astro.isas.ac.jp/suzaku/doc/suzakumemo-2007-08.pdf.
Between the Offset2 and Offset4 observations, operations of changing the HXD-PIN bias voltage were carried out in response to flare-like events in a PIN diode222http://www.astro.isas.jaxa.jp/suzaku/log/hxd/ (W10P0). As summarized in table 2, data of all the 64 PINs were available throughout the Center and Offset1 pointings, and for a part of Offset2 and Offset4. In contrast, only one fourth of the PIN diodes were operational in Offset3. Therefore, we do not analyze the Offset3 HXD-PIN data in the present paper. For the other observations, we exclude the data of the four PIN diodes in W10 unit, and use the remaining 60 channels. Backgrounds and responses excluding the four PIN diodes were prepared with a help of the HXD team.
2.2 XIS data reduction
The present paper utilizes the XIS and HXD-PIN data, prepared through
version 2.0 pipe-line data processing, and obtained from the Suzaku
ftp site333ftp://ftp.darts.isas.jaxa.jp/pub/suzaku/ver2.0/.
We re-processed unscreened XIS
event files using Suzaku software version 11 in HEAsoft 6.6,
together with the calibration datebase (CALDB) released on 2009 January
9. We applied xiscoord, xisputpixelquality,
xispi, and xistime in this order, and performed the standard
event screening. Bad pixels were rejected with cleansis,
employing the option of chipcol=SEGMENT.
We selected events with GRADE 0,2,3,4, and 6. Good time intervals (GTI)
were detemined by criteria as
"SAA_HXD==0 && T_SAA_HXD>436 && COR>6 && ELV>5 && DYE_ELV>20 && AOCU_HK_CNT3_NML_P==1 && Sn_DTRATE<3 && ANG_DIST<1.5". Details of the processing and
screening are the same as those described in the Suzaku Data Reduction Guide.444http://ftools.gsfc.nasa.gov/docs/suzaku/analysis/abc/
The redistribution matrix files (RMFs) of the XIS were produced by
xisrmfgen, and auxillary responce files (ARFs)
by xissimarfgen (Ishisaki et al. (2007)).
As an input to the ARF generator, we prepared an X-ray surface brightness
profile of Abell 2199 using a double- model (sum of two models; King (1962))
of which the parameters were determined through a least chi-square fit to
the background subtracted and vignetting corrected
0.5–10 keV XMM-Newton MOS1 image of the Abell 2199 cluster.
The employed parameters are
(, )( kpc, ) for the narrower component
and ( kpc, ) for the wider component,
where is the core radius.
Absorption below 2 keV, caused by a carbon-dominated contamination material on the XIS
optical blocking filters, is included in the ARFs.
There, differences of the contaminant thickness among the XIS sensors are taken into
account, along with its radial dependences and secular changes (Koyama et al. (2007)).
Non X-ray background (NXB) of each XIS sensor was created
using xisnxbgen,
which sorts spectra of night earth observations according to
the geomagnetic cut-off-rigidity (COR) and makes an averaged spectrum
weighted by residence times for which Suzaku stayed in each COR interval
(Tawa et al. (2008)).
We assumed systematic errors (90% confidence range) of 6.0% and 12.5%
for the NXB from XIS-FI (front illuminated CCD, Koyama et al. (2007)) and XIS-BI
(Tawa et al. (2008); table 5 (c)), respectively, and added them in quadrature to the
corrensponding statistical errors. The X-ray background was estimated as described
in subsection 3.1.
2.3 HXD-PIN data reduction
Unscreened event files of HXD-PIN were re-processed by
hxdtime, hxdpi, and hxdgrade in this order.
Using hxdgtigen, we rejected the time intervals when “FIFO Full”,
“BFSH”, or “TLMRJCT” happened, and further narrowed the
GTI by imposing criteria of "SAA_HXD==0 && T_SAA_HXD>500 && TN_SAA_HXD>180 && COR>6 && ELV>5 && AOCU_HK_CNT3_NML_P==1 && HXD_DTRATE<3 && ANG_DIST<1.5 && HXD_HV_Wn_CAL>700 && HXD_HV_Tn_CAL>700".
For the Center, Offset1, Offset2, and Offset4 pointings,
we made special HXD-PIN RMFs which exclude contributions of the four PINs
in W10 unit. This was constructed by summing RMFs from the remaining 60 PIN diodes.
Since hxdarfgen did not support extended sources yet,
we created PIN ARFs for each pixel by hxdarfgen,
assuming the same X-ray surface brightness as used
for XIS ARFs (subsection 2.2) .
The ARFs were then averaged by weighting with counts contained in the corresponding pixels.
As the HXD-PIN NXB, the “tuned” PIN NXB files published by the HXD team555http://www.astro.isas.jaxa.jp/suzaku/analysis/hxd/pinnxb/tuned/ were used (Fukazawa et al. (2009)). In the present paper, we used 2.3% as systematic error (90% confidence range) of the PIN NXB. Details of its derivation is described in Appendix A. The PIN CXB was estimated from an observation of a nearby region in the same manner as the XIS CXB (subsection 3.2).
3 Estimation of X-ray Backgrounds
3.1 XIS X-ray background
To analyze the XIS data of an extended object in general, we must subtract the Cosmic X-ray background (CXB) and Galactic foreground emission (GFE). Since the emission from Abell 2199 itself hampers their direct estimation using our own data, we used 73.6 ks Suzaku observation of a nearby blank sky region named “High Latitude Diffuse A” (Hereafter HLD; Observation ID = 500027010), which is away from Abell 2199. The difference of their Galactic latitudes is only , and hence the hydrogen column densities (Dickey & Lockman (1990), weighted average over cone radius) toward Abell 2199 ( cm-2) and HLD ( cm-2) are similar.
After applying the standard processing described in subsection 2.2 to the unscreened XIS data of HLD, we removed circular regions ( in radius) around six point sources that are visible in the 0.5–10.0 keV XIS images, and extracted spectra of the remaining region from the four XIS detectors. The corresponding detection limit for the point sources is erg s-1 cm-2 in 2–10 keV. Then, the NXB-subtracted XIS-BI and XIS-FI (averaged over the three XIS-FI detectors) spectra in energy ranges of 0.3–5.5 keV and 0.5–5.5 keV, respectively, were fitted simultaneously with a CXB+GFE model (see below) using XSPEC12 version 12.4.0ad, incorporating the XIS response for a source of uniform brightness. In the analyses described below, metal abundances refer to Anders & Grevesse (1989), and the photoelectric absorption cross-sections to Balucinska-Church & McCammon (1992) with a new He cross section (Yan et al. (1998)).
As the CXB model, we used a power law with a fixed photon index of 1.41 (Kushino et al. (2002)) and a free normalization. To represent the GFE, we employed model 1 of Henley & Shelton (2008), which consists of three apec components (Smith et al. (2001)): a non-absorbed 0.08 keV component, an absorbed 0.11 keV one, and an absorbed 0.27 keV one, representing the emission from Local bubble (LB), a cool halo, and a hot halo, respectively. The three apec temperatures were all fixed. The hydrogen column density was fixed to the Galatic value of cm-2, and the metal abundance and redshift were also fixed to one solar and zero, respectively. Relative normalizations of the two halo components were tied as cool halo : hot halo (Henley & Shelton (2008)). Thus, the GFE model has only two free parameters; normalizations of the LB and halo. As summarized in table 3, this CXB+GFE model reproduced the XIS spectra from HLD successfully. The 2.0–10.0 keV surface brightness of the CXB component is erg s-1 cm-2 sr-1 (90% statistical and systematic errors), where the systematic error, 10%, refers to Appendix 1 of Nakazawa et al. (2009). Using ASCA, Kushino et al. (2002) derived an absolute 2.0–10.0 keV CXB surface brightness to be erg s-1 cm-2 sr-1 (90% statistical and systematic errors). This value becomes – erg s-1 cm-2 sr-1 when the surface brightness is integrated to our detection limit of erg s-1 cm-2 (equation 6 of Kushino et al. (2002)). Thus, the CXB level obtained from the HLD observation is consistent with the ASCA result.
3.2 HXD-PIN X-ray background
We also analyzed the HXD-PIN data of the HLD observation which were processed by the same standard procedure as described in subsection 2.3. Ignoring the GFE which is negligible at keV, we fitted the NXB-subtracted – keV HXD-PIN spectrum with a wide-band CXB model. Namely, following the HEAO-1 result (Boldt (1987)), we expressed the CXB spectral surface brightness as
| (1) |
where , a normalization, is a free parameter in the fit. When reproducing the CXB signals in HXD-PIN, equation 1 was corrected for the 13% systematic difference of cross-normalization between the XIS and PIN666http://www.astro.isas.jaxa.jp/suzaku/doc/suzakumemo/suzakumemo-2007-11.pdf. The result we obtained, , is consistent with the HEAO result of , which can in turn reproduce, within 1%, blank-sky PIN spectra which have higher statistics (Fukazawa et al. (2009)). The contribution of the six point sources to the HXD-PIN spectrum is an order of magnitude lower than the NXB-subtracted signal in 12–40 keV. Therefore, the contribution of point sources affects the CXB level only by , which is much smaller than the statistical error.
Although we have thus adopted the two separate models to estimate the CXB in the XIS and HXD-PIN, the derived two surface brightness results agree within 1% in the connecting energy range of 6.0–12.0 keV. Therefore, our two modelings of the CXB are consistent. If we constrain the two CXB models so that the 6.0–12.0 keV surface brightness becomes the same, and fit the XIS and HXD-PIN spectra simultaneously, we can constrain the CXB above 10 keV better with . This case is shown in figure 2.
3.3 Field to field difference of X-ray background
In the following spectral analysis, we fit the Abell 2199 data simultaneously with the HLD data, in order to determine the X-ray background. However, the true X-ray background of the Abell 2199 field may be different from that of the HLD field. In order to examine the GFE brightness for possible differences between them, we employed X-ray count rates of these two fields from the ROSAT All-Sky Survey (RASS) which are available via the NASA’s HEASARC website777http://heasarc.gsfc.nasa.gov/cgi-bin/Tools/xraybg/xraybg.pl. Since the RASS data right on the Abell 2199 field is contaminated, of course, with the cluster emission, we obtained a count rate averaged over an annular region of which the inner radius is ( Mpc) and the outer radius is , centered on the cD galaxy NGC 6166. Since the virial radius of Abell 2199 is estimated to be Mpc () from the ICM temperature of 4 keV (Evrard et al. (1996)), this annular region can be considered to be free from the ICM emission.
Table 4 summarizes the RASS count rates of the Abell 2199 annular region and the HLD field (circular region, in radius). The 3/4 keV (0.47–1.21 keV) and 1.5 keV (0.76–2.04 keV) rates are the same between the two fields within statistical errors. Thus, the HLD region is confirmed to be a good background estimator for our Abell 2199 observations in these energy bands. The 1/4 keV (0.12–0.284 keV) band rates differ by %, suggesting a spectral difference betweeen the Abell 2199 and HLD fields in the softest energy band. However, the LB component, which dominates the spectrum in the 1/4 keV band, is poorly determined with the XIS spectra, and the 20% discrepancy is within the statistical error of % associated with the LB normalization in the following spectral analysis (§ 4.1).
The CXB surface brightness is known to fluctuate from direction to direction (Ishisaki (1997)). In the case of Suzaku, this fluctuation is estimated to be 10% and 18% for the XIS (full FOV) and PIN, respectively (see Appendix of Nakazawa et al. (2009) for details). We take these systematic errors into account in the spectral analyses described in section 4.
4 Data Analysis and Results
4.1 Thermal emission
In order to quantify the thermal emission of Abell 2199, we defined seven concentric annular regions as shown in figure 1, each with a radial width of . The center is chosen to be the X-ray emission centroid at ()=() in J2000.0 coordinates. This is offset from the nucleus of the cD galaxy, NGC 6166, but well inside its optical extent of in diameter.
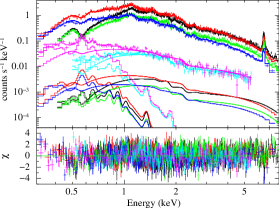
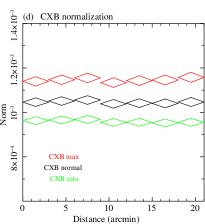
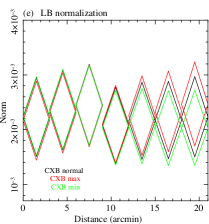
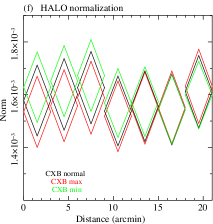
In analyzing a given annulus, we extracted XIS-FI (averaged over XIS 0 and XIS 3) and XIS-BI spectra from corresponding regions in the five pointings (but excluding those which have no intersection), and subtracted the NXB as described in subsection 2.2. For each annulus, the utilized observations are given in table 5. Then, the spectra from the same annulus (but different fields of view) were read into XSPEC together with the NXB-subtracted HLD spectra to constrain the X-ray background. The annular spectra were fitted simultaneously with a common vapec model with a free photoelectric absorption, together with the X-ray background model described in subsection 3.1, incorporating the responses created for the Abell 2199 ICM emission (subsection 2.2) and for a uniform X-ray source, respectively. All the parameters of the X-ray background model were tied between the annular and HLD spectra, except for the thickness of XIS contamination which depends on the date of observation (Koyama et al. (2007)). Among the different observations of Abell 2199, all the vapec parameters, except the overall normalization, were constrained to be the same. The cross normalization between XIS-FI and XIS-BI was set free. Metal abundances, , in the vapec model were tied in three groups as , , and . An example of this fitting in the – region is shown in figure 3. We also changed the normalization of CXB model by % and studied the effect of CXB fluctuation described in subsection 3.3. Although the X-ray background model is determined separately for the seven individual regions, the normalizations of CXB, LB, and Halo are consistent among the regions within errors (see figure 10 in Appendix C).
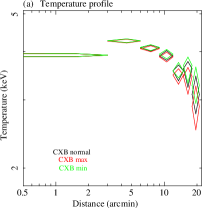
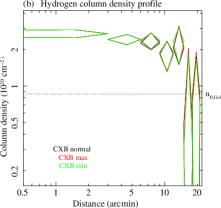
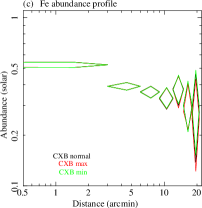
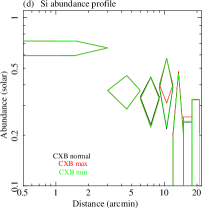
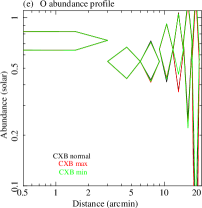
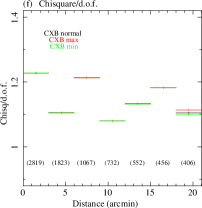
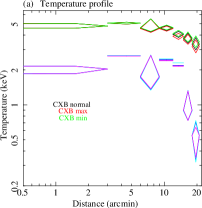
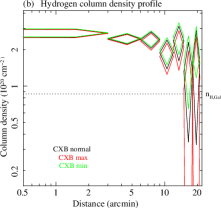
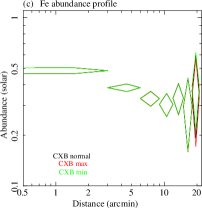
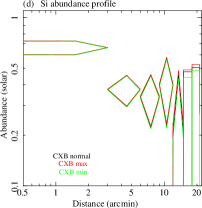
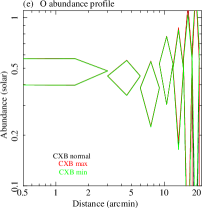
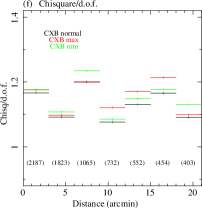
The results of this analysis are summarized in figure 4 (for details, see table 6 in Appendix E). The single-temperature vapec model thus reproduced the spectra successfully, and the CXB fluctuation did not affect the results significantly. The temperature and iron abundance were determined out to kpc, which is about 0.4 times the virial radius of a keV cluster. The temperature gradually decreases toward cluster outskirts from keV to keV. The temperature within , keV, is consistent with that derived with ASCA (4.1 keV; Fukazawa et al. (2004)). The iron and silicon abundances also decrease outwards by a factor of , while the oxygen abundance tends to be flat. The hydrogen column density obtained from the fit became (– cm-2, which is significantly higher than the Galacitic value. We examine the cause of this effect in subsection 4.2. The 0.5 – 10 keV X-ray luminosity integrated out to is erg s-1, which is consistent with the result of XMM-Newton (Snowden et al. (2008)).
Next, we attempted a two-temperature fit using a model expressed as vapec+vapec. Metal abundances of the two components were tied together. As shown in figure 5a and figure 5f (for details, see table 6 in Appendix E), the spectra in the innermost region (–) were reproduced better with the two-temperature model of 2 keV and 5 keV, while the improvement was not significant in the other regions. This is reasonable, because Johnstone et al. (2002) detected, with Chandra, a temperature drop from 5 keV to 2 keV toward the center within a central region of radius 100 kpc (). The iron and silicon abundance profiles did not change significantly between the single-temperature and two-temperature models. However, the oxygen abundance in the inntermost region decreased and the profile became flatter. The high values of , found with the single-temperature analysis, persisted; this effect cannot be regarded as an artifact caused by an inappropriate temperature modeling.
4.2 Constraints on soft excess emission
A soft excess may manifest itself as a hydrogen column density that is significantly lower than the Galactic HI columnn density toward the Abell 2199 field (weighted-averaged value over radius from NGC 6166), cm-2 from Dickey & Lockman (1990) or cm-2 from Kalberla et al. (2005). The measured values of in figure 4 and figure 5, however, are factor of – higher than the Galactic value in all regions. While this result generally argues against the presence of any flux excess in lower energies, we need to understand the nature of the higher absorption before discussing the soft excess issue. There are five possibilities to explain this effect: (1) excess absorption within the Abell 2199 system, (2) an overestimate of the background which was subtracted, (3) inadequate modeling of the ICM emission, (4) presence of high metallicity clouds at the direction of Abell 2199, and (5) underestimate of the XIS contaminant thickness which is included in the ARF. The first possibility is unlikely, because the measured is high even in the outer regions such as –. The second alternative is rejected, because we already incorporated the uncertainties of NXB and CXB in the analysis, and because within , the background level is more than an order of magnitude lower than the signal below 1 keV band. The third is also unrealistic, because the values of remained unchanged between the single- and two-temperature modelings. The forth is probably unphysical because metal abundances in such clouds would have to be as large as solar in order to explain the excess X-ray absorption, while keeping to the Galactic HI value. Then, we focus on the last possibility.
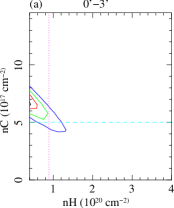
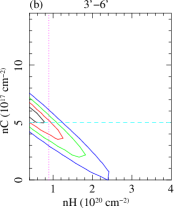
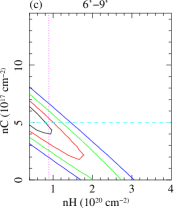
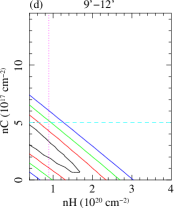
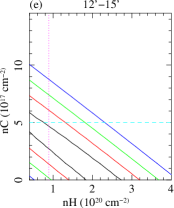
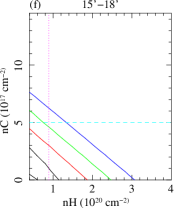
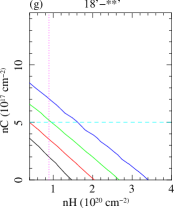
When we obtain separately with XIS-FI and XIS-BI in the three inntermost regions where the values of are constrained well (figure 4(b)), the results with XIS-FI become systematically higher than those with XIS-BI by %. This difference suggests an instrumental cause such as (5). Then, we evaluated an excess thickness of contaminant, assuming (5) is the cause of the high . We included an additional absorption by the XIS contamination in the single temperature model as vapecphabsvarabs. Here, the varabs factor represents the additional absorption which is added to that already included in the ARF, and can handle separately column densities of elements from hydrogen to nickel. The varabs column densities of all the elements except carbon and oxygen were fixed to zero, and the relative column-number-density ratio of carbon to oxygen was fixed to (Koyama et al. (2007)). By introducing the additional varabs factor, the best-fit model parameters did not change significantly except in phabs. Figure 6 shows the confidence contours between in phabs and the additional carbon column density in varabs. As easily expected, these two quantities correlate negatively with each other, and we cannot determine the true accurately. Fixing at the Galactic HI value in figure 6 (dotted magenta lines) yields cm-2 (dashed cyan lines in figure 6), which is comparable to an upper limit allowed by its systematic uncertainty888http://www.astro.isas.jaxa.jp/suzaku/process/caveats/caveats_xrtxis08.html. Therefore, we may regard the excess absorption observed in figure 4b and figure 5b as due to an underestimation of the XIS contaminant by cm-2, and presume that is equal to the Galactic HI value. From figure 6 of the innermost annuli, we can reject any value which is significantly lower than the Galactic HI value (dotted magenta lines in figure 6), because the extra carbon thickness must be cm-2.
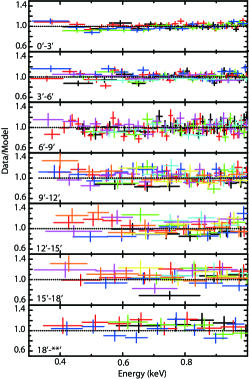
In figure 7, we show data-to-model ratios in the 0.3–1.0 keV range, when the data are fitted by the single temperature vapec model with cm-2 and cm-2 both fixed. The value of is thus set to the allowed maximum, and the combination of and means a slight () overestimate of the overall absorption specified by the data in figure 6 of the innermost annulus. Furthermore, the data are divided by the single-temperature model which was determined over a wide band of – keV. Therefore, soft excess emission, if any, should be seen in these ratio spectra. However, no significant systematic excess is seen therein. Then, to obtain an upper limit on the soft excess due to a thermal warm gas, we added to the model a 0.2 keV apec component with 0.2 solar metallicity, following the result of Kaastra et al. (2004). The derived 90% upper limit on surface brightness of the 0.2 keV component is summarized in table 6. In table 6, we also give XIS upper limits when a power law with photon index of 2.0 is added to the model. The upper limit on the power law in terms of the 0.2–10 keV luminosity becomes erg s-1 ( erg s-1 in 20–80 keV range) when integrated to . In subsection 4.3, we independently constrain such a power law component using the HXD-PIN data.
As a cross confirmation, we repeated the same analysis by choosing and cm-2, the latter suggested by figure 4. However, the ratio spectra remained essentially unchanged.
4.3 Constraints on hard excess emission
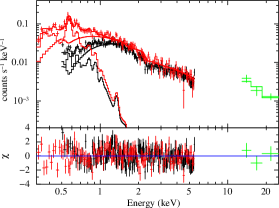
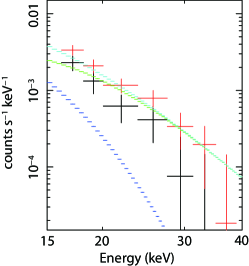
In figure 8, we show a 15–40 keV NXB-subtracted HXD-PIN spectrum summed over Center, Offset1, Offset2, and Offset4. By this summation, the statistical error associated with the 15–40 keV HXD-PIN signal reduced to % of the NXB, which is considerably smaller than the systematic NXB error of % (90% confidence range) adopted in the present paper.
After subtracting the NXB, the HXD-PIN signal (black crosses in figure 8) was thus detected significantly up to keV. For comparison, we also show in figure 8 spectra of the CXB and the thermal emission. Here, the thermal emission was modeled by summing the single temprature vapec models determined for individual annular regions. As to thermal emission outside the XIS FOV which contributes %, we assumed that the surface brightness obeys the double- profile which was described in § 2.2, and that the temperature and metal abundances therein is the same as those in the outermost region covered by the XIS. After the nominal XIS vs. HXD-PIN cross normalization (Kokubun et al. (2007), see also a Suzaku calibration document named suzakumemo-2007-11999http://www.astro.isas.jaxa.jp/suzaku/doc/suzakumemo/suzakumemo-2007-11.pdf), the model normalization of the thermal component was multiplied by a factor of 1.13 when calculating its predicted contribution to the HXD-PIN data. Using this cross normalization, intensities of the two CXB models in 6.0–12.0 keV agree within 1% as described in § 3.2. This assures that the systematic errors associated with the cross normalization is %, which is much smaller than the statistic erros in the HXD-PIN spectrum. Thus, the NXB-subtracted spectrum is consistent, within statistical errors, with a sum of the CXB and the extrapolated thermal emission (cyan points in figure 8). Even when the NXB is set to the minimum that is allowed by the 90% systematic uncertainty range, the HXD-PIN signal does not exceed the (CXB+thermal) emission significantly. Thus, the hard X-ray excess was not detected.
In order to obtain an upper limit on hard excess emission, we lowered the NXB within its 90% systematic uncertainty, and also lowered the CXB model within its fluctuation of 18% (90%-confidence). The estimation of the CXB fluctuation is described in Appendix B. Then, we fitted the NXB-subtracted spectrum with a power law (with its photon index fixed at 2.0 and its normalization left free) plus the fixed CXB and thermal models, and obtained upper limits. This very conservative method gave a 90%-confidence upper limit of erg s-1 on the 20–80 keV luminosity of the power-law component. If this component is uniformly distributed over a circular region of radius , the implied 0.2–10 keV luminosity per solid angle becomes erg s-1 arcmin-2. This limit is comparable to those obtained with the XIS using the softest specctral end.
5 Discussion
Using the five pointing observations with Suzaku, we measured the temperature and metal abundances of Abell 2199 out to kpc (0.4 times virial radius), and searched the XIS and HXD-PIN data for soft and hard excess emissions, respectively, both above the thermal component. We however found no significant excess emissions in either energy bands, and derived their upper limits. Over a broad energy band of keV to keV, the emission is dominated by the thermal components with temperatures of a few keV.
The upper limits on soft excess, expressed as the emission measure per unit solid angle from a 0.2 keV warm gas (table 6), are more stringent, typically by more than a factor of 3, than the reported positive detection by XMM-Newton (Kaastra et al. (2004)), cm-3 arcmin-2. One likely cause of this inconsistency between Suzaku and XMM-Newton is confusion with solar wind charge exchange (SWCX) emission, which has been observed with Chandra (Wargelin et al. (2004)), XMM-Newton (Snowden et al. (2004)), and Suzaku (Fujimoto et al. (2007)). In fact, proton flux near the Earth, observed with WIND-SWE101010http://web.mit.edu/space/www/wind.html, enhanced by a factor of 3–4 for a part of the XMM-Newton observatons compared with that of Suzaku. The relevant proton light curves are shown in Appendix D. Similarly, in Suzaku observations of outskirt regions of the Coma cluster, Takei et al. (2008) found no significant excess O VII or O VIII emissions which were previously reported with XMM-Newton (Finoguenov et al. (2003)), and concluded that the excess emission is likely due to an enhancement in the SWCX emission during the XMM-Newton observations.
The Suzaku data have constrained the 20–80 keV luminosity of any excess hard emission to be erg s-1, assuming that it has a power-law spectrum of photon index 2.0 and employing the most conservative estimates of the CXB. Using the BeppoSAX PDS, Nevalainen et al. (2004) detected non-thermal emission from Abell 2199 at 2.1 level, with 20–80 keV luminosity of erg s-1 (90%-confidence errors) assuming a power-law spectrum of photon index 2.0. This detection by the PDS is not rejected by our result. However, the BeppoSAX results, with a significance of only 2.1, would be considered as an upper limit, like the present result. In this case, our upper limit is a factor of 1.7 more stringent than that of the PDS. From a calibration analysis using the Crab Nebula, the 20–80 keV flux derived from the PDS is known to be systematically lower by 21% than that derived from HXD-PIN (Nakazawa et al. (2009)). If we take into account this systematic effect, the difference in the upper limits between HXD-PIN and PDS increases to a factor of 2.1.
Considering the difference between the FOVs of HXD-PIN ( in FWHM) and PDS ( in FWHM), the claimed detection by the PDS becomes consistent with our upper limit if the excess hard X-ray emission is much more extended than the HXD-PIN FOV. However, the total FOV of HXD-PIN in our pointing observations ( Mpc radius in FWHM) mostly cover the whole cluster region, times the Virial radius of Abell 2199 ( Mpc, see § 3.3). Therefore, to reconcile the two results, we would have to assume that the emission is spatially distributed much beyond the virial radius.
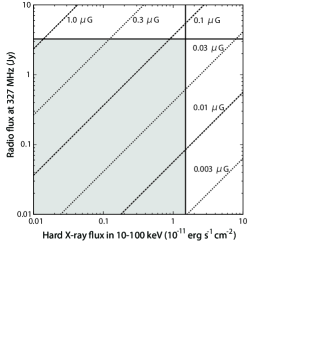
According to Kempner & Sarazin (2000), a radio synchrotron flux density at 327 MHz, , expected from Abell 2199, is related to the 10–100 keV IC X-ray flux, , as
| (2) |
assuming the photon index of the hard X-ray emission to be 1.81. Here, is the cluster magnetic field, and is the observed frequency. The upper limit they quoted on the diffuse radio flux, Jy at 327 MHz, and the hard X-ray emission detected by BeppoSAX, required a very weak magnetic field (G). However, given our non-detection of such an excess hard X-ray flux, this is no longer the case. When the HXD-PIN data are used to constrain a power-law component with a photon index of 1.81 (instead of 2.0), its 10–100 keV luminosity becomes erg cm-2 s-1. As a result, effectively any strength of magnetic field is allowed as shown in figure 9.
Regardless of the magnetic field strength, the present result constrain the number of relativistic electrons in the system, so that their IC emission should not exceed the present hard X-ray upper limit. If we assume a power-law spectrum of synchrotron emission with a photon index 2.0, the corresponding electron number spectrum has a power-law index 3.0, and is written as (Petrosian et al., 2006)
| (3) |
where is the Lorentz factor, is the total number of electrons, and is a lower-cutoff in which is conservatively estimated to be (Petrosian et al. (2006)). These relativistic electrons produce IC emission with a 20–80 keV luminosity of
| (4) |
where is the redshift. From equation 4 and our upper limit, we obtain . Then, the integrated electron kinetic energy for in Abell 2199 becomes
| (5) |
where is the electron mass. Since electrons with , which contribute to the – keV IC emission, have a liftime of yr in typical ICM conditions (Petrosian (2001)), the acceleration luminosity in Abell 2199 can be constrained as erg s-1. This upper limit is rather loose, and is three times higher than the 0.5–10 keV luminosity of the thermal emission. If we assume that the magnetic field of Abell 2199 is G as suggested by Faraday rotation measurements (Fe & Owen (1994)), the radio upper limit gives the dominant constraint on the relativistic electrons, with the predicted two orders of magnitude below the present upper limit (figure 9). In this case, the constraint of acceleration luminosity becomes erg s-1 which is about an order of magnitude lower than the 0.5–10 keV luminosity.
The total mass of Abell 2199 is when integrated to 0.8 Mpc (Fukazawa et al. (2004)). If Abell 2199 was formed via a major merger between two clusters with similar masses ( each) at a relative speed of km s-1, the kinetic energy deposited onto the merged system becomes
| (6) |
Since shocks produced in cluster mergers are thought to last typically yr (Takizawa (2000)), the energy input rate to non-thermal electrons becomes erg s-1, where is the fraction of energies given to them. Values of erg s-1 are also expected from theoretical models of merging clusters such as Coma (e.g. Takizawa (2004)). Then, our upper limit on the acceleration luminosity is an order of magnitude lower than , assuming . We hence infer that Abell 2199 have been free from major merger events for more than yr, which is a typical time scale on which the IC emission decays (Takizawa (2004)).
MK acknowledges support from a grant based on the Special Postdoctoral Researchers Program of RIKEN. The present work is supported in part by the Grant-in-Aid for Scientific Research (S), No. 18104004.
Appendix A Estimation of NXB systematic error
systematic erros of PIN 15–40 keV band, using earth occultation data and E0102-72 observations which has been regularly scheduled for the XIS calibration, is 2.3% (Fukazawa et al. (2009)). Since the statistical error is 1.8% (), the systematic uncertainty of the PIN NXB model in 15–40 keV band is estimated to % in 90% confidence region.
Appendix B Estimation of CXB systematic error
The CXB has uncertainty because the number of unresolved faint sources in FOV statistically fluctuate. This CXB fluctuation scales as , where is the FOV and is the detection threshold flux for point sources (Ishisaki (1997)). By scaling from the CXB fluctuation of HEAO-I, 2.8% for deg2 and erg s-1 cm-2 (Shafer (1983)), that of the HXD is estimated to be 18%, assuming deg2 and erg s-1 cm-2 in the 10–40 keV band. This corresponds to 1.3% of the NXB level.
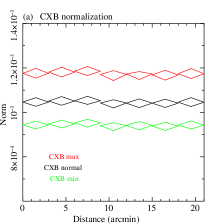
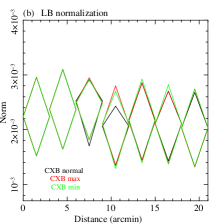
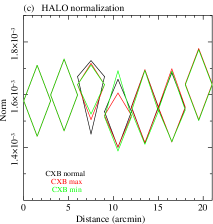
Appendix C Normalization of the background model
The background model (GFE+CXB) are determined separately for the seven annular regions. We show the normalizations of background components in figure 10. The normalizations of background models are consistent among the regions within errors (90% confidence range).
Appendix D Proton flux of Abell 2199 observations
figure 11 is proton flux of WIND-SWE111111http://web.mit.edu/space/www/wind.html, when XMM-Newton and Suzaku observed Abell 2199. These plots are created by multiplying proton speed and proton density of which data are public in the WIND-SWE web site.
Appendix E Fitting results of the seven annular regions
References
- Anders & Grevesse (1989) Anders, E., & Grevesse, N. 1989, GeCoA, 53, 197
- Balucinska-Church & McCammon (1992) Balucinska-Church, M., & McCammon, D. 1992, ApJ, 400, 699
- Boldt (1987) Boldt, E. 1987, PhR, 146, 215
- Bregman & Lloyd-Davies (2006) Bregman, J. N., & Lloyd-Davies, E. J. 2006, ApJ, 644, 167
- Buote & Canizares (1996) Buote, D. A., & Canizares, C. R. 1996, ApJ, 457, 565
- Cen & Ostriker (1999) Cen, R., & Ostriker, J. P. 1999, ApJ, 514, 1
- Cox (1998) Cox, D. P. 1998, in Lecture Notes in Physics 506, The Local Bubble and Beyond, ed. D. Breitschwerdt, M. J. Freyberg, & J. Truemper (New York: Springer), 121
- Cravens (2000) Cravens, T. E. 2000, ApJ, 532, L153
- Dickey & Lockman (1990) Dickey, J. M., & Lockman, F. J. 1990, ARA&A, 28, 215
- Evrard et al. (1996) Evrard, A. E., Metzler, C. A., & Navarro, J. F. 1996, ApJ, 469, 494
- Finoguenov et al. (2003) Finoguenov, A., Briel, U. G., & Henry, J. P. 2003, A&A, 410, 777
- Fujimoto et al. (2007) Fujimoto, R., Mitsuda, K., Mccammon, D., Takei, Y., Bauer, M., Ishisaki, Y., Porter, S. F., Yamaguchi, H., et al. 2007, PASJ, 59, 133
- Fukazawa et al. (2004) Fukazawa, Y., Makishima, K., & Ohashi, T. 2004, PASJ, 56, 965
- Fukazawa et al. (2009) Fukazawa, Y., Mizuno, T., Watanabe, S., Kokubun, M., Takahashi, H., Kawano, N., Nishino, S., Sasada, M., et al. 2009, PASJ, in press
- Fukugita et al. (1998) Fukugita, M., Hogan, C. J., & Peebles, P. J. E. 1998, ApJ, 503, 518
- Fusco-Femiano et al. (1999) Fusco-Femiano, R., dal Fiume, D., Feretti, L., Giovannini, G., Grandi, P., Matt, G., Molendi, S., & Santangelo, A. 1999, ApJ, 513, L21
- Fusco-Femiano et al. (2007) Fusco-Femiano, R., Landi, R., & Orlandini, M. 2007, ApJ, 654, L9
- Fe & Owen (1994) Ge, J., & Owen, F. N. 1994, AJ, 108, 1523
- Henley & Shelton (2008) Henley, D. B., & Shelton, R. L. 2008, ApJ, 676, 335
- Ishisaki (1997) Ishisaki, Y. 1997, Ph.D. thesis, University of Tokyo
- Ishisaki et al. (2007) Ishisaki, Y., Maeda, Y., Fujimoto, R., Ozaki, M., Ebisawa, K., Takahashi, T., Ueda, Y., Ogasaka, Y., et. al 2007, PASJ, 59, 113
- Johnstone et al. (2002) Johnstone, R. M., Allen, S. W., Fabian, A. C., & Sanders, J. S. 2002, MNRAS, 336, 299
- Kaastra et al. (1999) Kaastra, J. S., Lieu, R., Mittaz, J. P. D., Bleeker, J. A. M., Mewe, R., Colafrancesco, S., Lockman, F. J. 1999, ApJ, 519, L119
- Kaastra et al. (2004) Kaastra, J. S., Lieu, R., Tamura, T., Paerels, F. B. S., & den Herder, J. W. A. 2004, in Soft X-ray Emission from Clusters of Galaxies and Related Phenomena, ed. R. Lieu & J. Mittaz. (Dordrecht: Kluwer), 37
- Kalberla et al. (2005) Kalberla, P. M. W., Burton, W. B., Hartmann, D., Arnal, E. M., Bajaja, E., Morras, R., & Pöppel, W. G. L. 2005, A&A, 440, 775
- Kawano et al. (2003) Kawano, N., Ohto, A., & Fukazawa, Y. 2003, PASJ, 55, 585
- Kempner & Sarazin (2000) Kempner, J. C., & Sarazin, C. L. 2000, ApJ, 530, 282
- King (1962) King, I. R. 1962, AJ, 67, 471
- Kokubun et al. (2007) Kokubun, M., Makishima, K., Takahashi, T., Murakami, T., Tashiro, M., Fukazawa, Y., Kamae, T., Madejski, G. M., et al. 2007, PASJ, 59, 53
- Koutroummpa et al. (2007) Koutroumpa, D., Acero, F., Lallement, R., Ballet, J., & Kharchenko, V. 2007, A&A, 475, 901
- Koyama et al. (2007) Koyama, K., Tsunemi, H.,; Dotani, T., Bautz, M. W., Hayashida, K., Tsuru, T. G., Matsumoto, H., Ogawara, Y., et al. 2007, PASJ, 59, 23
- Kushino et al. (2002) Kushino, A., Ishisaki, Y., Morita, U., Yamasaki, N. Y., Ishida, M., Ohashi, T., & Ueda, Y. 2002, PASJ, 54, 327
- Lieu et al. (1999) Lieu, R., Ip, W.-H., Axford, W. I., & Bonamente, M. 1999, 510, L25
- Mitsuda et al. (2007) Mitsuda, K., Bautz, M., Inoue, H., Kelley, R. L., Koyama, K., Kunieda, H., Makishima, K., Ogawara, Y., et al. 2007, PASJ, 59, 1
- Nakajima et al. (2008) Nakajima, H., Yamaguchi, H., Matsumoto, H., Tsuru, T. G., Koyama, K., Tsunemi, H., Hayashida, K., Torii, K., et al. 2008, PASJ, 60, S1
- Nakazawa et al. (2009) Nakazawa, K., Sarazin, C. L., Kawaharada, M., Kitaguchi, T., Okuyama, S., Makishima, K., Kawano, N., Fukazawa, Y., et al. 2009, PASJ, 61, 339
- Nevalainen et al. (2004) Nevalainen, J., Oosterbroek, T., Bonamente, M., & Colafrancesco, S. 2004, ApJ, 608, 166.
- Nevalainen et al. (2007) Nevalainen, J., Bonamente, M., & Kaastra, J. S. 2007, ApJ, 656, 733
- Ota et al. (2008) Ota, N., Murase, K., Kitayama, T., Komatsu, E., Hattori, M., Matsuo, H., Oshima, T., Suto, Y., et al. 2008, A&A, 491, 363
- Petrosian (2001) Petrosian, V. 2001, ApJ, 557, 560
- Petrosian et al. (2006) Petrosian, V., Madejski, G., & Luli, K. 2006, ApJ, 652, 948
- Robertson & Cravens (2003a) Robertson, I. P., & Cravens, T. E. 2003a, GeoRL, 30, 22
- Robertson & Cravens (2003b) Robertson, I. P., & Cravens, T. E. 2003b,JGRA, 108, LIS 6
- Rossetti & Molendi (2004) Rossetti, M., & Molendi, S. 2004, A&A, 414, L41
- Sanders (2006) Sanders, J. S.., & Fabian, A. C. 2006, MNRAS, 371, L65
- Shafer (1983) Shafer, R. A. 1983, PhD. Thesis, University of Maryland
- Smith et al. (2001) Smith, R. K., Brickhouse, N. S., Liedahl, D. A., & Raymond, J. C. 2001, ApJ, 556, L91
- Snowden et al. (2004) Snowden, S. L., Collier, M. R., & Kuntz, K. D. 2004, ApJ, 610, 1182
- Snowden et al. (2008) Snowden, S. L., Mushotzky, R. F., Kuntz, K. D., & Davis, D. S. 2008, A&A, 478, 615
- Takahashi et al. (2007) Takahashi, T., Abe, K., Endo, M., Endo, Y., Ezoe, Y., Fukazawa, Y., Hamaya, M., Hirakuri, S., et al. 2007, PASJ, 59, 35
- Takei et al. (2008) Takei, Y., Miller, E. D., Bregman, J. N., Kimura, S., Ohashi, T., Mitsuda, K., Tamura, T., Yamasaki, N. Y., et al. 2008, ApJ, 680, 1049
- Takizawa (2000) Takizawa, M. 2000, ApJ, 532, 183
- Takizawa (2004) Takizawa. M 2004, PASJ, 54, 363
- Tawa et al. (2008) Tawa, N., Hayashida, K., Nagai, M., Nakamoto, H., Tsunemi, H., Yamaguchi, H., Ishisaki, Y., Miller, E. D., et. al 2008, PASJ, 60, 11
- Wargelin et al. (2004) Wargelin, B. J., Markevitch, M., Juda, M., Kharchenko, V., Edgar, R., & Dalgarno, A. 2004, ApJ, 607, 596
- Yan et al. (1998) Yan, M., Sadeghpour, H. R., & Dalgarno, A. 1998, ApJ, 496, 1044


| Position (Obs. ID) | Start∗ | End∗ | XIS Exposure† | PIN exposure† |
|---|---|---|---|---|
| Center (801056010) | 2006/Oct/01 07:08:00 | 2006/Oct/01 21:31:18 | 18.5 | 19.3 |
| Offset1 (801057010) | 2006/Oct/01 21:32:15 | 2006/Oct/02 10:43:19 | 23.5 | 23.7 |
| Offset2 (801058010) | 2006/Oct/03 12:41:00 | 2006/Oct/04 03:47:19 | 19.0 | 10.8 |
| Offset3 (801059010) | 2006/Oct/04 03:48:52 | 2006/Oct/04 16:17:19 | 18.9 | – |
| Offset4 (801060010) | 2006/Oct/04 16:19:16 | 2006/Oct/05 07:18:24 | 23.5 | 15.3 |
∗: Time is shown in UT.
†: Effective exposure in units of ks, obtained after the event selection.
| Position | HVP0 | HVP1 | HVP2 | HVP3 |
|---|---|---|---|---|
| Center | 400 | 500 | 500 | 500 |
| Offset1 | 400 | 500 | 500 | 500 |
| Offset2 | 400 | 500 0 | 500 0 | 500 0 |
| Offset3 | 400 | 0 | 0 | 0 |
| Offset4 | 400 | 0 400 | 0 500 | 0 500 |
∗: The numbers indicate high voltages in units of volts.
| ∗ | (CXB) | (CXB)† | (GFE)‡ | dof (prob.§) |
|---|---|---|---|---|
| (fix) | 1.412 (fix) | 315.1/285 (0.11) |
∗: Hydrogen column density in units of cm-2.
†: The 2.0–10.0 keV CXB surface brightness in units of erg s-1 cm-2 sr-1.
‡: The 0.3–1.0 keV GFE surface brightness in units of erg s-1 cm-2 sr-1.
§: Null hypothesis probability.
| Band∗ | –† | HLD‡ |
|---|---|---|
| 1/4 keV | ||
| 3/4 keV | ||
| 1.5 keV |
∗: RASS 1/4 keV, 3/4 keV, and 1.5 keV bands correspond to
0.12-0.284 keV, 0.47-1.21 keV, and 0.76-2.04 keV, respectively.
†: RASS count rate in an annulus around Abell 2199, in units of 10-6 counts s-1 arcmin-2.
‡: RASS count rate averaged over the HLD field
( radius) in units of 10-6 counts s-1 arcmin-2.
| Region | Observation |
|---|---|
| – | Center, Offset1 |
| – | Center, Offset1, Offset2 |
| – | Center, Offset1, Offset2 |
| – | Center, Offset1, Offset2, Offset4 |
| – | Offset1, Offset2, Offset3, Offset4 |
| – | Offset1, Offset2, Offset3, Offset4 |
| –* | Offset3, Offset4 |
| Region | – | – | – | – | – | – | – |
|---|---|---|---|---|---|---|---|
| Warm gas∗ | 7.5 | 7.3 | 4.0 | 6.5 | 3.7 | 6.0 | 5.3 |
| Power law† | 3.8 | 1.2 | 0.7 | 0.5 | 0.3 | 0.4 | 0.3 |
∗: Surface brightness of 0.2 keV gas, expressed as emission measure per unit solid angle in units of cm-3 arcmin-2
†: 0.2–10 keV luminiosity per unit solid angle of a power law with photon index of 2.0, in units of erg s-1 arcmin-2.
ccccccc
Fitting result of the single-temperature vapec model for the seven annular regions.
Region /D.O.F.
\endfirstheadFitting result. –continued
Region /D.O.F.
\endhead\endfoot∗: Temperature in units of keV.
†: Hydrogen column density in units of cm-2.
‡: Metal abundance in solar unit of Anders & Grevesse (1989).
\endlastfoot CXB level is default
–
–
–
–
–
–
–
CXB level is minimum
–
–
–
–
–
–
–
CXB level is maximum
–
–
–
–
–
–
–
ccccccc
Fitting result of the two-temperature vapec model for the seven annular regions.
Region /D.O.F.
\endfirstheadFitting result. –continued
Region /D.O.F.
\endhead\endfoot∗: Temperatures of (higher component) / (lower component) in units of keV.
†: Hydrogen column density in units of cm-2.
‡: Metal abundance in solar unit of Anders & Grevesse (1989).
\endlastfoot CXB level is default
–
– (fix)
–
– (fix)
– (fix)
–
–
CXB level is minimum
–
– (fix)
–
– (fix)
– (fix)
–
–
CXB level is maximum
–
– (fix)
–
– (fix)
– (fix)
–
–