The QCD equation of state and transition at finite temperature
Abstract:
We present the latest results for the equation of state and the crossover transition in 2+1 flavor QCD from the HotQCD Collaboration. Bulk thermodynamic quantities - energy density, pressure, entropy density, and the speed of sound - are calculated on lattices with temporal extent in the temperature range . We utilize two improved staggered fermion actions, asqtad and p4, with the mass for the two degenerate light quarks chosen to be , corresponding to for the lightest pion. We also calculate observables that are sensitive to the chiral and deconfing transitions - the light and strange quark number susceptibilities, the chiral condensate, and the renormalized Polyakov loop - finding that deconfinement and chiral symmetry restoration occur in the same narrow temperature interval.
1 Introduction
Among the most important and fundamental problems in finite-temperature QCD are the calculation of the bulk properties of hot QCD matter and the characterization of the nature of the QCD phase transition. Understanding finite temperature QCD also has direct application in interpreting the results from heavy ion collision experiments. Here, we present a lattice calculation of the QCD equation of state, i.e., the pressure, energy density, entropy density, and speed of sound, at finite temperature and vanishing chemical potential. We also calculate quantities such as the chiral condensate, renormalized Polyakov loop, and the light and strange quark number susceptibilities, which are related to the chiral and deconfining aspects of the QCD transition. For a more detailed discussion of our results, see [1].
2 Simulation Details
This calculation presents results with two different improved staggered fermion actions, p4 and asqtad, with lattices with temporal extent Both the p4 and asqtad actions eliminate the errors in bulk thermodynamic observables at high temperature, so there are only small deviations from the asymptotic, ideal gas limit even at and 8 [2]. Symanzik-improved gauge actions are used with both the p4 and asqtad fermion actions. For the p4 action, a tree-level improved gauge action is employed. For the asqtad action, a one-loop improved gauge action is utilized, with the addition of tadpole improvement in both the gauge and fermion parts of the action. Furthermore, to reduce the effects of taste-symmetry breaking, fat-link smearing is implemented. The p4 action adds the three-loop staple into the fat link, while the asqtad action adds terms up to the seven-link staple which minimize the taste-mixing terms in the fermion action.
The finite temperature results presented here at are obtained from lattices of size generated using the RHMC algorithm. These results are presented with previously obtained results at [3, 4]. In the case of the asqtad action, some new measurements were also made on lattices. In addition, ”zero temperature” calculations have also been performed on lattices where the gauge coupling and bare quark masses are chosen to be the same as a corresponding ensemble at finite temperature.
These calculations were performed with two degenerate light quarks, and a heavier strange quark. The strange quark mass is chosen to be close to its physical value, with the light quark mass of . The bare masses are fixed so that they lie on a line of constant physics, i.e., the hadron masses remain fixed in physical units. In our case, , , and are used to fix the line of constant physics. This corresponds to a lightest pion of MeV. The line of constant physics differs slightly between the p4 and asqtad actions, with the strange pseudoscalar mass, approximately 15% larger in the asqtad case than with the p4 action. In order to set the lattice scale in physical units, we use the quantities and , which are related to the shape of the heavy quark potential:
| (1) |
We use fm. in order to translate our lattice data into physical units [5].
3 QCD Equation of State
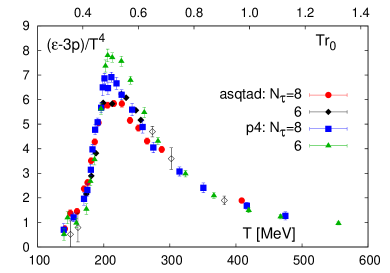
In determining bulk thermodynamic observables on the lattice, the basic quantity that we calculate is the trace anomaly ,
| (2) |
The trace anomaly can be separated into contributions from two pieces. One contribution comes from the strange and light quark condensates, and vanishes in the chiral limit, i.e.,
| (3) |
and a piece that is non-vanishing in the chiral limit:
| (4) |
where and are nonperturbative beta functions which describe how the bare parameters change with scale:
| (5) |
and the notation indicates a zero temperature subtraction has been made.
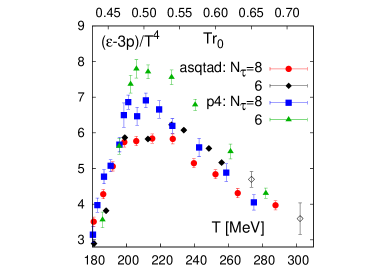
Figure 1 shows the results for the trace anomaly at and 8. As one can see, there is quite good agreement between the two different actions, particularly in the high temperature region ( MeV). Figure 1 also shows the peak region, where the differences between the two actions are largest. In particular, the peak for the p4 action is about 15% higher than for the asqtad action.
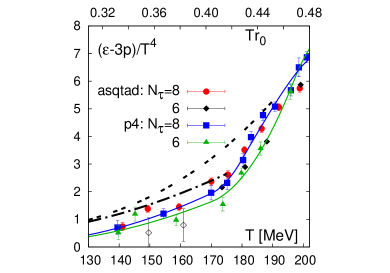
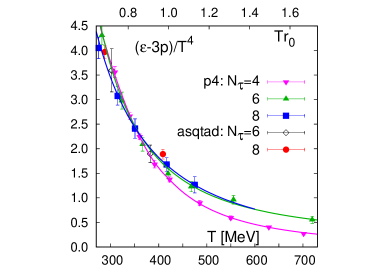
Figure 2 shows the trace anomaly at both low and high temperature. Although the p4 and asqtad results are generally consistent at low temperature, we find that they (not surprisingly) do not agree with those of the hadron resonance gas model, as the hadron spectrum is distorted by heavier-than-physical quark masses and taste symmetry violations. At high temperature, we see that we have very good agreement between the p4 and asqtad actions, as well as evidence for small lattice artifacts.
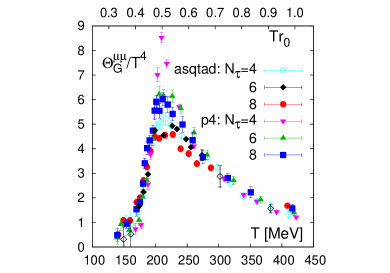
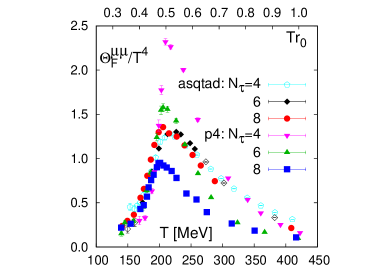
Figure 3 shows the contributions to the trace anomaly from and . Although identifying these two terms as ”gluonic” and ”fermionic” contributions is not accurate (as the dynamical quarks mix these two terms), one can see that the gluonic observables dominate the trace anomaly. In addition, whereas there is little evidence for cut-off dependence in for the asqtad action, there is significant cutoff dependence for p4. This cutoff dependence can be traced to the nonperturbative beta function at strong coupling. Indeed, one can see that the cutoff effects in are diminished at higher temperature.
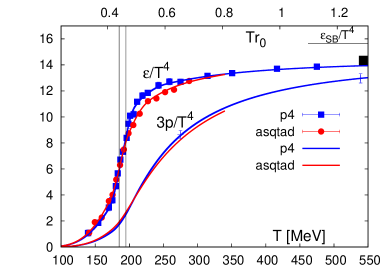
From the trace anomaly, one can reconstruct the pressure via integration:
| (6) |
where is chosen to be a temperature sufficiently deep in the confined regime so that is small. From the pressure and trace anomaly, it is straightforward to construct the energy density, entropy density, and speed of sound.
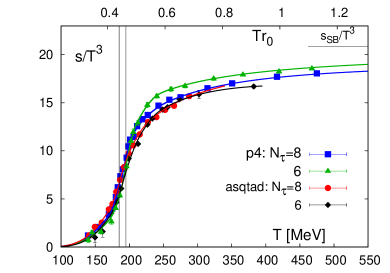
Figure 4 shows the energy density, three times the pressure, and entropy density. Our data show that the relative difference between the two actions is no more than about 15% in the low temperature region for MeV, and falls to about 5% for MeV. For the p4 action, the cutoff effects between and 8 are of similar size, while no statistically significant cutoff dependence is seen for the asqtad action.
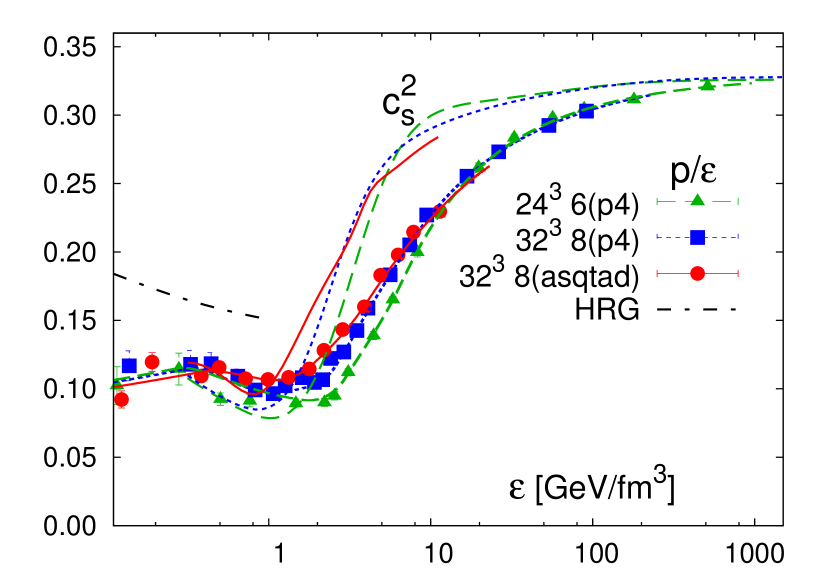
Figure 5 shows the ratio of the pressure and energy density, as well as the speed of sound. Although there is qualitative agreement between the two actions, the speed of sound significantly undershoots the hadron resonance gas value at low temperature. The speed of sound is given by:
| (7) |
4 QCD Transition
As it is suspected that QCD with physical quark masses undergoes a smooth crossover, can not be sharply defined and may depend on the observable one chooses. In particular, it is unclear whether observables related to deconfinement and those related to chiral symmetry restoration give similar values for . In this section, we examine various quantities related to both deconfinement and chiral symmetry restoration.
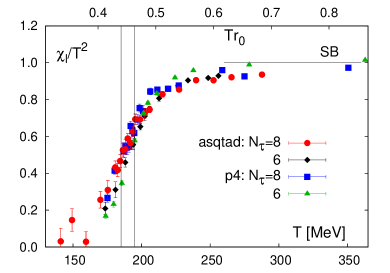
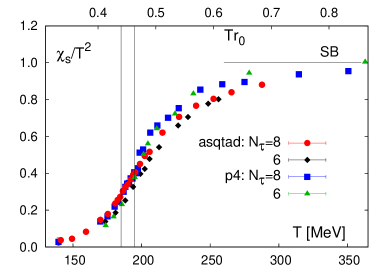
One set of observables related to deconfinement are the light and strange quark number susceptibilities:
| (8) |
These quantities give information on the thermal fluctuations of the degrees of freedom that carry net quark number. Thus, this observable is sensitive to the liberation of degrees of freedom that comes with deconfinement. Figure 6 shows the light and strange quark number susceptibilities. As we can see, rises more sharply than , while seems to go to zero much more quickly. This is explained by the fact that the lightest hadrons that carry light and strange quark number are the pions and kaons, respectively. Thus, we would expect , while .
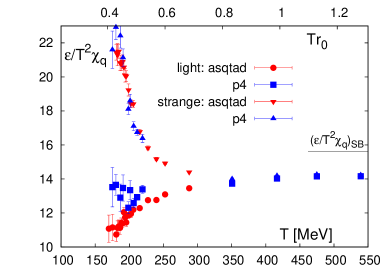
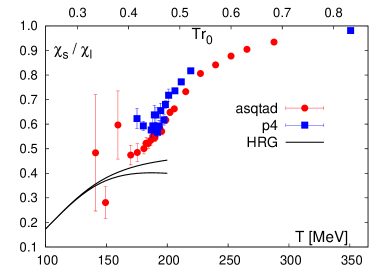
In Fig. 7, we see that the light quark number susceptibility tracks the rise in the energy density quite well as one moves through the crossover region. On the other hand, becomes singular in the low temperature regime. This is because the light quark susceptibility, but not the strange quark susceptibility, is directly sensitive to the singularity in the partition function in the chiral limit. At high temperature, when the temperature is sufficiently high that the quark masses are irrelevant, we see that agree. The relative suppression of compared to can also be seen in the ratio , also in Fig. 7, where it is consistent with the value obtained with the hadron resonance gas model.
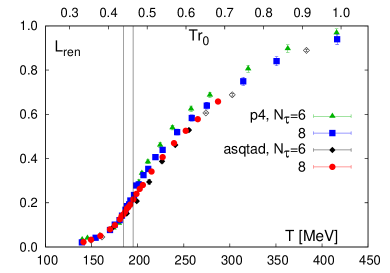
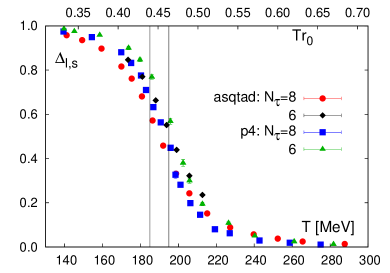
In Fig. 8, we show the renormalized Polyakov loop and the subtracted chiral condensate. These quantities are sensitive to the chiral and deconfining transitions, respectively. The subtracted chiral condensate is defined as:
| (9) |
The temperature band is superimposed on both plots to show that the chiral and deconfinement transitions occur in the same approximate temperature regime.
5 Conclusions
We have presented here a calculation of the bulk observables (energy density, pressure, entropy density, speed of sound) of QCD matter at finite temperature and zero chemical potential. Our results indicate that cutoff errors are approximately 15% in the crossover region, and no more than 5% for In addition, we have calculated various observables (quark number susceptibility, renormalized Polyakov loop, and chiral condensate), which seem to give consistent values of for the deconfinement and chiral symmetry restoring transition at the lattice spacings that we employ.
References
- [1] A. Bazavov, et. al., Equation of state and QCD transition at finite temperature, Phys. Rev. D80, 014504 (2009), [arXiv:0903.4379]
- [2] U. M. Heller, F. Karsch, B. Sturm, Improved staggered fermion actions for QCD thermodynamics, Phys. Rev. D60, 114502 (1999), [hep-lat/9901010]
- [3] M. Cheng, et. al., The QCD Equation of State with almost Physical Quark Masses, Phys. Rev. D77, 014511 (2008), [arXiv:0710.0354]
- [4] C. Bernard, et. al., QCD equation of state with 2+1 flavors of improved staggered quarks, Phys. Rev. D75, 094505 (2007), [hep-lat/0611031]
- [5] A. Gray, et. al., The Upsilon spectrum and m(b) from full lattice QCD, Phys. Rev. D72, 094507 (2005), [hep-lat/0507013]