Kinetic Monte Carlo simulation of shape transition of strained quantum dots
Abstract
The pyramid-to-dome transition in GexSi1-x on Si(100) initiated by step formation on pyramidal quantum dots is atomistically simulated using a multistate lattice model in two-dimensions incorporating effective surface reconstructions. Under quasi-equilibrium growth conditions associated with low deposition rates, the transition occurs at island size following independent of temperature and deposition rate. The shape transition is found to be an activated process. Results are explained by a theory based on simple forms of facet energies and elastic energies estimated using a shallow island approximation. An asymptotic scaling relation for applicable to = 2 or 3 dimensions is derived. The shape transition energy barrier can be dominated by the interface energy between steep and shallow facets.
pacs:
81.15.Aa, 68.65.Hb, 81.16.Dn, 81.16.RfI introduction
The self assembly of quantum dots in heteroepitaxy exhibits very interesting physics and has possible application to device fabrication Politi et al. (2000); Shchukin et al. (2003); Berbezier and Ronda (2009). Growth of Ge or GeSi alloy nanostructures on Si(100) is the prototype example most widely studied. Under typical deposition conditions, pyramidal islands bounded by shallow (105) facets form spontaneously on a wetting layer. They can then undergo transitions into multi-faceted dome islands dominated by much steeper (113) facets and bounded also by other facets Ross et al. (1999). This shape transition gives rise to a bimodal island size distribution with enhanced dome size uniformity Ross et al. (1998). An atomic pathway based on step bunching on the pyramids has been identified Montalenti et al. (2004a); Cereda and Montalenti (2007).
In this work, we report atomistic dynamic simulations of the pyramid-to-dome transition using a fast kinetic Monte Carlo (KMC) approach based on a multistate solid-on-solid model in two-dimensions (2D). Extensive simulations under a wide range of conditions are performed and a simple analytical description is presented. A scaling relation for the transition island size generalizable to three dimensions (3D) is investigated.
Kinetic simulation of a strained film is much more challenging computationally than the unstrained case because of the long-range nature of elastic interactions. First principles calculations Fujikawa et al. (2002); Cereda et al. (2005); Lu et al. (2005); Shklyaev et al. (2005); Cereda and Montalenti (2007) and molecular-dynamics simulations Makeev et al. (2003); Retford et al. (2007) have provided important information on the energetics of the relevant surfaces and steps, but are in general limited to the studies of static properties at small system sizes. Continuum simulations in contrast are instrumental for investigating large scale and long time behaviors Tu and Tersoff (2004); Huang et al. (2007), but lacking atomic discreteness, nucleation events associated with island formation and shape transition cannot be naturally simulated. KMC simulations based on lattice models are hence unique in allowing large scale atomistic studies on the dynamics of strained heteroepitaxy.
Using a ball and spring lattice model for elastic solids, Orr et. al Orr et al. (1992) conducted early KMC simulations of strained layers in 2D. In the simulations, the elastic energy of the system has to be computed repeatedly in order to simulate the atomic hopping events responsible for the morphological evolution. Applying more advanced algorithms for the solution of the elastic problem and the sampling of atomic hopping events, simulations using large and moderate system sizes in 2D Lam et al. (2002); Gray et al. (2005); Schulze and Smereka (2009) and 3D Lung et al. (2005); Russo and Smereka (2006); Lam and Lung (2007); Lam et al. (2008); Lee et al. (2009) respectively became possible. The model was extended recently to model (105) facets Lam (2010) and atomic intermixing with substrate atoms Baskaran et al. (2010). Alternatively, KMC simulations can also be performed efficiently using more approximate forms of elastic interactions Ratsch et al. (1996); Meixner et al. (2002); Zhu et al. (2007).
This paper is organized as follows. Section II explains our multistate model for elastic solids which can account for both a shallow and a steep facet. The KMC simulation results are presented in Sec. III. In Sec. IV, island energies and the island transition rate are calculated theoretically. In Sec. VI, a scaling relation between the transition island size and the Ge concentration is derived. We conclude in Sec. VI with some further discussions.
II multistate solid on solid model
Our model is based on a ball and spring square lattice model of elastic solids for GexSi1-x on Si Lam et al. (2002). The substrate lattice constant is Å while the film material admits a lattice misfit . Each node on the lattice represents an atom and it is connected to its nearest and next nearest neighbors by elastic springs with force constants eV/ and respectively. This choice gives the correct modulus of silicon and a shear modulus constant along tangential and diagonal directions.
In this work, (100), (105) and (113) surfaces must be effectively simulated. A leveled surface in the model naturally accounts for a (100) surface. However, lattice models generally lead to islands with a single type of sidewalls at 45∘ inclination or steeper Orr et al. (1992); Lam et al. (2002); Gray et al. (2005); Schulze and Smereka (2009); Lung et al. (2005); Russo and Smereka (2006); Lam and Lung (2007); Lam et al. (2008); Lee et al. (2009). A multi-state extension has been introduced recently in Ref. Lam (2010) to effectively model the much shallower (105) facets of a pyramid in 2D. We now further generalize it to simulate both shallow and steep facets with slopes
| (1) |
comparable to those of realistic facets in pyramids and domes. Specifically, atoms are normally represented by squares. To effectively model surface reconstructions leading to specific facets, we allow local deformation of the topmost atoms in the film or substrate into trapezoids each characterized by a tilt variable and an extension variable . Here, gives the slope of the upper surface of an atom and equals
| (2) |
at a locally undeformed region, a shallow facet or a steep facet respectively. Allowing atomistically flat shallow and steep facets further requires additional freedoms of vertical stretching or compression of the topmost atoms by
| (3) |
This characterizes a total of possible local deformation states. All lengths are measured in unit of throughout this paper. Atomic column with atoms is thus trapezoidal in general with the left and right edges of heights and given by
| (4) | |||||
| (5) |
A surface step in between column and has a height
| (6) |
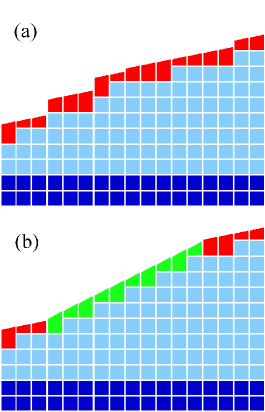
projected along the vertical direction. Figures 1(a)-(b) show examples of atomic configurations.
Misfit induced elastic strain is assumed to be completely independent of the local deformations associated with faceting introduced above. The elastic relaxation energy of the system is defined as the total energy storied in all springs at mechanical equilibrium compared with that in the homogeneously strained state. The bond energy of the system is defined relative to that of a flat surface by
| (7) |
where the facet-type label , depending on , indicates if column is locally undeformed () or corresponds to a shallow () or steep facet (). The facet formation energy per site equals , meV, or meV. These values control the relative stability of the facets in our simulations. They are chosen empirically so that shallow and steep facets start to emerge on islands of appropriate sizes. Also, the facet interface energy is non-zero only at the boundary between either different facet types or different facet orientations (i.e. ) where it equals with eV, eV, and , assuming . The term represents surface step energy. It equals on a locally undeformed region where eV is the nearest neighboring bond energy. If the site or belongs to a shallow or a steep facet, it equals where is the larger of and . Here, eV and eV represent the single step energies on shallow and steep facets respectively and dictates the tendency of step bunching. To discourage very steep regions, the intrinsic step height defined by disregarding local deformation is constrained to and furthermore each pair of consecutive upward or downward intrinsic steps with contributes 0.15 eV to the repulsion energy . The constraint also limits the step heights to bounded values, although double steps in particular, which have heights and on shallow and steep facets respectively are still possible.
The KMC approach simulates every hopping event of a topmost film atom according to the rate
| (8) |
Atoms then lands random on any other site at most 8 columns away. Here, and denote the change in the bond energy and the strain energy of the system when the site is occupied versus unoccupied. We put eV and . This gives the appropriate adatom diffusion coefficient for silicon (100). Due to the long-range nature of elastic interactions, the repeated calculations of dominates the simulation run time and we handle it using a Green’s function method together with a super-particle approach Lam et al. (2008). Exposed substrate atoms are not allowed to hop. Elastic couplings of adatoms with the rest of the system are weak and are neglected for better computational efficiency. Atomic hoppings are assumed to preserve the local deformation states. After every period , a set of deformation states will be updated. We put where is the adatom hopping rate on an locally undeformed region easily calculable from Eq. (8). At an odd (even) numbered updating event, all odd (even) lattice sites will be updated. The variables and at those sites are re-sampled from the allowed set of 15 possible combinations using a heat bath algorithm based on the relative probability . Our model obeys detailed balance. The dynamical rules described above reduces back to those used in Refs. Lam et al. (2002) at locally undeformed regions. We have critically checked our software implementation, in particular using a Boltzmann’s distribution test Lam et al. (2008), which is found to be indispensable in verifying that practically all, but not only the dominating hopping pathways can be correctly simulated. We also have checked in small scale simulations that restricting hoppings to only nearest neighboring sites rather than allowing long jumps gives similar results except for an insignificant shift in the time scale. Wetting layers on the substrates are believed to be relatively immobile and are not simulated for simplicity.
III Simulation results
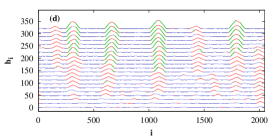
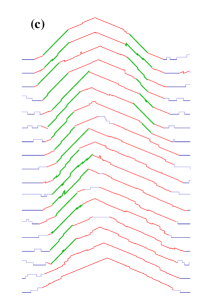
Figures 1(a) show a shallow facet with steps from a small scale simulation. The steps are subsequently smoothed out by the formation of a steep facet as shown in Fig. 1(b). Figure 2(a) shows snapshots of a surface from a typical simulation of deposition at 4 ML/s, 700∘C and on a substrate of width 2048. Successive profiles are displaced vertically for clarity. Stepped mounds first develop and some of them matures into pyramids bounded by shallow facets as explained in Ref. Lam (2010). Some of the pyramids further turns into domes bounded mainly by steep facets often with regions of shallow facets at the top. Figure 2(b) shows the detailed evolution of one of the domes. Steep facets on either side of a pyramid form independently. The transition hence often goes through a meta-stable half-dome stage. The formation of most domes is preceded by steps appearing on the shallow facets as shown in Fig. 1 and Fig. 2(b) and as proposed in Ref. Montalenti et al. (2004a). A close examination reveal that these steps are highly dynamic and continuously bunches, separate and diffuses around. After accumulating a considerable total step height, they transform highly reversibly into a steep facet. As the total height of the steps increases, the resulting steep facet is more stable and eventually become fully stabilized. A smaller number of domes are initiated instead by the formation of steep facets at the base of the pyramid when shallow facets temporarily decay into unfaceted regions due to thermal excitations.
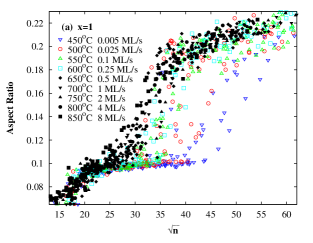
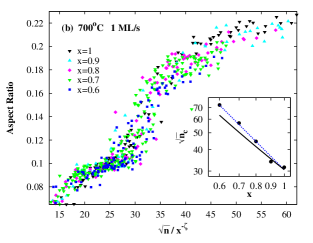
Large scale deposition simulations have been performed at temperature from 450∘C to 850∘C at on lattices of width 2048. The deposition rate varies from 0.006 to 8 ML/s chosen empirically to generate typically 3 to 5 pyramids or domes on each substrate. The low island density minimizes elastic interactions among islands which are known to alter the dynamics Floro et al. (2000); Capellini et al. (2003). An island is defined as one in which all constituent columns must be at least 2 atoms tall. We measure island size in number of atoms so that is proportional to the linear size of the island. Also, island aspect ratio is defined by where is the height of the highest point of the island and is its basewidth. Figure 3(a) shows a scatter plot of the aspect ratio against for all islands from 3 independent runs at each temperature. Measurements are conducted throughout the evolution. Time averaging of values associated with individual islands over short periods are performed, but no ensemble averaging is done as each island develops in general at a different pace. We observe that first converges towards 0.1 as islands transform from stepped mounds into pyramids. It then rises again to around 0.2 characterizing the dome transition similar to experiment findings in Ref. Montalenti et al. (2004a). The much lower density of the data points at corresponding to highly unstable intermediate states was also observed in Ref. Montalenti et al. (2004a). The morphologies of these intermediate states have been shown in Fig. 2(b). Results in Fig. 3 reveals two distinct trends. For the runs at , all islands follows an identical evolution path with the dome transition occurring at size . In contrast, at lower temperature , the transitions are delayed randomly to increasingly larger sizes. At for instance, ranges from about to . We will explain these distinct trends at the end of this section.
Similar deposition simulations are also performed at C and ML/s for Ge concentration from 0.6 to 1 with 3 independent runs in each case. We find that the dome transitions occur at increasingly larger island sizes as decreases. The precise dependence is easily illustrated by a rescaled plot of against with as shown in Fig. 3(b). Data for various values of collapse reasonably well into a single curve, implying
| (9) |
where is a rescaled function. To calculate used above, we have measured the transition size by averaging the sizes of all islands right at the transitions with . The resulting plot of against in log-log scales is shown in the inset of Fig. 3(b). A linear relation observed in the log-log plot implies
| (10) |
and a linear fit gives . This scaling relation will be explained in Sec. IV.
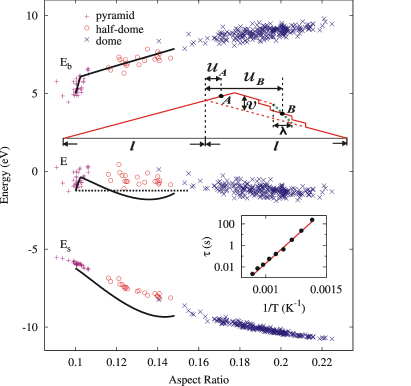
To study the energies of individual islands, we have performed simulations on annealing of single pyramids directly constructed on smaller substrates each of width . The annealing temperature is 550∘C. The pyramid is initially bounded by shallow facets and sits on an otherwise empty substrate surface. It contains 1230 atoms and has a basewidth slightly less than the lattice width. This number is chosen empirically to be just sufficient to ensure an irreversible dome transition. Figure 4 shows a scatter plot of the system bond energy , strain energy and total energy against measured during the annealing from 16 independent runs. Since a single island dominates, these energy of the whole system approximates those of an island. Only time averaging of the values over short periods but no ensemble averaging has been carried out. The symbols used indicate if the data points correspond to pyramids, half-domes, or domes. The geometries are identified reliably by the number of steep facets present. The result indicates that there is an energy barrier for the transition. Moreover, a number of data points associated with half-domes cluster around showing that the geometry characterizes a meta-stable state.
We next show that the dome transition is an activated process. We have repeated the above simulations on the annealing of pyramids at from 450∘C to 850∘C. A dome transition time defined as the average annealing duration required to reach an aspect ratio is measured. Values of each averaged over 16 independent runs are plotted against in the inset in Fig. 4. The data fits well to
| (11) |
with eV and s. The Arrhenius temperature dependence is typical of activated processes. The value of will be explained in Sec. IV. We further repeat the simulation 300 times at C. The values of measured are histogrammed. The result is well fitted by an exponential distribution. This further supports that the dome transition is an activated process.
With the shape transition time known, the distinct trends followed by the data in Fig. 3(a) can now be explained. The deposition rate has been empirically chosen to produce a constant and sparse island density. The choice hence ultimately depends on pyramid nucleation and coarsening dynamics and is not directly related to the dome transition dynamics. For the C runs, we find that . The shape transition is thus fast compared with deposition and hence also the island growth. The dome transition process is only limited by the availability of atoms. The geometry as characterized by the aspect ratio therefore only depends on and is independent of and as shown in Fig. 3(a). In contrast, for the C runs, we get . Island growth can then be fast enough to out-run the dome transition, which becomes rate-limited. There is a significant random waiting time for the dome transition following an exponential distribution during which the island may already have grown to a larger size. The transition thus occurs at a more broadly distributed island size as observable from Fig. 3(a). Note that if we consider for example a higher island density by increasing the values of used, the characteristic temperature separating the two trends, which is found to be around here, will increase.
IV Theory of shape transition
We now present a detailed theoretical analysis based on generic forms of elastic and facet energy for the transition of a pyramid into a half-dome in 2D, which is applied to interpret our KMC simulation results. Half-domes are meta-stable and they quickly transform into domes. Our formulation is consistent with that of Montalenti et al. who have shown using energy parameters for Ge/Si from first-principle calculations that the dome transition is energetically favorable for sufficiently large pyramids Montalenti et al. (2004a).
Consider an island of size initially in the form of a pyramid with a half-basewidth . We have
| (12) |
Geometrical rearrangements can lead to the formation new atomic layers of total vertical thickness on one of the facets as shown in the schematic diagram in Fig. 4. The new half-basewidth is then related to by
| (13) |
where and denote the positions of the midpoints A and B on the edges of the new layers measured from the apex of the base pyramid. A single atomic step on a shallow facet has a height . We assume for simplicity that there are single steps at point B. Using Eq. (7), the bond energy of the pyramid is
| (14) |
The pyramid becomes a half-dome when all the steps at point B turn into a steep facet of columns wide. The bond energy of the resulting half-dome also follows from Eq. (7) and we get
| (15) |
Neglecting the small difference in the elastic energies of the two geometries, the island takes the form with the lowest bond energy .
The elastic energy of the pyramid and the half-dome is assumed to be identical and is calculated by approximating both edges of the new layers as vertical walls located at A and B. A shallow island approximation Tersoff and LeGoues (1994); Daruka et al. (1999) gives
| (16) |
where denotes the local surface slope of the island at position and is a spatial cutoff. We put where and represent the sign function and the Dirac delta function. In 2D, where is the component of the bulk misfit stress and is the Young’s modulus. For our model, a simple calculation based on lattice elasticity gives .
Performing the integrations in Eq. (16), we have
| (17) |
where and . In the following, we put where is the average spatial extent of the misfit force monopoles applied over the edges at A and B. It can be shown that this choice gives the correct energy when approaching the point force limit.
From simple geometry, . We calculate by minimizing the total island energy at small . Linearizing from Eqs. (13)-(15) and (17) w.r.t. , it can be shown after some algebra that for both pyramids and half-domes, is minimized at
| (18) |
The total energy cost of an island compared with the initial pyramid can then be calculated. For a half-dome, we get, up to linear order in ,
| (19) |
Equation (18) gives the energetically most favorable position for the initial formation of a steep facet. Using the KMC model parameters for , it gives for islands around the transition size. The result is in general close to a limiting value obtained by neglecting the shallow facet formation energy .
The energies , and are numerically calculated for various layer thickness adopting the KMC model parameters for using Eqs. (13)-(15) and (17)-(18). The island aspect ratio is also calculated as a function of using and Eq. (13). In Fig. 4, the energies are plotted as solid lines against . We have assumed an island size atoms measured during the dome transition in the KMC annealing simulations responsible for the data points in Fig. 4. The only tunable parameter is a fitted additive constant eV for , which accounts for the bond energies of all other excitations in the system. It nevertheless plays no role in further calculations. The theoretical estimates of the energies generally show reasonable quantitative agreement with simulation results as observed in Fig. 4. The main discrepancies are due to errors in , since the shallow island approximation is known to overestimate the elastic relaxation at large . Nevertheless, important features including a shape transition energy barrier and a meta-stable half-dome state are correctly reproduced and these will be further studied.
From Fig. 4, both theory and KMC simulation show an energy barrier for the dome transition associated with a maximum in the total energy . Its location follows theoretically from . We get a barrier height eV which occurs at or . It corresponds to new atomic layers on the shallow facet. For below and above 1.03 respectively, pyramid and half-dome are the energetically preferred states. Due to the small value of at the barrier, is dominated by the steep facet interface energy term as can be deduced from Eq. (19), i.e. eV. The dominance of the steep facet interface energy on the transition energy barrier may be a general feature applicable also in 3D.
The existence of an energy barrier confirms that the dome transition is an activated process as suggested in Sec. III. The transition rate hence follows the Arrhenius form , where denotes an attempt frequency. Assuming that the transition is limited by the diffusion of adatoms on the shallow facet, one expect , where and are the adatom density and diffusion coefficient on the shallow facet. Here, eV and eV are the adatom formation energy and hopping energy barrier on the shallow facet calculated using Eqs. (7) and (8). In particular, is not far from a previous estimate from first-principles calculations Montalenti et al. (2004b). The dome transition time is hence given by
| (20) |
A comparison with Eq. (11) leads to . It gives eV in agreement with eV obtained above from KMC simulations.
V scaling of shape transition size
We first assume quasi-equilibrium conditions in which the dome transition is fast compared with island growth. It applies to the cases of slow deposition and small transition barrier and is valid for our KMC simulations at (see Fig. 3(a)). The island energy from theory as shown in Fig. 4 exhibits a local minimum representing the meta-stable half-dome state. The energy rises again at larger because the base pyramid then becomes too small to relief the elastic energy efficiently. The dome transition occurs only if the half-dome is sufficiently stable, say of energy below that of the initial pyramid. For island at the transition size , the minimum of hence follows . We can then calculate numerically using Eqs. (13), (15), (17) and (18) and the values are plotted against as a solid line in the inset of Fig. 3(b). Note that no tunable parameter is involved. The values are in reasonable agreement with the KMC results and supports the scaling relation in Eq. (10) with consistent with found in simulations.
In addition to the numerical estimate of the exponent above, better insights are obtained by deriving an exact exponent valid asymptotically in the small misfit limit, i.e. . Assume that the relative position of the steep facet is independent of so that , which will be justified later. Simple scaling properties in 2D elasticity imply that the change in the elastic energy of a half-dome compared with the initial pyramid follows for some function . This is also explicitly derivable from Eq. (17). The total energy cost of a half-dome is hence
| (21) |
where and . At island transition size and considering a layer height minimizing to , we have
| (22) |
It means that the elastic energy gain must overcompensate the facet formation energy cost by an excess amount . As , we will see in the following that the shape transition occurs at a larger island size. Both energy terms on the l.h.s. of Eq. (22) increase unboundedly and must balance each other, while the constant energy excess becomes negligible. Therefore, we have . The meta-stable half-dome state at transition is thus characterized by the scaling solution . Using and , we get
| (23) |
i.e. . This solution is consistent with the assumption that is independent of as deduced using Eq. (18). It also justifies that both terms on the l.h.s. of Eq. (22) increase unboundedly as .
For finite and , the energy excess in Eq. (22) is not negligible. It gives a finite size correction to the exact scaling in Eq. (23). This results at an effective scaling with consistent with found in our KMC simulation.
In 3D, the dome transition is initiated by step bunching close to the mid-level on a pyramid Montalenti et al. (2004a). Generalizing our discussion above, we consider the formation of a square ring of steep facet of vertical thickness on a 3D pyramid of basewidth . Generalizing Eq. (21), the energy cost is
| (24) |
where the terms on the r.h.s. similarly denote the facet formation energy, the elastic energy gain, and the steep facet interface energy respectively, for some smooth function and constants and independent of and . A similar calculation leads to . This generalizes Eq. (23) to
| (25) |
with the same exponent in dimension or 3 for . For finite , an effective exponent is expected in both dimensions.
The asymptotic scalings derived above for quasi-equilibrium conditions essentially follows from the balance between the steep facet formation energy and the elastic energy gain which scales with the island size differently. It is analogous to the scaling predicted for island formation size based on the Asaro-Tiller-Grinfeld instability theory Politi et al. (2000). Due to the simplicity, it is also rather robust as will be shown below.
Instead of assuming quasi-equilibrium conditions, the dome transition can be limited by the kinetics. This may be appropriate in particular at 3D for small since the barrier predicted above can become too large to overcome. The transition is then delayed to a larger island size which lowers the barrier. Let us then assume a very simple transition criterion that the energy barrier must not exceed a given value, say a few times of . A similar calculation for again arrives at Eq. (25) with the same exponent in both 2D and 3D. The solution also requires but and we have used for which readily follows in the 2D case from Eq. (19) after neglecting a logarithmic factor.
VI discussions
In the calculations above, denotes the actual Ge concentration in the film so that . In experiments, it can differ greatly from the nominal concentration due to intermixing with substrate atoms and this complicates interpretation of experiment results. As a very rough estimate, experiments on deposition of pure Ge at e.g. 450∘C and 700∘C have found dome transition occurring at island volume nm3 Drucker (2002) and nm3 Stoffel et al. (2006). Neglecting compositional non-uniformity, it has been estimated that the actual Ge concentrate in the islands is and 0.43 respectively at 450∘C and 700∘C Smith et al. (2003). This gives a very preliminary estimate for the scaling exponent consistent with the asymptotic value derived above, although more experiments are required for a reliable conclusion.
Our simulations and theoretical calculations show that occurrence of well-defined dome transitions depends strongly in particular on the formation and interface energies of steep facets. The detailed dependences of these energies on the Ge concentration and temperature are neglected. We have also neglected the spatial non-uniformity of Ge concentration, surface stress and realistic crystal elastic anisotropy. They should have significant quantitative impacts on the shape transition, but are not expected to alter the dynamics described here qualitatively.
In summary, we have generalized a multi-state lattice model for elastic solids to account for both shallow and steep facets with tunable energy parameters. Using this model, we perform kinetic Monte Carlo simulations to study the pyramid-to-dome transition in the heteroepitaxy growth of GexSi1-x on Si in 2D. For sufficiently slow deposition, the shape transition occurs at an island size independent of temperature and deposition rate. A scaling relation between the transition size and the Ge concentration is observed. For fast deposition, the transition can be delayed randomly to a larger island size. For annealing simulations, the shape transition time is found to follow an Arrhenius form. A theory based on elastic energy in the shallow island approximation and simple forms of facet formation energies is derived. Numerical solutions of the energetic equations give island energies, shape transition size, and shape transition rate in reasonable agreement with simulations. The shape transition energy barrier is dominated by the interface energy between the shallow and the steep facets. We have also derived analytically an exact scaling rule between the transition size and the Ge concentration applicable in the limit of small Ge concentration which is expected to be valid in both 2D and 3D. A finite size correction to the scaling at higher Ge concentration is explained.
This work was supported by HK GRF, Grant No. PolyU-5009/06P and PolyU Grant No. G-U354.
References
- Politi et al. (2000) P. Politi, G. Grenet, A. Marty, A. Ponchet, and J. Villain, Phys. Rep. 324, 271 (2000).
- Shchukin et al. (2003) V. A. Shchukin, N. N. Ledentsov, and D. Bimberg, Epitaxy of nanostructures (Springer, 2003).
- Berbezier and Ronda (2009) I. Berbezier and A. Ronda, Surf. Sci. Rep. 64, 47 (2009).
- Ross et al. (1999) F. M. Ross, R. M. Tromp, and M. C. Reuter, Science 286, 1931 (1999).
- Ross et al. (1998) F. M. Ross, J. Tersoff, and R. M. Tromp, Phys. Rev. Lett. 80, 984 (1998).
- Montalenti et al. (2004a) F. Montalenti, P. Raiteri, D. Migas, H. von Kanel, A. Rastelli, C. Manzano, G. Costantini, U. Denker, O. Schmidt, K. Kern, et al., Phys. Rev. Lett. 93, 216102 (2004a).
- Cereda and Montalenti (2007) S. Cereda and F. Montalenti, Phys. Rev. B 75, 195321 (2007).
- Fujikawa et al. (2002) Y. Fujikawa, K. Akiyama, T. Nagao, T. Sakurai, M. G. Lagally, T. Hashimoto, Y. Morikawa, and K. Terakura, Phys. Rev. Lett. 88, 176101 (2002).
- Cereda et al. (2005) S. Cereda, F. Montalenti, and L. Miglio, Surf. Sci. 591, 23 (2005).
- Lu et al. (2005) G.-H. Lu, M. Cuma, and F. Liu, Phys. Rev. B 72, 125415 (2005).
- Shklyaev et al. (2005) O. Shklyaev, M. Beck, M. Asta, M. Miksis, and P. Voorhees, Phys. Rev. Lett. 94, 176102 (2005).
- Makeev et al. (2003) M. A. Makeev, W. Yu, and A. Madhukar, Phys. Rev. B 68, 195301 (2003).
- Retford et al. (2007) C. M. Retford, M. Asta, M. J. Miksis, P. W. Voorhees, and E. B. Webb III, Phys. Rev. B 75, 075311 (2007).
- Tu and Tersoff (2004) Y. Tu and J. Tersoff, Phys. Rev. Lett. 93, 216101 (2004).
- Huang et al. (2007) Z. Huang, T. Zhou, and C. h. Chiu, Phys. Rev. Lett. 98, 196102 (2007).
- Orr et al. (1992) B. G. Orr, D. Kessler, C. W. Snyder, and L. Sander, Europhys. Lett. 19, 33 (1992).
- Lam et al. (2002) C.-H. Lam, C.-K. Lee, and L. M. Sander, Phys. Rev. Lett. 89, 216102 (2002).
- Gray et al. (2005) J. L. Gray, R. Hull, C.-H. Lam, P. Sutter, J. Means, and J. A. Floro, Phys. Rev. B 72, 155323 (2005).
- Schulze and Smereka (2009) T. P. Schulze and P. Smereka, J. Mech. Phys. Solids 57, 521 (2009).
- Lung et al. (2005) M. T. Lung, C.-H. Lam, and L. M. Sander, Phys. Rev. Lett. 95, 086102 (2005).
- Russo and Smereka (2006) G. Russo and P. Smereka, J. Comput. Phys. 214, 809 (2006).
- Lam and Lung (2007) C.-H. Lam and M. T. Lung, Int. J. Mod. Phys. B 21, 4219 (2007).
- Lam et al. (2008) C.-H. Lam, M. T. Lung, and L. M. Sander, J. Sci. Comput. 37, 73 (2008).
- Lee et al. (2009) J. Y. Lee, M. J. Noordhoek, P. Smereka, H. McKay, and J. M. Millunchick, Nanotechnology 20, 285305 (2009).
- Lam (2010) C.-H. Lam, Phys. Rev. E 81, 021607 (2010).
- Baskaran et al. (2010) A. Baskaran, J. Devita, and P. Smereka, Cont. Mech. Thermo. 22, 1 (2010).
- Ratsch et al. (1996) C. Ratsch, P. Smilauer, D. Vvedensky, and A. Zangwill, J. Phys. I 6, 575 (1996).
- Meixner et al. (2002) M. Meixner, E. Scholl, V. Shchukin, and D. Bimberg, Phys. Rev. Lett. 87, 236101 (2002).
- Zhu et al. (2007) R. Zhu, E. Pan, and P. W. Chung, Phys. Rev. B 75, 205339 (2007).
- Floro et al. (2000) J. A. Floro, M. B. Sinclair, E. Chason, L. B. Freund, R. D. Twesten, R. Q. Hwang, and G. A. Lucadamo, Phys. Rev. Lett. 84, 701 (2000).
- Capellini et al. (2003) G. Capellini, M. D. Seta, and F. Evangelisti, J. Appl. Phys. 93, 291 (2003).
- Tersoff and LeGoues (1994) J. Tersoff and F. K. LeGoues, Phys. Rev. Lett. 72, 3570 (1994).
- Daruka et al. (1999) I. Daruka, J. Tersoff, and A.-L. Barabási, Phys. Rev. Lett. 82, 2753 (1999).
- Montalenti et al. (2004b) F. Montalenti, D. B. Migas, F. Gamba, and L. Miglio, Phys. Rev. B 70, 245315 (2004b).
- Drucker (2002) J. Drucker, J. Quant. Elect. 38, 975 (2002).
- Stoffel et al. (2006) M. Stoffel, A. Rastelli, J. Tersoff, T. Merdzhanova, and O. G. Schmidt, Phy. Rev. B 74, 155326 (2006).
- Smith et al. (2003) D. Smith, D. Chandrasekhar, S. Chaparro, P. Crozier, J. Drucker, M. Floyd, M. McCartney, and Y. Zhang, J. Cryst. Growth 259, 232 (2003).