A Biomechanical Model for Dictyostelium Motility
Abstract
The crawling motion of Dictyostelium discoideum on substrata involves a number of coordinated events including cell contractions and cell protrusions. The mechanical forces exerted on the substratum during these contractions have recently been quantified using traction force experiments. Based on the results from these experiments, we present a biomechanical model of Dictyostelium discoideum motility with an emphasis on the adhesive properties of the cell-substratum contact. Our model assumes that the cell contracts at a constant rate and is bound to the substratum by adhesive bridges which are modeled as elastic springs. These bridges are established at a spatially uniform rate while detachment occurs at a spatially varying, load-dependent rate. Using Monte-Carlo simulations and assuming a rigid substratum, we find that the cell speed depends only weakly on the adhesive properties of the cell-substratum, in agreement with experimental data. Varying the parameters that control the adhesive and contractile properties of the cell we are able to make testable predictions. We also extend our model to include a flexible substrate and show that our model is able to produce substratum deformations and force patterns that are quantitatively and qualitatively in agreement with experimental data.
I Introduction
Cell movement over solid surfaces plays a key role in many every-day biological processes including embryogenesis, osteogenesis, wound healing, and immune defense Franz et al. (2002). For example, neutrophils chemotax towards a wound in order to prevent infection Baggiolini (1998). On the other hand, cell motility can play a significant role in disease; for instance, cancer cells spread out and intrude into healthy tissue by directed, active motion Wang et al. (2005); Condeelis et al. (2004); Kedrin et al. (2007). Hence, deeper insight into the biochemical and mechanical processes involved in cell crawling would be of great interest and importance.
Despite their apparent differences, many eukaryotic cells share essential characteristics of their crawling motion Rafelski and Theriot (2004); Mogilner (2009). At the macroscopic level, cell motion often consists of several distinguishable phases: (i) extension of a membrane protrusion (pseudopod) at the leading edge, (ii) attachment of the pseudopod to the substratum, and (iii) detachment and subsequent retraction of the cell rear. These mechanical changes are mainly driven by polymerizing F-actin (protrusion) and myosin motors (retraction) Mogilner (2009). Both processes are regulated and synchronized in a spatio-temporal manner Lauffenburger and Horwitz (1996). Additionally, in many higher organisms, detachment is regulated via biochemical changes of focal adhesions Lee and Jacobson (1997); Laukaitis et al. (2001); Kaverina et al. (2002). In other motile cells, on the other hand, focal adhesions are absent and a similar degradation mechanism has not yet been reported.
Much of our understanding of cell motility has come from experiments on the social amoeba Dictyostelium discoideum which has been established as an experimental model system during the past decades Parent and Devreotes (1999); Noegel and Schleicher (2000); Kessin (2001). These cells move rapidly ( 10 m/min) and can be very sensitive to chemical cues. Also, the availability of a large variety of mutants allows quantitative insight into regulatory as well as mechanical aspects of cell motion. This paper is devoted to presenting a simple model for Dictyostelium crawling, with specific emphasis on the biomechanics of adhesive contacts between the cells and the substratum.
One motivation for this study relates to recent force cytometry experiments in which the traction forces exerted by motile Dictyostelium cells chemotaxing on elastic substrata have been measured very precisely del Álamo et al. (2007); Lombardi et al. (2007). The observed stresses range up to 50Pa, giving rise to contractile pole forces, defined as the total force exerted in the front and back half of the cell, of 90pN. Typically, the contractile forces are concentrated in spots of m size. These experiments also reveal a strong correlation between force generation and morphological changes associated with the aforementioned three-stage cycle. Thus, the cell motion exhibits a mechanical cycle consisting of (i) a contraction phase, initiated by pseudopod attachment, in which the stresses increase; (ii) a retraction phase, in which the rear detaches and is brought forward. Consequently the cell shrinks and the stresses relax; (iii) a protrusion phase, in which the cell extends a pseudopodium in the direction of motion. At this stage, the pseudopodium does not exert noticeable forces on the substratum. The length of such a cycle is in the order of 1-2min for wild-type (WT) Dictyostelium cells and 4min in cells lacking myosin II, a motor protein responsible for cytoskeletal force generation del Álamo et al. (2007). The cell displacement of 15m per cycle is roughly constant.
The exact nature of the adhesive forces between Dictyostelium cells and the substratum is not known. Most likely, the observed forces are transmitted through discrete contact foci on the ventral side of the cell. These foci are associated with F-actin rich regions which appear in spatial and temporal proximity to stress foci Uchida and Yumura (2004); Iwadate and Yumura (2008). Actin foci are spatially static but have a lifetime of 20sec. Wild-type (WT) cells have 5-10 foci. On the other hand, based on experimental results on cell detachment in shear flow, the number of microscopic adhesive bridges between cell and substratum is estimated to be 105 Simson et al. (1998); Décavé et al. (2002a). Hence each adhesion focus is comprised of many bridges.
It is reasonable to expect that to some extent, the cell speed should be controlled by the strength of attachment and the dynamics of detachment. Clearly, neither a non-adherent cell nor a cell that is unable to detach can move. However, between these extreme cases, the cell speed seems to depend only weakly on its adhesiveness Jay et al. (1995). In support of this, weakly adherent talin-null cells move with roughly the same speed as WT cells del Álamo et al. (2007). Mutants lacking myosin II move more slowly than wild-type cells, but cover the same distance per contraction cycle, i.e., the period of the cycle is increased. These cells do exhibit a much reduced motility on strongly adhesive substrata Jay et al. (1995), as this combination places the cells in the extreme case of not having enough strength to contract against the adhesive forces. Finally, the over-expression of paxillin reduces the adhesion, but leaves the speed during folate chemotaxis relatively unchanged Duran et al. (2009).
The importance of attachment/detachment dynamics for cell motility has been addressed in many theoretical studies DiMilla et al. (1991); Bottino and Fauci (1998); Gracheva and Othmer (2004); Larripa and Mogilner (2006). These typically predict a strong dependence of cell speed on cell-substratum adhesiveness. Indeed, the prediction of an optimal adhesiveness is in excellent agreement with experimental findings on mammalian cells Palecek et al. (1997). But, as just discussed, the situation appears to be different in Dictyostelium.
In these models, cell motion follows either from the protruding activity at the front Gracheva and Othmer (2004); Larripa and Mogilner (2006) or from asymmetric detachment during cell contraction DiMilla et al. (1991); Bottino and Fauci (1998); Bottino et al. (2002). In the latter models, cell contraction is represented by internal forces acting on a visco-elastic cell body and the attachment/detachment dynamics are represented by an effective friction term with the substratum Bottino et al. (2002); Gracheva and Othmer (2004); Larripa and Mogilner (2006). However, the experimental observation of discrete binding sites suggest that a representation by discrete, breakable springs as in Refs. DiMilla et al. (1991); Bottino and Fauci (1998) is more appropriate.
In this work we argue, that contraction takes place at a constant rate and that the cell speed is limited by the rate of detachment of the adhesive bridges. That is, the rate-limiting step in cell motility in this case is the peeling of the cell from the substratum. Based on stress patterns observed in Ref. del Álamo et al. (2007) we assume that cell detachment takes place mainly during the contraction phase and that protrusion forces contribute only a small amount to cell detachment. Therefore, our theoretical model of cell motion emphasizes the role of cell detachment during the contraction phase. Our model makes testable predictions about the cell speed under various experimental situations. These include crawling on substrata with varying adhesiveness and the variation of a number of cell-specific parameters.
II Model
II.1 Components and Assumptions
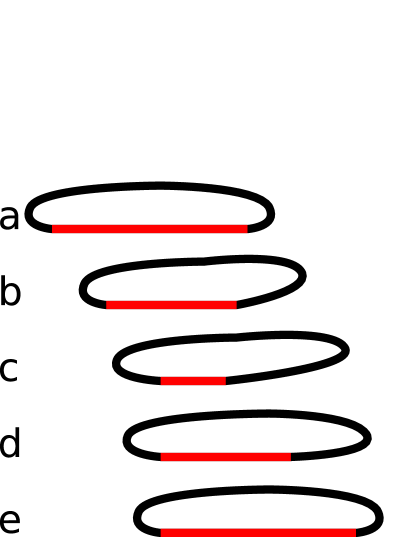
Our model focuses on the contraction phase of the motility cycle and does not explicitly treat the protrusive forward motion part of the cycle. Instead, as is shown schematically in Fig. 1, the cell is assumed to maintain protrusive activity throughout the cycle during which cell material is constantly transported to the front. This notion is corroborated by the observation that over the entire cycle the cell speed shows only little variation (del Álamo, private communication). Then, we can define the cell speed as the displacement of the back of the cell at the end of the contraction phase divided by the cycle period.
We assume that during the contraction phase, with duration , myosins contract the cell body uniformly with a constant speed. This is motivated by (i) direct inspection of contracting Dictyostelium cells del Álamo et al. (2007) and (ii) the observation that the in vitro myosin velocity is load-independent Riveline et al. (1998). The assumption of a constant contraction rate is an essential difference to earlier work in which the cell is described as a one-dimensional network of contractile elements, each of which is exerting the same force on the nodes of the network DiMilla et al. (1991). Our choice is motivated by the fact that force balance implies that, when attached elastically to a substratum, the interior of such networks is largely stress-free. This is, however, in contrast to experimental observations which show that the stress field extends into the interior of the cell-substratum area, indicating that cells do not operate a contractile network with prescribed forces. We also assume that the cell contraction is not hindered by viscous stress of the surrounding medium. Indeed, as shown in Ref. del Álamo et al. (2007), the forces due to fluid drag on the moving cell are much smaller than the experimentally observed forces exerted on the substratum (0.1pN vs. 90pN, del Álamo et al. (2007)). Thus, the cell is always in a state of mechanical equilibrium and the motion of the cell is quasi-static.
Further, we assume that the cell is attached to the substratum via adhesive bridges. These bridges form with a fixed on-rate and dissociate with an off-rate which is both force and position dependent. The force dependence accounts for the fact that the potential barrier between bound and unbound state is lowered by an external force Hänggi et al. (1990); Décavé et al. (2002a). The position dependence incorporates a possible preferred detachment at the rear vs. the front DiMilla et al. (1991). These asymmetric adhesion properties are known to play a major role in mammalian cells, where focal adhesion complexes are coupled to intra-cellular pathways Sabouri-Ghomi et al. (2008). To our knowledge, and contrary to other systems Lee and Jacobson (1997); Huttenlocher et al. (1997); Kaverina et al. (2002), such a differential adhesion has not been measured yet in Dictyostelium.
II.2 Rigid Substratum Model
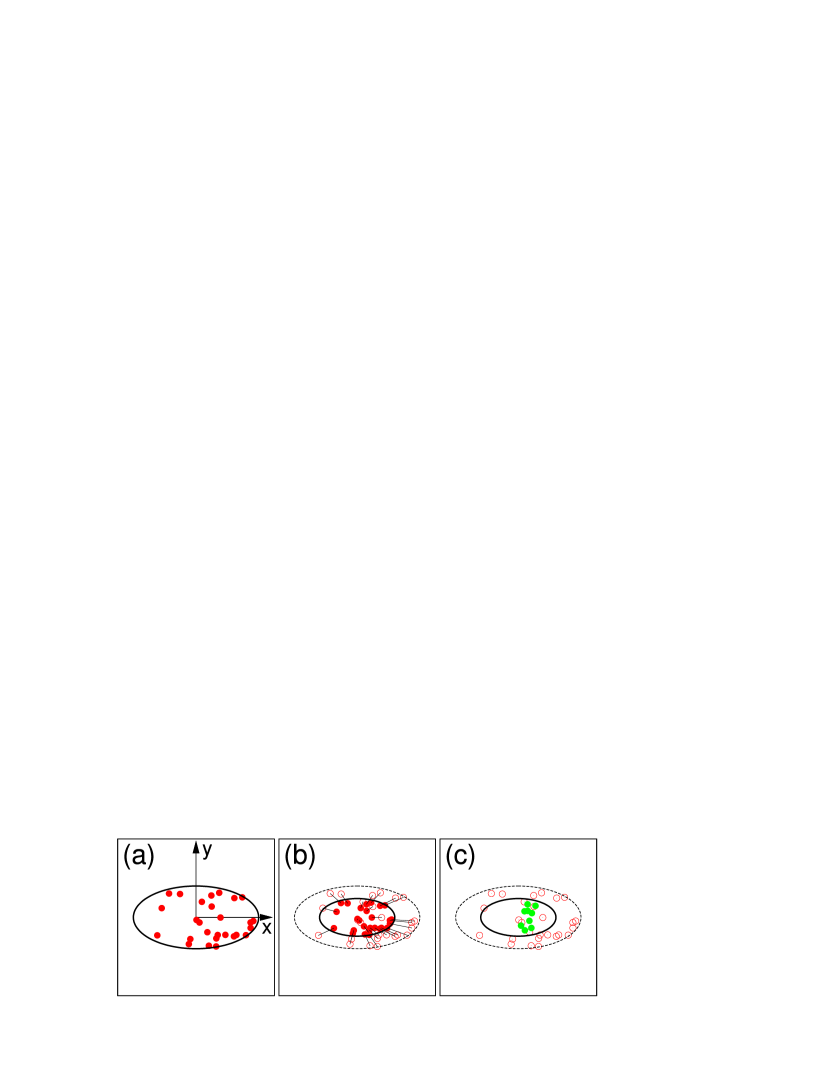
In our simulations, the adhesion area is represented by an ellipse with a fixed number () of randomly distributed sites that can adhere to the substratum. Their position at time is measured with respect to the center of the ellipse. The amount of contraction is parametrized by the contraction rate which can take on values between 0 and 1 and which is defined as where are the semi-major axes of the ellipse at the onset and end of contraction, respectively. We divide the contraction cycle into 100 equal timesteps and at each timestep the new position of node is given by =(. Here, is the location of the cell’s center which is allowed to shift in order to ensure a vanishing net force on the cell (see below). The position dependence of the off-rate is chosen to depend on the component along the direction of motion as follows:
| (1) |
where represent the front/back of the cell at the start of the contraction cycle and where are independent parameters of our model. The probability that a particular site adheres is given by the equilibrium value .
The attachments between cell and substratum are modeled by elastic springs with spring constant . In the case of a very rigid substratum we can ignore the deformations in the substratum. Then, the force on a single bond is given by , where is the initial position of the bond. In principle, our prescribed displacement of the nodes can lead to a non-zero net force on the cell. To ensure a vanishing net force after each iteration we use the fact that the motion is quasi-static and allow the ellipse to shift and rotate. Specifically, we minimize the total energy of the springs at time ,
| (2) |
where is the matrix describing a rotation by . An implementation of this minimization procedure revealed that the shift of the cell’s center is small ( 5%) compared to the translation of the cell for most of our model parameters and only became significant for small ratios of . To compute the resulting traction stress, , we tile the substratum into 0.05 0.05 squares and compute the total force per area for each tile.
The force dependence of the off-rate is approximated by an exponential factor Bell (1978),
| (3) |
where we have defined the dimensionless parameter . The molecular length scale characterizes the width of the potential well which prevents the adhesive bridge from breaking and is of the order of 1 nm Bell (1978).
Attachment of bridges to the substratum is assumed to occur with a force-independent rate constant . Binding rates decrease exponentially with the distance between membrane and substratum Décavé et al. (2002b). Therefore we assume that attachment occurs only inside the contracted ellipse. We assume that is uniform across the contact area. The density of bridges on the membrane is assumed to be constant, such that the total number of available bridges that can attach at time is proportional to the area of the contact area .
The uniform contraction builds up stress and, consequently, a number of foci will detach during the contraction phase. To calculate the speed of the cell we first compute the smallest value of the -component for all attached foci, , at the start of the contraction cycle. This corresponds to the left-most attachment point in Fig. 1a. At the end of one contraction cycle, we determine the focus with the smallest value of the -component, (left-most point in Fig. 1c). Then, the speed of the cell is given by . For each parameter set, we performed 1000 independent contraction cycles and parameter values were chosen such that there is at least 1 remaining attachment point.
II.3 Elastic Substratum Model
Traction force experiments that measure the position of fluorescent beads require the use of deformable substrata. The observed deformations are typically m del Álamo et al. (2007), comparable to the typical length of adhesion molecules Marshall et al. (2006). Under these conditions, the adhesive bridges cannot be treated as non-interacting springs. Rather, the elongation of a bridge under a prescribed cell contraction is influenced by the amount of substratum deformation caused by neighboring springs.
To capture this effect, we simulated a deformable substratum with Young’s modulus as a two-dimensional triangular network of springs with spring constant and rest length . In these simulations, the initial conditions, the on and off rates of the cell nodes and the contraction procedure are the same as described above. Now, however, we need to compute the new positions of the triangular mesh vertices after each timestep. For this, we compute the total energy, given by
| (4) |
Here, is the position of the i-th triangular mesh vertex at time . The first sum in Eq. 4 extends over all pairs of neighbors in the triangular grid and the second sum runs over the substratum nodes that are coupled to adhesive springs. For simplicity, we have chosen boundary conditions in which the position of the substratum boundaries are fixed. Minimization of Eq. 4 directly yields the new positions of the vertices and, thus, the deformation pattern of the substratum. The force exerted on the attachment point by the cell node can be calculated as . The total force on each attachment point is then the sum over all nodes connected to this point. These point forces are related to the local applied stress via
| (5) |
Note that our choice for the boundary condition will lead to non-zero net forces on the cell. We found, however, that for a substratum of sufficient size (4Rx4R) the net force is less then 5% of the pole force. Of course, by repositioning the cell after each time step we could ensure a vanishing net force even in the case of fixed boundaries. Furthermore, choosing periodic boundary conditions for the substratum will also guarantee a vanishing net force on the cell. We found that the resulting force pattern differs only slightly from the force pattern generated using fixed boundaries, demonstrating that the results are insensitive to the precise details of the numerical algorithm.
II.4 Parameter Estimates
Throughout the paper we will use a default set of parameters that were obtained, where possible, from experimental data. The shape of the cell is characterized by a long semi-axis, taken to be 10m, and an aspect ratio 1:4. Based on movies shown as supplemental material to Ref. del Álamo et al. (2007) and direct measurements of the adhesion area in Refs. Schindl et al. (1995); Weber et al. (1995), we assume that the (WT) cell contracts by 50% of its length, corresponding to in our simulations, during a contraction period of =1 min.
For the number of adhesive bridges we followed Refs. Décavé et al. (2002b) and chose . Note, however, that our results do not depend on as long as we rescale the other model parameters appropriately. Specifically, if we need to rescale and as follows: and . The off-rates are estimated in models of shear flow induced detachment Décavé et al. (2002a, b) and at the back we take 1 /sec. As discussed before, there is no clear data on the possible maturation of adhesion sites in Dictyostelium and we have arbitrarily chosen the off-rates at the front to be equal to 0.5. The force dependence of the off-rate in Eq. 3 is determined by the dimensionless parameter which we have chosen to be 125. This parameter is a combination of the rupture width of the molecular bond and the adhesive spring constant . We have chosen the latter to be N/m, which is in the range of experimental values Marshall et al. (2006), and nm Bell (1978). Finally, the spring constant of the deformable substratum was estimated using the experiments results in Ref. del Álamo et al. (2007). There, the pole force was found to be 200 pN while the deformation was m, leading to N/m.
III Numerical Analysis and Results
III.1 Rigid substratum
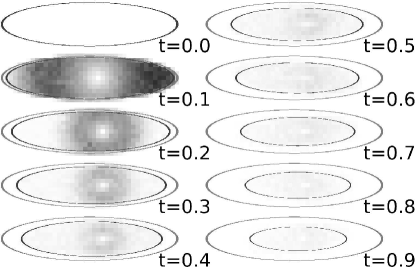
With the above choice of parameters, we performed 1000 contraction cycle simulations. At time intervals the distribution of displacements was stored. The displacements and are directly related to the traction forces exerted on the substratum via . Fig. 3 shows the time evolution of the stress averaged over 1000 individual runs. Here, forces were summed up in bins of size 0.05 0.05 . Note, that the ellipses in our simulations correspond to the adhesion area which does not necessarily correspond to the experimentally determined cell outline del Álamo et al. (2007); Lombardi et al. (2007).
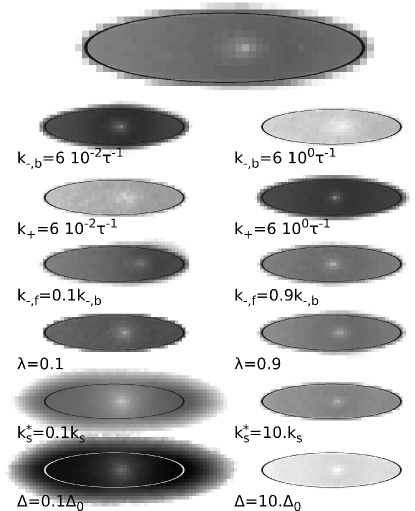
Fig. 4 shows the force distribution averaged over time for different choices of model parameters. Averaging was done by scaling individual time frames such that the contracted ellipses fall on top of each other. The top pattern corresponds to the average stress pattern for the default parameters. In each row of images, we have varied one of these parameters and have plotted the stress pattern using a gray-scale with black corresponding to large stresses. Surprisingly, variations in the amount of contraction and the relative adhesiveness have only little influence on the stress pattern. Rather, it depends more strongly on the basal detachment/attachment dynamics via and , along with the molecular length scale and the spring constant .
In Fig. 5 we plot the dependence of the pole forces on the model parameters as a function of time during a contraction cycle. The pole force at the back, , is defined as the total force exerted in the direction of motion, i.e.
| (6) |
Similarly, the pole force at the front, , comprises all forces which point into the negative -direction. Our definition of the pole forces differs from the one in Ref. del Álamo et al. (2007), where pole forces are defined as the overall forces transmitted at the attachment regions in the front and back halves of the cell. In each graph we used the default parameter set and varied one value as indicated in the legend.
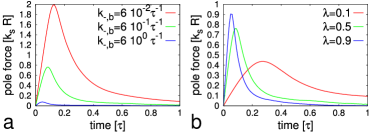
In Fig. 6 we compare the dependence of the cell speed on four model parameters. In our model, this speed is determined by the amount of retraction at the rear of the cell per contraction cycle: during the protrusion phase the ellipse representing the protruded cell outline is moved such that the rear coincides with the last remaining attached focus. The actual forward motion is accomplished throughout the contraction and protrusion phase (see Fig. 1). Note that even for a symmetric detachment the cell can move forward. Again, we varied one parameter value with the remaining parameters fixed at the default values. Finally, in Fig. 7 we plot the average pole force during a single motility cycle as a function of the off-rate . As expected, the pole force decreases as the off-rate increases.


III.2 Elastic Substratum
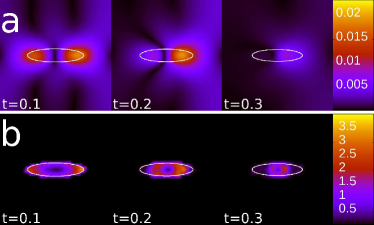
Fig. 8a shows a time series of the displacement pattern for an elastic substratum. The displacement is shown using the indicated color scale and the computed maximal displacements m are in good agreement with experimental results. Due to rapid detachment, substratum deformations vanish shortly after onset of contraction. Fig. 8b shows the corresponding stress distribution which shows two distinct peaks at the front and the back corresponding to regions of maximal displacement in Fig. 8a. The computed maximal stresses (Pa) are similar to the ones observed in experiments (Pa del Álamo et al. (2007)).
IV Discussion
In this paper we have presented a mathematical model for cell motility motivated by experimental observations of the motion of Dictyostelium cells. The emphasis of our model is on the interaction between the cell membrane and the substratum on which the cell is crawling while the actual cell deformation and translation are not explicitly taken into account. There are several distinct differences between our approach and previous modeling studies. The studies carried out by Lauffenburger and co-workers DiMilla et al. (1991), for example, considered a one-dimensional cells with only a handful of attachment points. These points were connected through springs that are exhibiting a prescribed force. In our model, on the other hand, the foci are moving with a constant contraction rate. This choice was motivated in part by the observed stress and force patterns in traction force experiments. These experiments demonstrate that the forces are maximal within the contact area. In a model where the inter-foci springs exert a fixed force, the force field within the interior of the contact area will be very small and concentrated at its boundary. Furthermore, experiments on TalinA- cells del Álamo et al. (2007) demonstrate that cells with a vastly reduced adhesion move with roughly the same velocity as wild-type cells. A prescribed force model would predict a strong dependence of the cell’s speed on the adhesion strength.
Another major difference is the presence of dashpots, representing the viscous nature of the cell’s cytoplasm, in the earlier models. These dashpots play an important role if one prescribes the force exerted by contractile elements. Here, however, we prescribe the contraction velocity which alleviates the need for an explicit modeling of the viscous cytoplasm. The estimation of the contraction speed we used in our simulations, m/min, is based on direct experimental observations. However, typical in vitro myosin velocities measured in motility assays are times higher than the experimentally observed cell speeds Riveline et al. (1998); Murphy et al. (2001). The in vivo velocity is not known but will likely be of the order of the contraction speed. The mechanism responsible for this significant slow down is, to our knowledge, unclear. One possibility is that in vivo the disordered structure of the actin-myosin cortex hinders a rapid contraction. Also, the viscosity of the cytoplasm may play an important role in limiting the myosin contraction speed. A final difference is that our two-dimensional model explicitly takes into account the displacement of the rear.
Another class of models describe the cell as a gel, with visco-elastic properties Bottino et al. (2002); Gracheva and Othmer (2004); Larripa and Mogilner (2006). Contrary to our model, these studies prescribe the protrusion of the cell and do not focus on the contraction mechanism. In these models, the adhesion has a front-to-back gradient and is represented by an effective friction force. Thus, they are unable to address the role of contraction on the detachment of crawling cells.
Most of our results are obtained assuming that the substratum is rigid, corresponding to a typical experimental set-up where cells are crawling on glass surfaces. In this case, the displacement of the adhesion proteins is much larger than the displacement of the attachment point at the substratum. Thus, the force field exerted on the substratum is simply determined by the forces on the adhesion proteins. As expected, this average traction force varies during the contraction cycle and reaches its maximum shortly after the start of the cycle (Fig. 3). The pattern observed in Figs. 3 and 4 can be explained by realizing that in our model stress is generated by a prescribed isotropic contraction. This leads to radial increase of stress at the adhesions which, in the absence of binding/unbinding dynamics, is given by the geometry of the contraction only. Thus, in our model the binding sites at the center of the adhesion zone are always almost stress free, resulting in the observed pattern.
The default set of parameters of our model were based, where possible, on experimental values. To examine the effect of these parameters on the force patterns, we have systematically changed one while keeping the remaining parameters fixed (Fig. 4). The stress pattern depends strongly on the molecular length scale with the stress increasing for smaller values of . This parameter determines the off-rate of the bridges (Eq. 3) and for small values of , this rate becomes small. Correspondingly, the force per focus becomes large, leading to large stresses shown in Fig. 4. Note that the parameter also controls the off-rate. A change in , however, does not change the force pattern as dramatically as a change in since this parameter determines the force per bridge as well.
The relative adhesiveness measures the asymmetry in the adhesion strength between the front and the back of the cell. Such an asymmetry is essential to the motility of mammalian cell but its role in Dictyostelium movement is unclear. Variations in the amount of the relative adhesiveness have only little influence on the magnitude of the observed stress pattern. The pattern, however, becomes more asymmetric as decreases. Clearly, a larger off-rate at the front than at the back will lead to a higher concentration of attached bridges at the front and thus a larger stress in the front half of the cell.
The parameter describes the amount of contraction. In the absence of detachment, a larger contraction would lead to an increase in the elongation of the bridges and a larger force per area. However, the increased force on the foci will lead to an increase in the detachment and, as can be seen from Fig. 4, these two effects compensate and lead to a slightly smaller time averaged stress for larger contractions.
The on-rate describes the re-attachments of foci and increasing the value of will result in an increase in the number of attached foci during the contraction cycle. Thus, the force per area increases for increasing values of , as is evident from Fig. 4. The off-rate , on the other hand, determines the detachment dynamics of the foci. A higher value of leads to a smaller number of attached foci and thus a smaller force per area.
The pole forces, defined as the sum of all the forces parallel or anti-parallel to the direction of the motion, increase rapidly and linearly at the start of the contraction cycle (see Fig. 5). This linear behavior can be understood by realizing that during the initial contraction period, the force dependence of the off-rates is insignificant and the number of bridges stays roughly constant. Since the force on each adhesion is proportional to the contraction ratio, the pole force increases linearly. Once force induced detachment becomes significant the bridges begin to break and the pole force starts to decrease. The maximum pole force, and the time at which this maximum is reached, depend on the model parameters (Fig. 5). In particular, the maximum value increases for smaller values of (Fig. 5a). After all, small values of the off rate lead to larger displacements and, thus, larger forces. Furthermore, the pole force increases for larger values (Fig. 5b) which can be understood by realizing that small contractions lead to small displacements and thus smaller pole forces.
Using our model, we are able to vary systemically each parameter and determine the dependence of the speed on this parameter. The results (Fig. 6) can be viewed as experimental predictions even though we realize it might be difficult to vary some of these parameters in experiments. In particular, it is not always obvious which adhesion parameter is probed in a certain experiment and how the parameters are changed in a certain mutation. For example, the reduced adhesiveness of TalinA- mutant may result from an increased off-rate or from a smaller total number of adhesive sites. Surprisingly, we find that the speed is only weakly dependent on the relative adhesiveness . This is in contrast to previous models where the speed depends critically on this ratio. Our model assumes that the protrusion is decoupled from the contraction cycle (Fig. 1). Thus, our speed is mainly determined by the peeling velocity of the back and can be significant even for uniform off rates. Note that for small relative adhesiveness it becomes important to ensure a vanishing net force through a re-orientation of the cell outline. Without this re-orientation the cell’s speed would be purely given by the off-rate at the back and would be constant for all values of the relative adhesiveness.
As expected, we find that the cell speed increases for increasing values of the contraction rate (Fig. 6b). After all, in the limit of vanishing contraction rate the speed approaches zero while for maximal contraction rate the speed reaches a maximum. Furthermore, we find that high on-rates decrease the speed (Fig. 6c). For high values of , adhesive bridges are deposited at rates that are higher than the detachment rates, limiting the cell’s speed.
Contrary to previous studies, we find that the speed does not depend strongly on the off-rate (Fig. 6d). Of course, the speed will approach 0 for very small values of this off-rate where the foci will remain attached to the substratum. In this limit, we expect that our constant contraction speed assumption is no longer valid and that the forces on the myosin motors are large enough to lead to stalling. For large values of the off-rate, all foci will detach and we have only considered the range of values for which at least one focus remains attached. In fact, in this limit the weakly adherent cells can exert only small forces on the substratum, see Fig. 7. Hence, for sufficiently large , the traction force that balances the viscous drag of the protruding cell (pN del Álamo et al. (2007)) exceeds the detachment force. For approximately symmetric cells, force balance then implies that a forward protrusion is accompanied by a backward motion of the same order. Hence, there is no net motion for sufficiently large . For the parameter range studied, the traction force is always sufficient to support protrusive forward motion, see Fig. 7.
Our finding that the cell speed is roughly constant for a large range of values of adhesive forces is in agreement with recent experiments in which the stress patterns of crawling Dictyostelium cells were examined. These experiments show that the cell motion can be described by a contraction-relaxation-protrusion cycle. Thus, the cell’s speed is determined by the ratio of the displacement per cycle and the period of this cycle. TalinA- cells exhibit a drastically reduced cell-substratum adhesion but were found to have the same cell speed as wild-type cells, with an identical period and, thus, identical displacement. Of course, two data points cannot rule out a significant dependence of the cell speed on the adhesion strength and a definitive test of our model would be to examine the cell speed for different mutants. One candidate would be cells in which the expression level of PaxB, the Dictyostelium orthologue of paxillin, is altered. Both PaxB- cells Bukharova et al. (2005) and cells in which PaxB is overexpressed Duran et al. (2009) exhibit a decrease in cell-substratum adhesion. The cell speed in cAMP gradients is reduced in PaxB overexpressed cells and is increased in PaxB- cells. Interestingly, the cell speed in folate gradients is largely independent of the expression level of PaxB (Duran et al. (2009) and D. Brazill, personal communication). This might indicate a PaxB role in the periodicity of the motion cycle, which would effect the cell’s speed. A more detailed analysis of these mutants that can measure force patterns and motility cycles would be interesting.
A quantitative comparison with the experimentally obtained stress patterns is only possible if we take into account a deformable substratum. After all, these experiments measure the displacement of fluorescent beads embedded in the substratum and require significant movement of these beads. Thus, our model assumption that the displacement of the substratum is negligible compared to the stretching of the adhesive bonds is no longer valid. To compare to experiments, we have extended our model and have explicitly simulated a triangular spring network, representing the substratum. This extension renders the simulations computationally more demanding and we have only performed a limited set of simulations (Fig. 8). Using experimental values characterizing the substratum, we found that our results show a quantitative and qualitative agreement with the experimentally observed stress and strain patterns. For our experimentally based parameter values we obtained a maximum displacement that was comparable to the one observed in experiments (m). Furthermore, the computed peak stress is similar to the experimental peak stress: 40 Pa vs. 50 Pa.
In summary, we have presented a simple model for the motion of Dictyostelium cells. We have shown that this model can produce a number of experimentally verifiable predictions and can be extended to include deformable substrata. Our strongest prediction, that the cell speed is largely independent of the value of the adhesive forces, should be testable using force cytometry experiments. Our model focused on the cell-substratum interaction and ignored the protrusion phase of the motility cycle. Extensions that include intra-cellular signaling pathways that drive cell deformations are currently under investigation.
This work was supported by the National Institutes of Health Grant P01 GM078586. LMS was partly supported by NSF grant DMS 0553487, and would like to thank the Center for Theoretical Biological Phyiscs for hospitality. MB gratefully acknowledges support from a German Academic Exchange Service (DAAD) fellowship. We thank Juan C. del Álamo and William F. Loomis for useful discussions.
References
- Franz et al. (2002) Franz, C. M., G. E. Jones, and A. J. Ridley, 2002. Cell Migration in Development and Disease. Dev. Cell 2:153 – 158.
- Baggiolini (1998) Baggiolini, M., 1998. Chemokines and leukocyte traffic. Nature 392:565–568.
- Wang et al. (2005) Wang, W., S. Goswami, E. Sahai, J. B. Wyckoff, J. E. Segall, and J. S. Condeelis, 2005. Tumor cells caught in the act of invading: their strategy for enhanced cell motility. Trends Cell Biol. 15:138–145.
- Condeelis et al. (2004) Condeelis, J., X. Song, J. M. Backer, J. Wyckoff, and J. Segall, 2004. Cell Motility, chapter Chemotaxis of Cancer Cells during Invasion and Metastasis, 175–188.
- Kedrin et al. (2007) Kedrin, D., J. van Rheenen, L. Hernandez, J. Condeelis, and J. Segall, 2007. Cell Motility and Cytoskeletal Regulation in Invasion and Metastasis. J. Mammary Gland Biol. Neoplasia 12:143–152.
- Rafelski and Theriot (2004) Rafelski, S. M., and J. A. Theriot, 2004. Crawling Toward a Unified Model of Cell Motility: Spatial and Temporal Regulation of Actin Dynamics. Ann. Rev. Biochem. 73:209–239.
- Mogilner (2009) Mogilner, A., 2009. Mathematics of cell motility: have we got its number? J. Math. Biol. 58:105–134.
- Lauffenburger and Horwitz (1996) Lauffenburger, D. A., and A. F. Horwitz, 1996. Cell Migration: A Physically Integrated Molecular Process. Cell 84:359 – 369.
- Lee and Jacobson (1997) Lee, J., and K. Jacobson, 1997. The composition and dynamics of cell-substratum adhesions in locomoting fish keratocytes. J. Cell. Sci. 110:2833–2844.
- Laukaitis et al. (2001) Laukaitis, C. M., D. J. Webb, K. Donais, and A. F. Horwitz, 2001. Differential Dynamics of alpha5 Integrin, Paxillin, and alpha-Actinin during Formation and Disassembly of Adhesions in Migrating Cells. J. Cell. Biochem. 153:1427–1440.
- Kaverina et al. (2002) Kaverina, I., O. Krylyshkina, and J. Small, 2002. Regulation of substrate adhesion dynamics during cell motility. Int. J. Biochem. Cell. Biol. 34:746 – 761.
- Parent and Devreotes (1999) Parent, C. A., and P. N. Devreotes, 1999. A Cell’s Sense of Direction. Science 284:765–770.
- Noegel and Schleicher (2000) Noegel, A., and M. Schleicher, 2000. The actin cytoskeleton of Dictyostelium: a story told by mutants. J. Cell. Sci. 113:759–766.
- Kessin (2001) Kessin, R. H., 2001. Dictyostelium : evolution, cell biology, and the development of multicellularity. Cambridge University Press, Cambridge, UK ; New York.
- del Álamo et al. (2007) del Álamo, J. C., R. Meili, B. Alonso-Latorre, J. Rodríguez-Rodríguez, A. Aliseda, R. A. Firtel, and J. C. Lasheras, 2007. Spatio-temporal analysis of eukaryotic cell motility by improved force cytometry. Proc. Natl. Acad. Sci. 104:13343–13348.
- Lombardi et al. (2007) Lombardi, M. L., D. A. Knecht, M. Dembo, and J. Lee, 2007. Traction force microscopy in Dictyostelium reveals distinct roles for myosin II motor and actin-crosslinking activity in polarized cell movement. J. Cell. Sci. 120:1624–1634.
- Uchida and Yumura (2004) Uchida, K. S. K., and S. Yumura, 2004. Dynamics of novel feet of Dictyostelium cells during migration. J. Cell. Sci. 117:1443–1455.
- Iwadate and Yumura (2008) Iwadate, Y., and S. Yumura, 2008. Actin-based propulsive forces and myosin-II-based contractile forces in migrating Dictyostelium cells. J. Cell. Sci. 121:1314–1324.
- Simson et al. (1998) Simson, R., E. Wallraff, J. Faix, J. Niewöhner, G. Gerisch, and E. Sackmann, 1998. Membrane Bending Modulus and Adhesion Energy of Wild-Type and Mutant Cells of Dictyostelium Lacking Talin or Cortexillins. Biophys. J. 74:514 – 522.
- Décavé et al. (2002a) Décavé, E., D. Garrivier, Y. Bréchet, B. Fourcade, and F. Bruckert, 2002. Shear Flow-Induced Detachment Kinetics of Dictyostelium discoideum Cells from Solid Substrate. Biophys. J. 82:2383 – 2395.
- Jay et al. (1995) Jay, P. Y., P. A. Pham, S. A. Wong, and E. L. Elson, 1995. A mechanical function of myosin II in cell motility. J. Cell. Sci. 108:387–393.
- Duran et al. (2009) Duran, M. B., A. Rahman, M. Colten, and D. Brazill, 2009. Dictyostelium discoideum Paxillin Regulates Actin-Based Processes. Protist 160:221 – 232.
- DiMilla et al. (1991) DiMilla, P. A., K. Barbee, and D. A. Lauffenburger, 1991. Mathematical model for the effects of adhesion and mechanics on cell migration speed. Biophys. J. 60:15 – 37.
- Bottino and Fauci (1998) Bottino, D. C., and L. J. Fauci, 1998. A computational model of ameboid deformation and locomotion. Eur. Biophys. J. 27:p532 –.
- Gracheva and Othmer (2004) Gracheva, M. E., and H. G. Othmer, 2004. A continuum model of motility in ameboid cells. Bull. Math. Biol. 66:167 – 193.
- Larripa and Mogilner (2006) Larripa, K., and A. Mogilner, 2006. Transport of a 1D viscoelastic actin-myosin strip of gel as a model of a crawling cell. Phys. A 372:113 – 123.
- Palecek et al. (1997) Palecek, S. P., J. C. Loftus, M. H. Ginsberg, D. A. Lauffenburger, and A. F. Horwitz, 1997. Integrin-ligand binding properties govern cell migration speed through cell-substratum adhesiveness. Nature 385:537–540.
- Bottino et al. (2002) Bottino, D., A. Mogilner, T. Roberts, M. Stewart, and G. Oster, 2002. How nematode sperm crawl. J. Cell. Sci. 115:367–384.
- Riveline et al. (1998) Riveline, D., A. Ott, F. Jülicher, D. A. Winkelmann, O. Cardoso, J.-J. Lacapère, S. Magnúdóttir, J. L. Viovy, L. Gorre-Talini, and J. Prost, 1998. Acting on actin: the electric motility assay. Eur. Biophys. J. 27:p403 –.
- Hänggi et al. (1990) Hänggi, P., P. Talkner, and M. Borkovec, 1990. Reaction-rate theory: fifty years after Kramers. Rev. Mod. Phys. 62:251–341.
- Sabouri-Ghomi et al. (2008) Sabouri-Ghomi, M., Y. Wu, K. Hahn, and G. Danuser, 2008. Visualizing and quantifying adhesive signals. Curr. Opin. Cell Biol. 20:541 – 550.
- Huttenlocher et al. (1997) Huttenlocher, A., S. P. Palecek, Q. Lu, W. Zhang, R. L. Mellgren, D. A. Lauffenburger, M. H. Ginsberg, and A. F. Horwitz, 1997. Regulation of Cell Migration by the Calcium-dependent Protease Calpain. J. Biol. Chem. 272:32719–32722.
- Bell (1978) Bell, G. I., 1978. Models for the specific adhesion of cells to cells. Science 200:618–627.
- Décavé et al. (2002b) Décavé, E., D. Garrivier, Y. Bréchet, F. Bruckert, and B. Fourcade, 2002. Peeling Process in Living Cell Movement Under Shear Flow. Phys. Rev. Lett. 89:108101.
- Marshall et al. (2006) Marshall, B. T., K. K. Sarangapani, J. Wu, M. B. Lawrence, R. P. McEver, and C. Zhu, 2006. Measuring Molecular Elasticity by Atomic Force Microscope Cantilever Fluctuations. Biophys. J. 90:681–692.
- Schindl et al. (1995) Schindl, M., E. Wallraff, B. Deubzer, W. Witke, G. Gerisch, and E. Sackmann, 1995. Cell-substrate interactions and locomotion of Dictyostelium wild-type and mutants defective in three cytoskeletal proteins: a study using quantitative reflection interference contrast microscopy. Biophys. J. 68:1177 – 1190.
- Weber et al. (1995) Weber, I., E. Wallraff, R. Albrecht, and G. Gerisch, 1995. Motility and substratum adhesion of Dictyostelium wild-type and cytoskeletal mutant cells: a study by RICM/bright-field double-view image analysis. J. Cell. Sci. 108:1519–1530.
- Murphy et al. (2001) Murphy, C. T., R. S. Rock, and J. A. Spudich, 2001. A myosin II mutation uncouples ATPase activity from motility and shortens step size. Nat. Cell Biol. 3:311–315.
- Bukharova et al. (2005) Bukharova, T., T. Bukahrova, G. Weijer, L. Bosgraaf, D. Dormann, P. J. van Haastert, and C. J. Weijer, 2005. Paxillin is required for cell-substrate adhesion, cell sorting and slug migration during Dictyostelium development. J. Cell. Sci. 118:4295–4310.