The minor role of gas-rich major mergers in the rise of
intermediate-mass early types at
Abstract
We study the evolution of galaxy structure since to the present. From a Great Observatories Origins Deel Survey South (GOODS-S) multi-band catalog we define (blue) luminosity- and mass-weighted samples, limited by and , comprising 1122 and 987 galaxies, respectively. We extract early-type (ET; E/S0/Sa) and late-type (LT; Sb-Irr) subsamples by their position in the concentration–asymmetry plane, in which galaxies exhibit a clear bimodality. We find that the ET fraction, , rises with cosmic time, with a corresponding decrease in the LT fraction, , in both luminosity- and mass-selected samples. However, the evolution of the comoving number density is very different: the decrease in the total number density of galaxies since is due to the decrease in the LT population, which accounts for % of the total star formation rate in the range under study, while the increase in the total number density of galaxies in the same redshift range is due to the evolution of ETs. This suggests that we need a structural transformation between LT galaxies that form stars actively and ET galaxies in which the stellar mass is located. Comparing the observed evolution with the gas-rich major merger rate in GOODS-S, we infer that only 20% of the new ET galaxies with appeared since can be explained by this kind of mergers, suggesting that minor mergers and secular processes may be the driving mechanisms of the structural evolution of intermediate-mass () galaxies since .
Subject headings:
galaxies:evolution – galaxies:interactions – galaxies:structure1. introduction
Local galaxies present two main populations in the color-magnitude diagram: the red sequence, formed primarily by old, spheroidal quiescent galaxies, and the blue cloud, formed primarily by spiral star-forming galaxies (Strateva et al., 2001; Baldry et al., 2004). It is now well established that such bimodality is present at higher redshifts (Bell et al. 2004, up to ; Cassata et al. 2008; Ilbert et al. 2010, up to ; Kriek et al. 2008, at ), and appears to be strongly linked to mass: more massive galaxies were the first to finish forming their stars and populating the red sequence. This mass dependence has been dubbed downsizing (Cowie et al., 1996): massive galaxies having experienced most of their star formation at early times and being passive by , and many among the less massive galaxies experience extended star-formation histories (see Bundy et al., 2006; Scarlata et al., 2007a; Pérez-González et al., 2008, and references therein).
These results are not immediately expected from the popular hierarchical -CDM models, in which the more massive dark matter halos are the final stage of successive mergers of smaller halos. However, whether downsizing poses an important problem for -CDM depends on the correct understanding of the baryonic physics, for which models are making recent progress (see Bower et al., 2006; De Lucia & Blaizot, 2007; Stewart et al., 2009; Hopkins et al., 2009d, and references therein), as well as on proper accounting of the dependency of the halo merger history with environment. Because of that, the role of galaxy mergers in the buildup of the red sequence, and their impact on the evolution of galaxy properties, i.e., color, mass, or structure, remains an important open question.
In addition, the redshift evolution of the mass function suggests that the red sequence grows because star formation is quenched in the blue cloud (Bell et al., 2007; Ruhland et al., 2009). Because 80% of red sequence galaxies are morphological early types (ETs) at (E/S0/Sa, Strateva et al., 2001; Lotz et al., 2008b), and because the star formation is located in spiral galaxies (Bell et al., 2005; Jogee et al., 2009), the blue-to-red transition may be accompanied by a late- to ET transformation.
In this paper we study the role of gas-rich major mergers, selected by morphological criteria, in the structural evolution of galaxies since . In a previous paper, López-Sanjuan et al. (2009a, hereafter L09), we study the major merger rate evolution in GOODS-S, finding that only % of galaxies with have undergone a gas-rich major merger since . Our goal is, first to quantify the structural evolution, and, second, to compare it against the merger rate.
The paper is organized as follows: in Section 2 we summarize the GOODS-S data set used, and in Section 3 we develop the methodology to determine the fractions of ET and late-type (LT) galaxies versus redshift. Then, in Section 4 we summarize the obtained early- and LT fractions and comoving number densities, and their evolution with , while in Section 5 we study the role of gas-rich major mergers in the observed ET evolution. Finally, we present our conclusions in Section 6. We use , , and throughout. All magnitudes are Vega unless noted otherwise.
2. GOODS-S data set
2.1. Galaxy samples
We work with the galaxy catalog from
the Great Observatories Origins Deep Survey South (GOODS-S)111http://www.stsci.edu/science/goods/ field by the Spitzer Legacy Team
(Giavalisco et al., 2004). We used the Version 1.0
catalogs222http://archive.stsci.edu/prepds/goods/ and reduced mosaics in
the (), (), (), and
() Hubble Space Telescope/Advanced Camera for Surveys (HST/ACS) bands. These catalogs were cross-correlated using a
search radius with the GOODS-S Infrared Array Camera (IRAC) selected sample in the
Rainbow cosmological database333http://guaix.fis.ucm.es/pgperez/Proyectos/
ucmcsdatabase.en.html published in Pérez-González et al. (2008, see also and G.
Barro et al., in preparation), which provided us spectral energy
distributions (SEDs) in the UV-to-MIR range, well-calibrated and with reliable
photometric redshifts, stellar masses, star formation rates, and rest-frame
absolute magnitudes.
We refer the reader to the mentioned papers for a more detailed description of the data included in the SEDs and the analysis procedure. Here, we summarize briefly the main characteristics of the data set. The Rainbow database contains consistent aperture photometry in several UV, optical, NIR, and MIR bands with the method described in Pérez-González et al. (2008). UV-to-MIR SEDs were built for IRAC sources in the GOODS-S region down to a 75% completeness magnitude 23.5 mag (AB). These SEDs were fitted to stellar population and dust emission models to obtain estimates of the photometric redshift (), the stellar mass (), and the rest-frame B-band absolute magnitude ().
Rest-frame absolute -band magnitudes were estimated for each source by convolving the templates fitting the SED with the transmission curve of a typical Bessel- filter, taking into account the redshift of each source. This procedure provided us accurate interpolated -band magnitudes including a robustly estimated -correction. Stellar masses were estimated using the exponential star formation PEGASE01 models with a Salpeter (1955) initial mass function (IMF) and various ages, metallicities and dust contents included. The typical uncertainties in the stellar masses are a factor of 2, typical of most stellar population studies (see, e.g. Papovich et al., 2006; Fontana et al., 2006).
The median accuracy of the photometric redshifts at is , with a fraction 5% of catastrophic outliers (Pérez-González et al., 2008, Figure B2). In the present paper we use as uncertainty, where is the standard deviation in the distribution of the variable , that is well described by a Gaussian with mean and (see López-Sanjuan et al. 2009b, for details). We take for sources and for sources.
From the Rainbow catalog described above we defined two samples in the range . One sample is selected in luminosity, ( at ; Faber et al. 2007), which comprises 1122 sources. The value of is 1 mag brighter at than locally (Gabasch et al., 2004; Ilbert et al., 2005; Faber et al., 2007), evolution that reflects the descent in the star formation rate density of the universe since (e.g. Hopkins & Beacom, 2006). Hence, if we assume a constant cut, we select different areas of the luminosity function at each redshift, biasing our results. However, L09 show that asymmetry as reliable morphological indicator in GOODS-S is valid only for galaxies, so we decided to use this constant cut, instead of an evolving one, to ensure good statistics. This selection condition our results, so is important take it into account when we interpret the evolution of the comoving number density of galaxies with redshift (Section 4.1). The second sample is selected in mass, ( at ; Pérez-González et al. 2008), which comprises 987 galaxies. In this case evolves little, if any, since (Pozzetti et al., 2007; Pérez-González et al., 2008; Marchesini et al., 2009), so we decide to use a constant selection in mass that ensures 75% completeness for passively evolving galaxies in the range under study (see L09, for details).
2.2. Morphological Indices
We use concentration (; Abraham et al. 1994) and asymmetry (; Abraham et al. 1996) indices to perform our structural study. Concentration is defined as
| (1) |
where and are the circular radii which contain 20% and 80% of the total galaxy flux, respectively. Concentration correlates with several properties of galaxies, as bulge-to-total ratio (Strateva et al., 2001; Conselice, 2003), absolute -band magnitude (Conselice, 2003), or stellar mass (Conselice, 2006a). For details about concentration measurements see Bershady et al. (2000).
The asymmetry index is defined as
| (2) |
where and are the original galaxy and background images, and are the original galaxy and background images rotated , and the summation spans all the pixels of the images. The background image is a sky source-free section of pixels. This index gives us information over the source distortions and, we can use it to identify recent merger systems which are highly distorted (e.g., Conselice, 2003; De Propris et al., 2007; Bridge et al., 2007; López-Sanjuan et al., 2009b). All details about the measurement of the asymmetry index in the HST/ACS images of GOODS-S sources are given in L09, with similar techniques having been applied for the measurement of the index. To avoid statistical morphological -corrections and to deal with the loss of information with redshift (i.e., spatial resolution degradation and cosmological dimming), we determined and indices in -band rest-frame galaxy images, which were artificially redshifted to a unique, representative redshift, . This provides us an homogeneous data set to perform structural studies in GOODS-S.
| Sample Selection | w/ LSS aaEarly-type fraction in the sample with LSS sources. | w/o LSS bbEarly-type fraction in the sample without LSS sources. | LSS ()ccEarly-type fraction in the LSS. | |
|---|---|---|---|---|
| 72 | ||||
| 94 |
2.3. Major merger rates
We use the major merger rates from L09 thought this paper. In that work, we selected as major merger remnants those galaxies with high values of the asymmetry index (). We performed that study for galaxies up to in the same mass-selected sample that we use in the present paper (Section 2.1), and we took into account the effect of observational errors in and , which overestimate the merger fraction due to the spillover of normal sources to the high-asymmetry regime, by maximum likelihood (ML) techniques developed in López-Sanjuan et al. (2008). We obtain lower merger fractions (%) than other determinations also based on morphology (e.g., Lotz et al., 2008b; Conselice et al., 2009), but are in good agreement with those from López-Sanjuan et al. (2009b) in Groth Strip applying the same methodology as that of ours, and those from Jogee et al. (2009) in Galaxy Evolution from Morphology and SEDs444http://www.mpia.de/GEMS/gems.htm (GEMS) by eye-ball inspection of the sources. To obtain the merger rate () from the merger fraction, we assume Pérez-González et al. (2008) mass functions and a typical timescale of Gyr (Conselice, 2006b, 2009; Lotz et al., 2008a, 2009).
The methodology in L09 is only sensitive to gas-rich major mergers (i.e., at least one of the merging galaxies is a LT, gas-rich galaxy): asymmetry as merger indicator is calibrated in local universe with ultraluminous infrared galaxies (Conselice, 2003), while is determined by -body simulations of gas-rich major mergers (Conselice, 2006b; Lotz et al., 2008a). In a forthcoming paper, we show that nearly all the high-asymmetry galaxies in our sample are also star-forming galaxies, supporting the notion that we are only sensitive to gas-rich mergers (C. Lopez-Sanjuan et al, in preparation).
3. The Concentration-Asymmetry Bimodality
Concentration and asymmetry indices are useful to segregate galaxies by their structure, i.e., bulge-dominated galaxies (E/S0/Sa, ET galaxies in the following), and disk-dominated galaxies and irregulars (Sb-Irr, LT galaxies in the following; Bershady et al. 2000; Lauger et al. 2005a; Menanteau et al. 2006; Yagi et al. 2006; Huertas-Company et al. 2008; Neichel et al. 2008). To segregate galaxies by their morphology we need an index as the cumpliness (S; Conselice 2003), or the bumpiness (B; Blakeslee et al. 2006), which give us information about the distribution of the star formation in the galaxy (van der Wel, 2008). On the other hand, high values of the asymmetry index select gas-rich major merger remnants (Section 2.3).
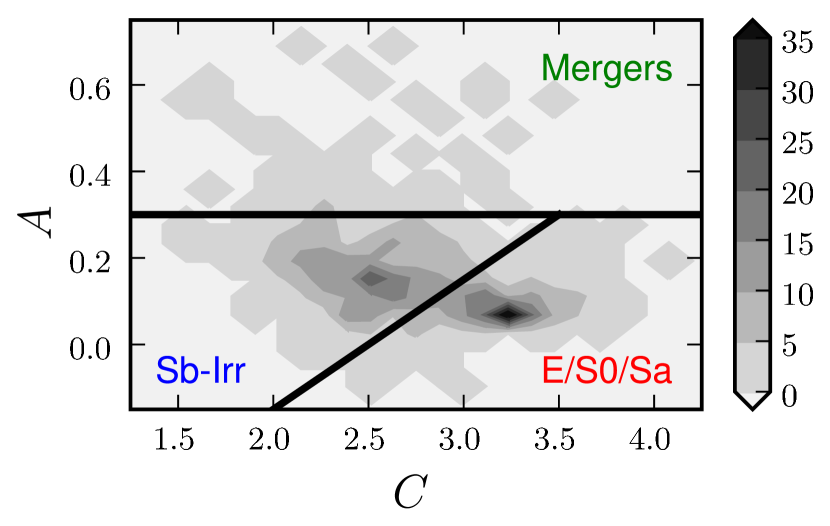
In Figure 1 we show the distribution of the 757 galaxies in the catalog with and , which present two different populations, in agreement with Zamojski et al. (2007) and Conselice et al. (2009). One population is associated with ET galaxies, with its maximum at , and the other with LT galaxies, with its maximum at , as shown by Ilbert et al. (2006). We determined the positions of the two peaks in space as follows: first we fitted the histogram in concentration space with two Gaussians, which gave us the concentration values of the two peaks as well as the minimum between them (). Then, we fitted the asymmetry histogram of and galaxies with a simple Gaussian to obtain the asymmetry maxima. In Figure 1 we also show the three areas that we use to segregate galaxies: gas-rich major mergers (, see L09), ET galaxies (), and LT galaxies (). The limit was chosen to optimize the ET/LT separation (see the following section for details).
3.1. Early- and Late-Type Fraction Determination
The first goal of this paper is to study the fraction of ET () and LT galaxies () as a function of redshift. To obtain reliable ET and LT fractions we used ML techniques. López-Sanjuan et al. (2008) developed a two-dimensional ML method to determine merger fractions from the asymmetry in galaxy images; the method is far superior to classical source counting, as, with source counting, measurement errors cause source spillover to neighboring bins. The ML method has been successfully used to measure the gas-rich merger fraction in Groth strip (López-Sanjuan et al., 2009b) and in GOODS-S (L09), and we apply it here for the determination of and . We refer the reader to López-Sanjuan et al. (2008) for all the details about the ML method and its assumptions. The main difficulty in the application of the ML method in the present study is that it works in two dimensions, whereas our problem has three dimensions: , , and the redshift .
We could work in () space, and use as selection limit the condition , which marks the separation between ET and LT populations in concentration space (see the previous section). However, this selects galaxies with , i.e., gas-rich major mergers, as ET and LT galaxies. Indeed, the separation between ETs and LTs is oblique in Figure 1 and is well described by (drawn in the figure). If we define a second variable , LT galaxies and major mergers have , while ET galaxies have . That is, the fraction of ET galaxies is , while the fraction of LT galaxies is , where is the morphological merger fraction reported by L09. The error in the new variable is .
How are the results affected by the selection limit? We determined with three different limits: , , and . We find that all the values of are consistent within with our preferred condition, , in the three redshift ranges under study, namely, , and . We select these particular ranges to resemble those in L09. Because the particular election of the selection limit does not bias our results, we use the limit in the following.
3.2. Large-Scale Structure Effect
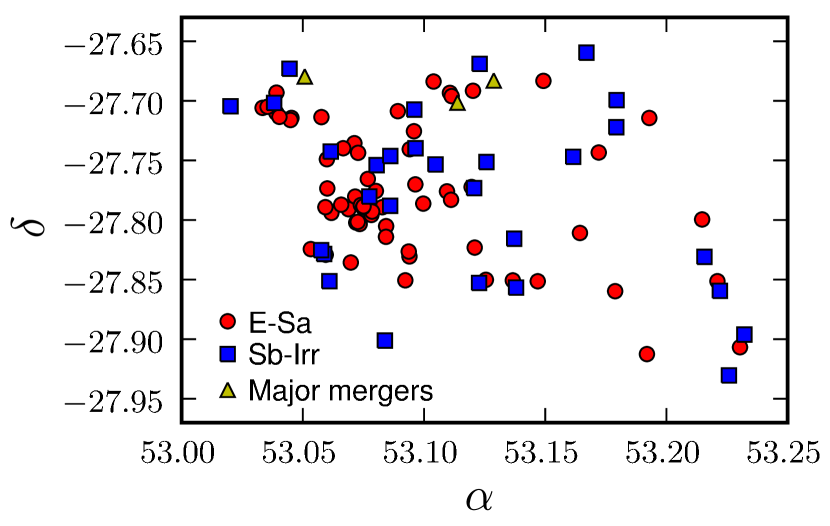
It is well known that the more prominent large-scale structure (LSS) in the GOODS-S field is located at redshift (Ravikumar et al., 2007). The next two more important ones are located at and . The former is an overdensity in redshift space, but not in the sky plane, while the latter is a cluster, but comprises an order of magnitude fewer sources than the structure (145 versus 12, Adami et al. 2005). Because of this, we concentrate on the LSS at and ignore other structures in GOODS-S. In order to check the effect of this LSS in our derived structural fractions, we recalculated the ET fraction in the range by excluding the sources within of (Rawat et al. 2008; L09). In Table 1, we summarize the number of sources in the LSS for each sample (), the ET fractions in the LSS and the ET fractions in the field, both in the samples with and without LSS sources. The value of in the samples without LSS sources is 0.07 lower than the determination in the whole samples. More importantly, both values are incompatible at . This fact explains the high ET fraction found by Lauger et al. (2005b) at that redshift in their GOODS-S field study. Because of this, in the following we use the structural fractions obtained from the samples without LSS sources. On the other hand, , that is, the ET fraction is higher in dense environments. In Figure 2, we show the position in the sky plane of ET (red dots), LT (blue squares), and major mergers (green triangles) for galaxies in the LSS: ET galaxies are concentrated in more populated regions, while LT galaxies are located in the outskirts of the structure, as expected by the morphology-density relation (Dressler, 1980). In addition, the three gas-rich major mergers in the LSS are also located in the outskirts, a natural consequence of the external location of their progenitors, i.e. LT galaxies (see also Heiderman et al. 2009).
.
4. The structural evolution of GOODS-S galaxies
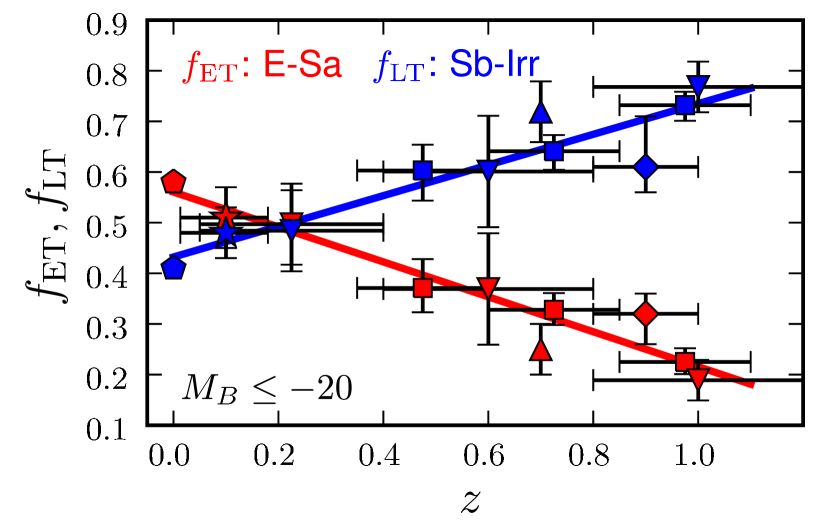
We summarize in Table 2 the structural fractions for galaxies in three redshift ranges: , and . The fraction of ET galaxies increases with cosmic time, while LT galaxies fraction decreases. Note that errors are formal and do not take into account cosmic variance, denoted ; following Somerville et al. (2004), we expect %. In the top panel of Figure 3, we show our results (squares) with those from the literature: diamonds are the ET and LT fractions provide by Lotz et al. (2008b) for galaxies in All-Wavelength Extended Groth Strip International Survey (AEGIS555http://aegis.ucolick.org/; Davis et al. 2007), which mimic our selection criteria at . Pentagons are from Conselice (2006a) for galaxies in the RC3666http://heasarc.nasa.gov/W3Browse/all/rc3.html (Third Reference Catalogue of Bright Galaxies; de Vaucouleurs et al. 1991): we take ET = E/S0 and early-disks, while LT = late-disks and irregulars (his Table 1). Triangles and inverted triangles are obtained integrating the morphological luminosity functions (MLF) provided by Scarlata et al. (2007b) at , and Ilbert et al. (2006) at , respectively. In both cases, we integrated the MLF for galaxies brighter than . Ilbert et al. (2006) perform their study in the GOODS-S field and segregate galaxies in ET/LT by their positions in the plane, a similar methodology to ours. Scarlata et al. (2007b) use Zurich Estimator of Structural Types (ZEST) in Cosmological Evolution Survey (COSMOS777http://cosmos.astro.caltech.edu/index.html; Scoville et al. 2007) to classify 10,000 galaxies in several morphological types: E/S0 (T1), disks (T2, divided in four subtypes by their Sérsic index) and irregulars (T3). We take ET = T1 + T2.0, while LT = T2.1 + T2.2 + T2.3 + T3 , where is the morphological merger fraction at from L09. This selects disks with the Sérsic index as bulge-dominated galaxies (Mandelbaum et al., 2006; Trujillo et al., 2007; Dahlen et al., 2007). Finally, stars are obtained integrating the (ETs) and (LTs) luminosity functions provided by Driver et al. (2006) from Millennium Galaxy Catalog (MGC888http://www.eso.org/jliske/mgc/; Liske et al. 2003). They found that their galaxies present a bimodality in , with a minimum at . In the three previous cases we determine the uncertainty in structural fractions by varying 1, the value of in the integration. The top panel of Figure 3 shows that, when we use a similar luminosity and structural selection, all and are in good agreement. The linear least-squares fit to the data yields
| (3) | |||
| (4) |
With these fits, we infer that ET galaxies are the dominant population by number since .
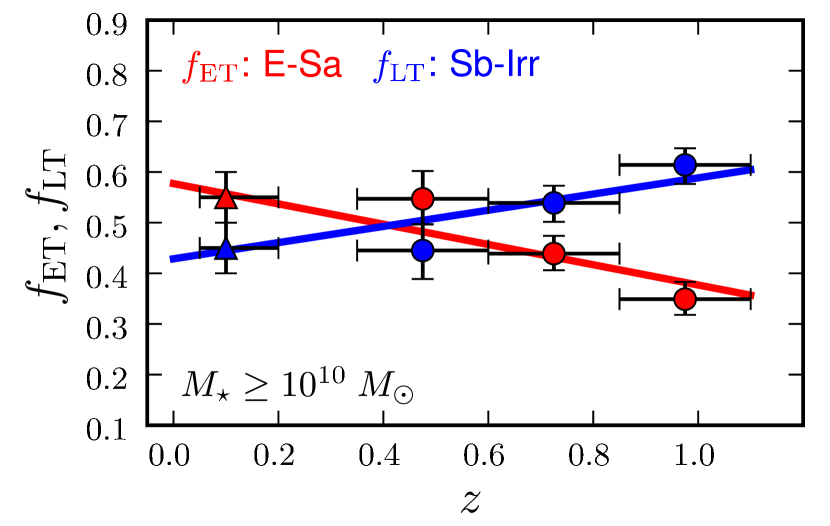
In Table 3 we summarize the structural fractions for galaxies. The fraction of ET galaxies increases with cosmic time, as in the previous case, but in the mass-selected sample is higher than in the luminosity-selected sample in all the redshift intervals under study. In the bottom panel of Figure 3 we show our results (circles) with those from Mandelbaum et al. (2006, triangles). They provide () and () for 33000 galaxies from Sloan Digital Sky Survey (SDSS999http://www.sdss.org/; Adelman-McCarthy et al. 2006). The linear least-squares fit to the data yields
| (5) | |||
| (6) |
With these fits, we infer that ET galaxies are the dominant population by the number since , a higher redshift than in the luminosity-selected sample. Although in the range of study a linear function is a good approximation to the observed evolution, we expect that a power-law function may provide a better parameterization when higher redshift data are available (e.g. Fontana et al., 2009).
4.1. Comoving Number Density Evolution
To better understand the structural evolution of galaxies since , in this section we study the comoving number density of ET () and LT galaxies () as a function of redshift:
| (7) | |||
| (8) |
where is the selection criteria, and is the comoving number density at redshift of galaxies more luminous [massive] than . To obtain , we assume the Faber et al. (2007) luminosity function parameters, while to obtain we assume the Pérez-González et al. (2008) mass function parameters.
| 2.77 | |||
| 3.50 | |||
| 4.28 |
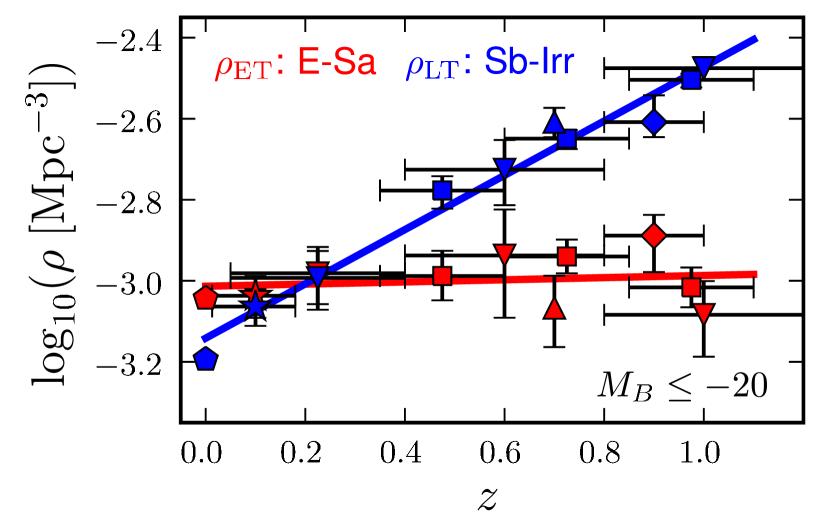
We summarize in Table 4 the comoving number density for galaxies. The number density of LT galaxies decreases with cosmic time, while ET number density is roughly constant. In the top panel of Figure 4, we show the number density data of this work and those from literature, obtaining by applying Equation (7) and (8) to the fractions in Figure 3. The linear least-squares fit to all data yields
| (9) | |||
| (10) |
The number density of LT galaxies at is % the value at
, while constant.
| 6.29 | |||
| 4.83 | |||
| 3.71 |
The total number density of galaxies decreases by a factor of 3 since , a reflection of the global decline in the star formation rate density of the universe as (e.g. Lilly et al., 1996; Hopkins & Beacom, 2006; Pérez-González et al., 2005; Tresse et al., 2007; Villar et al., 2008). Because both the number densities of LT galaxies and that of gas-rich major mergers decrease with cosmic time (e.g. L09), we ask which of these two populations drives the decrease in the star formation rate density of the universe.
We define the ratio between the star formation rate in a given population (SFRpop) and the star formation rate in major merger systems (SFRm) as:
| (11) |
where and are the morphological major merger fraction (i.e., gas-rich, Section 2.3), and the fraction of galaxies of a given population, respectively, is the fraction of galaxies in the population that are forming stars actively, is the star formation in an interacting system respect to the median in isolated galaxies, is the time over which the star formation is enhanced in an interaction, and is the timescale over which one major merger is selected as high-asymmetric source by L09 methodology. In Equation (11), we have assumed that all the gas-rich major mergers have enhanced star formation, and we do not take into account dry mergers, that have negligible star formation. With this definition, the total star formation rate (SFRtot) in a given redshift range is
| (12) |
while the fraction of the total star formation located in major merger systems is
| (13) |
Because most of the red galaxies are ETs (Lotz et al. 2008b), we assume that (i.e., all ET galaxies are passive), and . On the other hand, most of the blue galaxies are LTs (Lotz et al. 2008b), so we take . With these assumptions the star formation rate is more important in LT galaxies than in major merger systems if and vice versa if . To compare the results with previous works, we restrict our study to the range , in which and . We assume that Gyr (L09), (Robaina et al. 2009, see also Lin et al. 2007; Li et al. 2008; Knapen & James 2009), and Gyr (di Matteo et al., 2007; Cox et al., 2008). With these values we obtain , that is, the bulk of the star formation in the range is located in LT galaxies, and major mergers account for 20% of the total star formation rate, in quantitative agreement with Bell et al. 2005, Wolf et al. 2005, Jogee et al. 2009, or Sobral et al. (2009).
Following Robaina et al. (2009), we can also obtain the fraction of SFRtot that is triggered directly by mergers:
| (14) |
If we assume that , as previously, then %, a low value in good agreement with Robaina et al. (2009):
they infer that % in
GEMS101010http://www.mpia-hd.mpg.de/GEMS/gems.htm (Rix et al., 2004), at the same redshift range, and by
studying the correlation function of blue
galaxies. If we repeat this study in the range , we obtain
(i.e., % of the total star formation is located in major mergers at ), and %. Our values are also in good agreement with Hopkins & Hernquist (2009); they inferred the merger-induced burst history up to from the luminosity profiles of local E/S0 galaxies, finding that %–10% of total star formation is triggered by mergers, independently of redshift. Finally, our results are the same if we use the mass-selected sample.
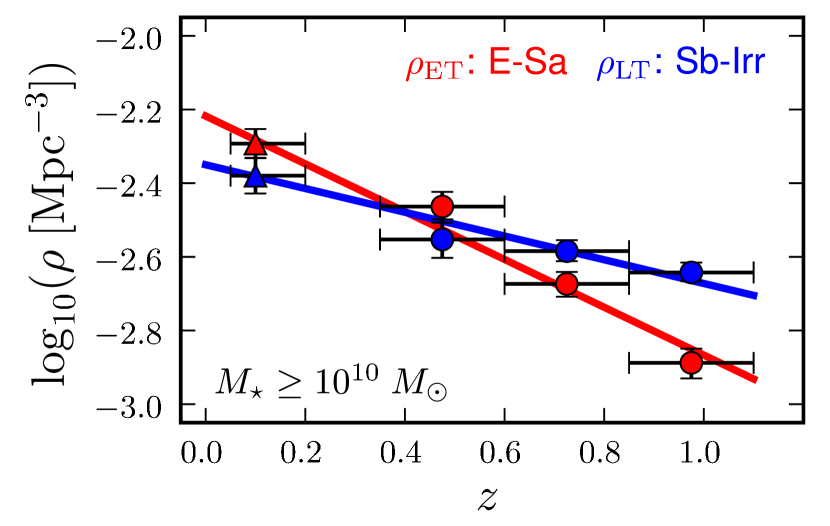
In Table 5, we summarize the number densities for galaxies. In this case the behavior is the opposite than in the luminosity-selected sample: the number densities of ET and LT galaxies increase with cosmic time. This increase is more important for ET galaxies. In the bottom panel of Figure 4, we show the number density data of this work (circles) and those from Mandelbaum et al. (2006, triangles). The linear least-squares fits to the data are
| (15) | |||
| (16) |
The ET population increases its number density by a factor of 5 between and , while LT galaxies increase by a factor of 2 in the same range. Because 40% of galaxies in the local universe are in place at (Pérez-González et al., 2008), the increase in the number density of these galaxies since is primarily due to the increase in . As in the previous section, we expect that a power-law function may provide a better parameterization than the linear when higher redshift data are available (e.g., Taylor et al., 2009). If we fit a power-law function to the data, , we obtain , while Taylor et al. (2009) find for red sequence galaxies. If we assume that most red sequence galaxies are ETs (Lotz et al., 2008b), this implies that red massive galaxies evolve less in number density than less massive ones since , in agreement with Ferreras et al. (2009).
The results of this section suggest that we need a structural transformation in the range between LT galaxies, which form stars actively, and ET galaxies, in which stellar mass is located, in agreement with Bell et al. (2007), Vergani et al. (2008), or Ruhland et al. (2009). The question is, can gas-rich major mergers drive this structural transformation?
5. The role of gas-rich major mergers in the structural evolution of intermediate-mass galaxies
To explore the role of gas-rich major mergers in the structural evolution of galaxies we define the fraction of new ETs that appears between and due to gas-rich major mergers, , as:
| (17) |
where is the number density of new ETs due to gas-rich mergers, and is the total number density of new ETs. We assume that each gas-rich major merger remnant is an ET galaxy (Naab et al., 2006a; Rothberg & Joseph, 2006a, b; Hopkins et al., 2008, 2009b), so , being
| (18) |
where in a flat universe, , and (merger rate parameters are those from L09). Using the results of the previous section, we infer that %. The errors take into account the uncertainties in the merger rate and number density parameters. This value implies that gas-rich major mergers cannot explain the observed structural evolution.
Interestingly, if we extrapolate the observed tendencies up to , we obtain that %. This is, gas-rich major mergers could be the dominant process in ETs formation at . Although extrapolating our results beyond is risky and more data in the range are needed to explore the suggested picture, the very different behavior in the two redshift intervals makes our results qualitatively reliable.
How are our results modified by spheroid-spheroid (dry) mergers?
The L09 methodology is only sensitive to gas-rich mergers (Section 2.3), so the role of
dry mergers cannot be measured directly in this work. However, we can estimate the effect
of dry mergers in our results: if we assume that a dry merger between
two ET galaxies leads to another ET galaxy
(González-García & van Albada, 2003; González-García
et al., 2006; Naab et al., 2006b; Boylan-Kolchin et al., 2006; Hopkins et al., 2009c), then each dry merger remnant represents the disappearance of one ET galaxy. That is, the value of in Equation (17) could be higher due to dry mergers. In addition, some of our observed gas-rich mergers may be spiral–spheroid (mixed) mergers that conserve the number of ET galaxies (i.e., only spiral–spiral wet mergers create new spheroids). Because of this, the value of in Equation (17) could be lower due to mixed mergers. In summary, our value is at least an upper limit to the importance of gas-rich major mergers in the structural evolution of galaxies.
5.1. Comparison with Previous Studies
In this section, we compare our result with those in literature. Bundy et al. (2009) perform a close pair study in GOODS-South and North, and compare the formation rate of new spheroids against their measured gas-rich (wet + mixed) merger rate. From their results, we infer % for galaxies111111For our cosmology and assuming a Salpeter (1955) IMF. that compares well with our value in the same redshift range, %, for the main galaxy in our mass sample, which has . Although we include Sa galaxies in our definition of ET galaxy, the conclusion from both works is similar: less than half of the new intermediate-mass ET that appeared at come from gas-rich major mergers.
In their work, Wild et al. (2009) studied post-starburst (PSB) galaxies in COSMOS and their role in red sequence assembly. The spectra of PSB indicate that the formation of O- and early-B-type stars has suddenly ceased in the galaxy, while the simulations performed by Johansson et al. (2008) find that the PSB phase can only be reached by gas-rich major merger remnants. In L09, we show that the gas-rich merger rate and the PSB rate of galaxies at are similar, supporting PSB galaxies as descendants of our gas-rich mergers. In addition, most of the red sequence galaxies are ETs (e.g. Lotz et al., 2008b), so we can compare the fraction of red sequence mass from PSB galaxies at , %, with %. Despite the different methodologies and assumptions, the agreement between both studies is remarkable.
Other works also study the impact of mergers in ETs evolution. Bundy et al. (2007) compare the evolution of the virial mass functions of halos hosting spheroidals with the merger rates predicted by cosmological simulations, concluding that major mergers are insufficient to explain the observed increase in ET population. Lotz et al. (2008b) use morphological indices to study the major merger rate to in a band selected sample () and compare it against the evolution of E/S0/Sa galaxies. They find that all the ET evolution can be explained by major mergers, although the effect of observational errors that tend to overestimate systematically the merger fraction by morphological indices (López-Sanjuan et al., 2008) makes their result an upper limit.
Summarizing, our results are in good agreement with previous works when a similar mass selection is applied. At higher stellar masses the picture is different: the merger fraction depends on stellar mass (de Ravel et al., 2009; Bundy et al., 2009), having galaxies higher pair fractions than less massive ones, and being red pairs more common at these masses (Bundy et al., 2009). This suggests dry mergers as an important process in the evolution of massive galaxies since (e.g. Bell et al., 2004; Lin et al., 2008; Ilbert et al., 2010). The size (Trujillo et al., 2007; Buitrago et al., 2008; van Dokkum et al., 2008; van der Wel et al., 2008) and velocity dispersion evolution (Cenarro & Trujillo, 2009) of ET galaxies since also support the importance of mergers, specially the impact of minor mergers in the evolution of these systems (Bezanson et al., 2009; Naab et al., 2009; Hopkins et al., 2009a). This problem was also analyzed by Eliche-Moral et al. (2009), who modeled the evolution of luminosity function backwards in time for galaxies, selected according to their colors (red/blue/total) and their morphologies. They find that the observed luminosity function evolution can be naturally explained by the observed gas-rich and dry major merger rates, and that 50%–60% of today’s E/S0 in this mass range were formed by major mergers at , with a small number evolution since (see also Cristóbal-Hornillos et al. 2009; Ilbert et al. 2010). Note that the gas-rich major merger fractions assumed by Eliche-Moral et al. (2009) are those from L09 for -band selected galaxies (), which were obtained in a similar way as the merger fractions used through this paper.
This makes (Pérez-González et al., 2008) a transition mass at : at higher masses major mergers are an important process in the evolution of ET galaxies, while at lower masses other mechanisms dominate the observed evolution (see also Drory & Alvarez, 2008; van der Wel et al., 2009; Oesch et al., 2009).
5.2. Which Processes are Responsible of Early-type Rise?
Since gas-rich major mergers are not the dominant process in the late- to early-type transformation at intermediate masses, two possibilities remains: minor mergers and secular processes. We measure the structure in the -band rest frame, so the increase in the Sérsic index that we observe can be either the result of an increase in the mass of the spheroidal component of the galaxies, or due to the decline of the star formation in the disk of late types. In the former, minor mergers increase the Sérsic index of galaxies (Eliche-Moral et al., 2006) and multiple minor mergers can lead to ETs (Bournaud et al., 2007; Hopkins et al., 2009b), while secular evolution, e.g. bars and disk instabilities, produces pseudobulges (Kormendy & Kennicutt, 2004; Fisher et al., 2009; Combes, 2009). In the latter, minor mergers can modify the gas distribution of the galaxy, shutting down the star formation (Bekki, 1998), whereas gas exhaustion or the prevention of star formation due to the stabilization of the gas in a bulge-dominated galaxy (morphological quenching, Martig et al. 2009) is an example of a secular process. To obtain new clues about ET evolution, we study the star formation properties of ET and LT galaxies in GOODS-S in a forthcoming paper (C. López-Sanjuan et al., in preparation).
6. Conclusions
We have studied the structure of and galaxies in GOODS-S at . We use the position of galaxies in the concentration–asymmetry plane to segregate them in ET galaxies (bulge dominated, E/S0/Sa), LT galaxies (disk dominated and irregular, Sb-Irr), and gas-rich major mergers (see L09, for details). We find that:
-
1.
The ET fraction increases with cosmic time in both luminosity- and mass-selected samples, while the LT fractions decrease;
-
2.
The number density of LT galaxies decreases with cosmic time, while ET number density is roughly constant. We infer that star formation is located primarily in late spirals and irregulars, instead that in major merger systems. These systems account for a %% of the total star formation rate in the range , while the star formation triggered directly by interactions in this range is %;
-
3.
The number density of ET galaxies increases by a factor of 5 since . This implies that we need a structural transformation in the range between LT galaxies, which form stars actively, and ET galaxies, in which stellar mass is located;
-
4.
When we compare the observed structural evolution with the gas-rich merger rate in the range , we obtain that only 20% of the newly formed ET galaxies that appear since can be gas-rich major merger remnants, whereas in the range these mergers can explain all the inferred structural evolution. This suggests minor mergers and secular processes as the principal mechanisms in the rise of intermediate-mass () ET galaxies since , while gas-rich major mergers may be the dominant process at higher redshifts () and masses ().
We study the star formation properties of GOODS-S galaxies in a forthcoming paper (C. López-Sanjuan et al., in preparation) to obtain new clues about ETs rise since . In addition, the study of structure in red bands, more related to the stellar mass than the band used in this paper, are needed to understand which phenomenon (bulge growth or disk fading) is responsible for the observed structural evolution.
References
- Abraham et al. (1994) Abraham, R. G., Valdes, F., Yee, H. K. C., & van den Bergh, S. 1994, ApJ, 432, 75
- Abraham et al. (1996) Abraham, R. G., van den Bergh, S., Glazebrook, K., Ellis, R. S., Santiago, B. X., Surma, P., & Griffiths, R. E. 1996, ApJS, 107, 1
- Adami et al. (2005) Adami, C., et al. 2005, A&A, 443, 805
- Adelman-McCarthy et al. (2006) Adelman-McCarthy, J. K., et al. 2006, ApJS, 162, 38
- Baldry et al. (2004) Baldry, I. K., Glazebrook, K., Brinkmann, J., Ivezić, Ž., Lupton, R. H., Nichol, R. C., & Szalay, A. S. 2004, ApJ, 600, 681
- Bekki (1998) Bekki, K. 1998, A&A, 334, 814
- Bell et al. (2007) Bell, E. F., Zheng, X. Z., Papovich, C., Borch, A., Wolf, C., & Meisenheimer, K. 2007, ApJ, 663, 834
- Bell et al. (2004) Bell, E. F., et al. 2004, ApJ, 608, 752
- Bell et al. (2005) —. 2005, ApJ, 625, 23
- Bershady et al. (2000) Bershady, M. A., Jangren, A., & Conselice, C. J. 2000, AJ, 119, 2645
- Bezanson et al. (2009) Bezanson, R., van Dokkum, P. G., Tal, T., Marchesini, D., Kriek, M., Franx, M., & Coppi, P. 2009, ApJ, 697, 1290
- Blakeslee et al. (2006) Blakeslee, J. P., et al. 2006, ApJ, 644, 30
- Bournaud et al. (2007) Bournaud, F., Jog, C. J., & Combes, F. 2007, A&A, 476, 1179
- Bower et al. (2006) Bower, R. G., Benson, A. J., Malbon, R., Helly, J. C., Frenk, C. S., Baugh, C. M., Cole, S., & Lacey, C. G. 2006, MNRAS, 370, 645
- Boylan-Kolchin et al. (2006) Boylan-Kolchin, M., Ma, C.-P., & Quataert, E. 2006, MNRAS, 369, 1081
- Bridge et al. (2007) Bridge, C. R., et al. 2007, ApJ, 659, 931
- Buitrago et al. (2008) Buitrago, F., Trujillo, I., Conselice, C. J., Bouwens, R. J., Dickinson, M., & Yan, H. 2008, ApJ, 687, L61
- Bundy et al. (2009) Bundy, K., Fukugita, M., Ellis, R. S., Targett, T. A., Belli, S., & Kodama, T. 2009, ApJ, 697, 1369
- Bundy et al. (2007) Bundy, K., Treu, T., & Ellis, R. S. 2007, ApJ, 665, L5
- Bundy et al. (2006) Bundy, K., et al. 2006, ApJ, 651, 120
- Cassata et al. (2008) Cassata, P., et al. 2008, A&A, 483, L39
- Cenarro & Trujillo (2009) Cenarro, A. J., & Trujillo, I. 2009, ApJ, 696, L43
- Combes (2009) Combes, F. 2009, e-prints (astro-ph: 0901.0178)
- Conselice (2003) Conselice, C. J. 2003, ApJS, 147, 1
- Conselice (2006a) —. 2006a, MNRAS, 373, 1389
- Conselice (2006b) —. 2006b, ApJ, 638, 686
- Conselice (2009) —. 2009, MNRAS, 399, L16
- Conselice et al. (2009) Conselice, C. J., Yang, C., & Bluck, A. F. L. 2009, MNRAS, 361
- Cowie et al. (1996) Cowie, L. L., Songaila, A., Hu, E. M., & Cohen, J. G. 1996, AJ, 112, 839
- Cox et al. (2008) Cox, T. J., Jonsson, P., Somerville, R. S., Primack, J. R., & Dekel, A. 2008, MNRAS, 384, 386
- Cristóbal-Hornillos et al. (2009) Cristóbal-Hornillos, D., et al. 2009, ApJ, 696, 1554
- Dahlen et al. (2007) Dahlen, T., Mobasher, B., Dickinson, M., Ferguson, H. C., Giavalisco, M., Kretchmer, C., & Ravindranath, S. 2007, ApJ, 654, 172
- Davis et al. (2007) Davis, M., et al. 2007, ApJ, 660, L1
- De Lucia & Blaizot (2007) De Lucia, G., & Blaizot, J. 2007, MNRAS, 375, 2
- De Propris et al. (2007) De Propris, R., Conselice, C. J., Liske, J., Driver, S. P., Patton, D. R., Graham, A. W., & Allen, P. D. 2007, ApJ, 666, 212
- de Ravel et al. (2009) de Ravel, L., et al. 2009, A&A, 498, 379
- de Vaucouleurs et al. (1991) de Vaucouleurs, G., de Vaucouleurs, A., Corwin, Jr., H. G., Buta, R. J., Paturel, G., & Fouque, P. 1991, Third Reference Catalogue of Bright Galaxies, ed. G. de Vaucouleurs, A. de Vaucouleurs, H. G. Corwin, Jr., R. J. Buta, G. Paturel, & P. Fouque
- di Matteo et al. (2007) di Matteo, P., Combes, F., Melchior, A.-L., & Semelin, B. 2007, A&A, 468, 61
- Dressler (1980) Dressler, A. 1980, ApJ, 236, 351
- Driver et al. (2006) Driver, S. P., et al. 2006, MNRAS, 368, 414
- Drory & Alvarez (2008) Drory, N., & Alvarez, M. 2008, ApJ, 680, 41
- Eliche-Moral et al. (2006) Eliche-Moral, M. C., Balcells, M., Aguerri, J. A. L., & González-García, A. C. 2006, A&A, 457, 91
- Eliche-Moral et al. (2009) Eliche-Moral, M. C., et al. 2009, ApJ, submitted
- Faber et al. (2007) Faber, S. M., et al. 2007, ApJ, 665, 265
- Ferreras et al. (2009) Ferreras, I., Lisker, T., Pasquali, A., & Kaviraj, S. 2009, MNRAS, 395, 554
- Fisher et al. (2009) Fisher, D. B., Drory, N., & Fabricius, M. H. 2009, ApJ, 697, 630
- Fontana et al. (2006) Fontana, A., et al. 2006, A&A, 459, 745
- Fontana et al. (2009) —. 2009, A&A, 501, 15
- Gabasch et al. (2004) Gabasch, A., et al. 2004, A&A, 421, 41
- Giavalisco et al. (2004) Giavalisco, M., et al. 2004, ApJ, 600, L93
- González-García et al. (2006) González-García, A. C., Balcells, M., & Olshevsky, V. S. 2006, MNRAS, 372, L78
- González-García & van Albada (2003) González-García, A. C., & van Albada, T. S. 2003, MNRAS, 342, L36
- Heiderman et al. (2009) Heiderman, A., et al. 2009, ApJ, 705, 1433
- Hopkins & Beacom (2006) Hopkins, A. M., & Beacom, J. F. 2006, ApJ, 651, 142
- Hopkins et al. (2009a) Hopkins, P. F., Bundy, K., Hernquist, L., Wuyts, S., & Cox, T. J. 2009a, MNRAS, 1635
- Hopkins et al. (2009b) Hopkins, P. F., Cox, T. J., Younger, J. D., & Hernquist, L. 2009b, ApJ, 691, 1168
- Hopkins & Hernquist (2009) Hopkins, P. F., & Hernquist, L. 2009, MNRAS, 1820
- Hopkins et al. (2008) Hopkins, P. F., Hernquist, L., Cox, T. J., Dutta, S. N., & Rothberg, B. 2008, ApJ, 679, 156
- Hopkins et al. (2009c) Hopkins, P. F., Lauer, T. R., Cox, T. J., Hernquist, L., & Kormendy, J. 2009c, ApJS, 181, 486
- Hopkins et al. (2009d) Hopkins, P. F., et al. 2009d, MNRAS, 397, 802
- Huertas-Company et al. (2008) Huertas-Company, M., Rouan, D., Tasca, L., Soucail, G., & Le Fèvre, O. 2008, A&A, 478, 971
- Ilbert et al. (2005) Ilbert, O., et al. 2005, A&A, 439, 863
- Ilbert et al. (2006) —. 2006, A&A, 453, 809
- Ilbert et al. (2010) —. 2010, ApJ, 709, 644
- Jogee et al. (2009) Jogee, S., et al. 2009, ApJ, 697, 1971
- Johansson et al. (2008) Johansson, P. H., Naab, T., & Burkert, A. 2008, Astronomische Nachrichten, 329, 956
- Knapen & James (2009) Knapen, J. H., & James, P. A. 2009, ApJ, 698, 1437
- Kormendy & Kennicutt (2004) Kormendy, J., & Kennicutt, Jr., R. C. 2004, ARA&A, 42, 603
- Kriek et al. (2008) Kriek, M., van der Wel, A., van Dokkum, P. G., Franx, M., & Illingworth, G. D. 2008, ApJ, 682, 896
- Lauger et al. (2005a) Lauger, S., Burgarella, D., & Buat, V. 2005a, A&A, 434, 77
- Lauger et al. (2005b) Lauger, S., Ilbert, O., Buat, V., Tresse, L., Burgarella, D., Arnouts, S., Le Fèvre, O., & VVDS Collaboration. 2005b, in SF2A-2005: Semaine de l’Astrophysique Francaise, ed. F. Casoli, T. Contini, J. M. Hameury, & L. Pagani, 667–+
- Li et al. (2008) Li, C., Kauffmann, G., Heckman, T. M., Jing, Y. P., & White, S. D. M. 2008, MNRAS, 385, 1903
- Lilly et al. (1996) Lilly, S. J., Le Fevre, O., Hammer, F., & Crampton, D. 1996, ApJ, 460, L1+
- Lin et al. (2007) Lin, L., et al. 2007, ApJ, 660, L51
- Lin et al. (2008) —. 2008, ApJ, 681, 232
- Liske et al. (2003) Liske, J., Lemon, D. J., Driver, S. P., Cross, N. J. G., & Couch, W. J. 2003, MNRAS, 344, 307
- López-Sanjuan et al. (2009a) López-Sanjuan, C., Balcells, M., Pérez-González, P. G., Barro, G., García-Dabó, C. E., Gallego, J., & Zamorano, J. 2009a, A&A, 501, 505
- López-Sanjuan et al. (2008) López-Sanjuan, C., García-Dabó, C. E., & Balcells, M. 2008, PASP, 120, 571
- López-Sanjuan et al. (2009b) López-Sanjuan, C., et al. 2009b, ApJ, 694, 643
- Lotz et al. (2008a) Lotz, J. M., Jonsson, P., Cox, T. J., & Primack, J. R. 2008a, MNRAS, 391, 1137
- Lotz et al. (2009) —. 2009, e-prints (astro-ph: 0912.1590)
- Lotz et al. (2008b) Lotz, J. M., et al. 2008b, ApJ, 672, 177
- Mandelbaum et al. (2006) Mandelbaum, R., Seljak, U., Kauffmann, G., Hirata, C. M., & Brinkmann, J. 2006, MNRAS, 368, 715
- Marchesini et al. (2009) Marchesini, D., van Dokkum, P. G., Förster Schreiber, N. M., Franx, M., Labbé, I., & Wuyts, S. 2009, ApJ, 701, 1765
- Martig et al. (2009) Martig, M., Bournaud, F., Teyssier, R., & Dekel, A. 2009, ApJ, 707, 250
- Menanteau et al. (2006) Menanteau, F., Ford, H. C., Motta, V., Benítez, N., Martel, A. R., Blakeslee, J. P., & Infante, L. 2006, AJ, 131, 208
- Naab et al. (2006a) Naab, T., Jesseit, R., & Burkert, A. 2006a, MNRAS, 372, 839
- Naab et al. (2009) Naab, T., Johansson, P. H., & Ostriker, J. P. 2009, ApJ, 699, L178
- Naab et al. (2006b) Naab, T., Khochfar, S., & Burkert, A. 2006b, ApJ, 636, L81
- Neichel et al. (2008) Neichel, B., et al. 2008, A&A, 484, 159
- Oesch et al. (2009) Oesch, P. A., et al. 2009, e-prints (astro-ph: 0911.1126)
- Papovich et al. (2006) Papovich, C., et al. 2006, ApJ, 640, 92
- Pérez-González et al. (2005) Pérez-González, P. G., et al. 2005, ApJ, 630, 82
- Pérez-González et al. (2008) —. 2008, ApJ, 675, 234
- Pozzetti et al. (2007) Pozzetti, L., et al. 2007, A&A, 474, 443
- Ravikumar et al. (2007) Ravikumar, C. D., et al. 2007, A&A, 465, 1099
- Rawat et al. (2008) Rawat, A., Hammer, F., Kembhavi, A. K., & Flores, H. 2008, ApJ, 681, 1089
- Rix et al. (2004) Rix, H.-W., et al. 2004, ApJS, 152, 163
- Robaina et al. (2009) Robaina, A. R., et al. 2009, ApJ, 704, 324
- Rothberg & Joseph (2006a) Rothberg, B., & Joseph, R. D. 2006a, AJ, 131, 185
- Rothberg & Joseph (2006b) —. 2006b, AJ, 132, 976
- Ruhland et al. (2009) Ruhland, C., Bell, E. F., Häußler, B., Taylor, E. N., Barden, M., & McIntosh, D. H. 2009, ApJ, 695, 1058
- Salpeter (1955) Salpeter, E. E. 1955, ApJ, 121, 161
- Scarlata et al. (2007a) Scarlata, C., et al. 2007a, ApJS, 172, 494
- Scarlata et al. (2007b) —. 2007b, ApJS, 172, 406
- Scoville et al. (2007) Scoville, N., et al. 2007, ApJS, 172, 1
- Sobral et al. (2009) Sobral, D., et al. 2009, MNRAS, 398, 75
- Somerville et al. (2004) Somerville, R. S., Lee, K., Ferguson, H. C., Gardner, J. P., Moustakas, L. A., & Giavalisco, M. 2004, ApJ, 600, L171
- Stewart et al. (2009) Stewart, K. R., Bullock, J. S., Wechsler, R. H., & Maller, A. H. 2009, ApJ, 702, 307
- Strateva et al. (2001) Strateva, I., et al. 2001, AJ, 122, 1861
- Taylor et al. (2009) Taylor, E. N., et al. 2009, ApJ, 694, 1171
- Tresse et al. (2007) Tresse, L., et al. 2007, A&A, 472, 403
- Trujillo et al. (2007) Trujillo, I., Conselice, C. J., Bundy, K., Cooper, M. C., Eisenhardt, P., & Ellis, R. S. 2007, MNRAS, 382, 109
- van der Wel (2008) van der Wel, A. 2008, ApJ, 675, L13
- van der Wel et al. (2008) van der Wel, A., Holden, B. P., Zirm, A. W., Franx, M., Rettura, A., Illingworth, G. D., & Ford, H. C. 2008, ApJ, 688, 48
- van der Wel et al. (2009) van der Wel, A., Rix, H., Holden, B. P., Bell, E. F., & Robaina, A. R. 2009, ApJ, 706, L120
- van Dokkum et al. (2008) van Dokkum, P. G., et al. 2008, ApJ, 677, L5
- Vergani et al. (2008) Vergani, D., et al. 2008, A&A, 487, 89
- Villar et al. (2008) Villar, V., Gallego, J., Pérez-González, P. G., Pascual, S., Noeske, K., Koo, D. C., Barro, G., & Zamorano, J. 2008, ApJ, 677, 169
- Wild et al. (2009) Wild, V., Walcher, C. J., Johansson, P. H., Tresse, L., Charlot, S., Pollo, A., Le Fèvre, O., & de Ravel, L. 2009, MNRAS, 395, 144
- Wolf et al. (2005) Wolf, C., et al. 2005, ApJ, 630, 771
- Yagi et al. (2006) Yagi, M., Nakamura, Y., Doi, M., Shimasaku, K., & Okamura, S. 2006, MNRAS, 368, 211
- Zamojski et al. (2007) Zamojski, M. A., et al. 2007, ApJS, 172, 468