Active laser frequency stabilization using neutral praseodymium (Pr)
Abstract
We present a new possibility for the active frequency stabilization of a laser using transitions in neutral praseodymium. Because of its five outer electrons, this element shows a high density of energy levels leading to an extremely line-rich excitation spectrum with more than 25 000 known spectral lines ranging from the UV to the infrared. We demonstrate the active frequency stabilization of a diode laser on several praseodymium lines between 1105 and 1123 nm. The excitation signals were recorded in a hollow cathode lamp and observed via laser-induced fluorescence. These signals are strong enough to lock the diode laser onto most of the lines by using standard laser locking techniques. In this way, the frequency drifts of the unlocked laser of more than 30 MHz/h were eliminated and the laser frequency stabilized to within 1.4(1) MHz for averaging times s. Frequency quadrupling the stabilized diode laser can produce frequency-stable UV-light in the range from 276 to 281 nm. In particular, using a strong hyperfine component of the praseodymium excitation line at = 1118.5397(4) nm makes it possible - after frequency quadruplication - to produce laser radiation at = 279.6349(1) nm, which can be used to excite the D2 line in Mg+.
I Introduction
Lasers are widely used in many fields of applied and fundamental research. However, for some applications, a serious drawback is their residual frequency instability. Free-running lasers without any measures of active or passive frequency stabilization exhibit short-term frequency fluctuations (laser linewidths) much larger than the Schawlow-Townes limit SchalowTownes58 and are subject to continuous long-term frequency drifts. For example, free- running diode lasers show a laser linewidth of about 100 MHz and frequency drifts of up to many 10 MHz/h, due to temperature and air pressure fluctuations in the laboratory, diode current instabilities etc. Wieman1991 . Whereas the linewidth of a diode laser can be narrowed to typically less than 1 MHz using the passive optical feedback from a grating Wieman1991 ; Ricci1995 , the unwanted frequency drifts on longer time scales are more difficult to eliminate. A common technique is to actively stabilize the laser onto an external high-finesse Fabry-Perot interferometer (FPI) or, alternatively, onto suitable atomic or molecular transitions. For the latter, transition lines of various substances, e.g., alkaline atoms or molecules like iodine or tellurium, have been widely in use.
The thorough investigation of the iodine spectrum by Gerstenkorn et al. Gerstenkorn1 ; Gerstenkorn2 together with the ease with which an iodine vapor cell can be handled make iodine a particularly attractive element for this purpose Nevsky2001 ; Picard2003 ; Hong2004 ; Skvortsov2004 . On the other hand there are also a number of drawbacks: the main spectrum of iodine ranges from 500 to 900 nm, and within this range the number of strong lines is limited so that for many frequencies of interest no excitation lines for the laser frequency stabilization are available. In this case it is principally always possible to use an external FPI to stabilize the laser. However, to set up an external frequency-stable FPI may entail considerable experimental efforts and, moreover, cannot completely eliminate the unwanted residual frequency drifts. Therefore, if possible, it is usually advantageous to use atomic or molecular transitions as a reference for the active laser frequency stabilization since the atomic excitation frequencies do not change in time. Apart from iodine, there is thus a high demand to search for other atoms or molecules suitable for this purpose.
In this paper, we investigate a hitherto unexplored element in use for active laser frequency stabilization, namely the atom praseodymium. Because of its five outer valence electrons, the energy spectrum of praseodymium exhibits an extremely rich level structure starting already above the ground state. Since the spectrum resembles more that of a solid than that of an atom, it is sometimes also called ‘quasi-continuous’. The praseodymium spectrum has been well investigated by several groups over the last few decades Ginibre0 ; Ginibre1 ; Guthoehrlein ; Bakkali ; Windholz ; Zalubas1973 ; Furmann1997 ; Furmann2006 ; Martin1978 ; Childs1981 ; Kuwamoto1996 ; Boeklen1975 ; Macfarlane1982 ; Furmann1998 ; Krzykowski1998 . So far, more than 1200 energy levels and 25 000 transition lines are known in the spectral range from 320 nm to 3.5 m of which one third has been classified so far. This multitude of excitation lines, including a rich hyperfine structure (hfs) for each resonance, in combination with the comprehensive knowledge of the spectrum make praseodymium an attractive element for the frequency stabilization of laser sources.
In what follows, we report the first active frequency stabilization of a laser onto a praseodymium resonance. Several praseodymium transitions between 1105 nm and 1123 nm were systematically investigated for this purpose, corresponding to the tuning range of the diode laser used in the experiment. The transitions were excited in a hollow cathode lamp (HCL) and recorded via laser-induced fluorescence (LIF). Active frequency stabilization of the diode laser was demonstrated using standard laser locking techniques. In this way, the long-term frequency drift of the diode laser of more than 30 MHz/h was eliminated and its frequency continuously stabilized to within 1.4(1) MHz. In addition, one new strong praseodymium transition close to the 4th sub-harmonic of the D2 transition of Mg+ at = 4 = 1118.540 nm was found, making it possible to actively lock the diode laser at this wavelength. After frequency quadruplication this will allow the continuous excitation of the Mg+ D2 transition at = 279.635 nm.
The paper is organized as follows: In Sects. II and III we present the element praseodymium and introduce the experimental setup used to obtain the praseodymium LIF spectra. In Sects. IV and V we display several experimental LIF spectra recorded in the range 1105 to 1123 nm and discuss the possibility to actively frequency stabilize a laser onto one of these lines. In Sect. VI we present a new praseodymium transition, close to the 4th sub-harmonic of the D2 line of Mg+. Frequency quadruplication of an infrared laser, locked to this transition, would make it possible to continuously excite the D2 transition in Mg+. In Sect. VII we finally draw conclusions.
II The element praseodymium
The chemical element praseodymium (Pr) belongs to the lanthanide series (rare earths group) and is placed between the elements cerium (Ce) and neodymium (Nd). One of the prominent Pr electron configurations with three valence electrons inside the shell is [Xe]. The lowest term under a total of 17 terms of this configuration is a , where corresponts to the electronic ground state of Pr. Hereby, the designation describes the coupling of the three equivalent electrons in the open shell in LS-notation (LS-coupling nomenclature: denotes the parity of the level and in this case).
The naturally occurring Pr is composed of only one stable isotope 59Pr with nuclear spin . The hyperfine interaction causes a hyperfine level splitting determined by the magnetic dipole coupling constant and the electric quadrupole coupling constant (magnetic dipole moment = 4.2754(5) Macfarlane1982 , electric quadrupole moment = -0.0024 b Boeklen1975 ). For a hyperfine sublevel characterized by the quantum number the shift with respect to the corresponding fine structure level energy can be written in first order perturbation theory in the form
| (1) |
with
| (2) |
where , , and are the nuclear spin, the total electron and total atom angular momentum quantum numbers, respectively. Eq.(1) is usually called Casimir’s formula. Since the Pr nucleus is almost spherical, the electric quadrupole term can be largely neglected in Eq.(1).
The hyperfine splitting leads to a manifold of hfs sublevels. The number of sublevels is given by:
| (3) | |||||
| (4) |
If at least one of the -values of the combining fine structure levels is greater than 5/2, then the hyperfine structure shows a flag pattern with six main (diagonal) hyperfine components (). Besides these main components two additional groups of weaker off-diagonal hyperfine components () can be observed where the number of off-diagonal elements depends on . If one can find 10 off-diagonal components whereas if there are only 9 off-diagonal components can be observed. Since the frequency spacing between neighboring hyperfine components is typically on the order of 2 GHz and with Doppler-widths of approximately 400 MHz at 1115 nm the full spectrum of the hfs can be usually resolved. To obtain the spectra the spectroscopic method of LIF is employed using a specially designed HCL.
The active laser frequency stabilization onto a particular Pr transition can be roughly divided into two parts. The first part deals with the generation of a strong LIF signal in the HCL with high signal-to-noise (S/N) ratio. The second part refers to the laser frequency stabilization itself, i.e., the stabilization of the laser onto a particular LIF resonance. Both parts will be discussed in more detail in the following three sections.
III Experimental setup for generating LIF spectra
LIF spectroscopy in combination with an HCL is a sensitive and widely-used technique of recording the spectra of various gaseous substances. The broad-band excitation in the hollow cathode discharge leads to a highly-excited plasma with a local thermodynamic equilibrium of the population distribution among the atomic energy levels. Therefore, LIF in an HCL makes it also possible to investigate the level schemes of high-lying energy states, in the case of Pr of up to above the ground state.
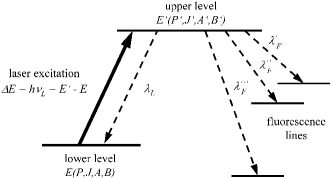
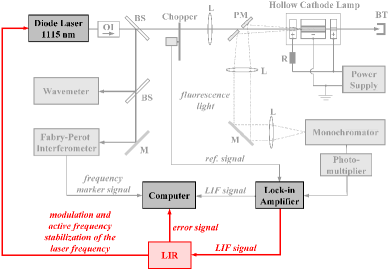
The basic principle of LIF spectroscopy is depicted in Fig. 1. The laser beam with wavelength is led through the plasma column of the hollow cathode discharge and is slowly scanned over the spectral range of interest. The selective absorption of the laser beam increases the population of the upper level when hitting a resonance. This change in the population distribution can be detected by measuring the rise of fluorescence light intensity at the wavelengths , emitted by the spontaneous decay from the upper level to corresponding lower levels (LIF). A LIF signal will only be recorded if the laser frequency is in resonance with a dipole allowed transition between certain hyperfine sublevels of the lower level and of the upper level . A tunable monochromator (spectral bandwidth = 0.2 nm) which registers the fluorescence light makes it possible to separate all decay channels of the fluorescence spectrum. At the same time, the wavelength band-pass filter of the monochromator avoids an overload of the photomultiplier tube caused by the bright light emitted by the hollow cathode plasma over the whole spectral region.
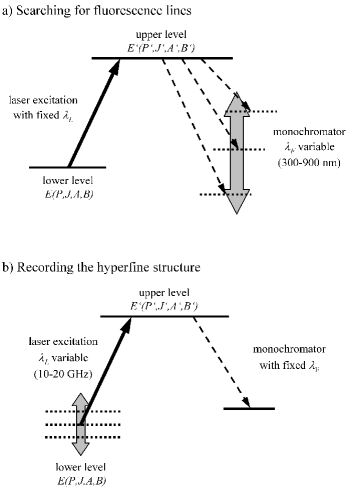
There are two conceptionally different kinds of LIF experiments, depending on the operation of the monochromator. For the first type of experiments, the laser frequency is tuned to an optical resonance, so that the monochromator can be used to analyze the LIF emission spectrum. Since every energy level decays spontaneously into particular final states depending on the selection rules, the monitored fluorescence light can give information on the position, parity and quantum number of the upper state. In the other type of experiment, the monochromator is tuned to a strong LIF line and the laser frequency is then scanned over a frequency region of interest to obtain the hyperfine structure of the excitation line. In this way, the entire hfs of a spectral line can be studied. Both LIF methods are displayed in Fig. 2. The last mentioned method has been applied mostly in this work.
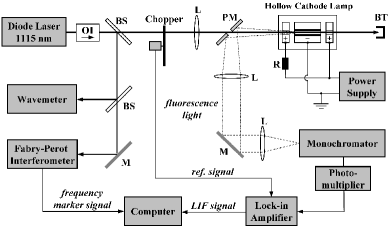
The experimental setup for the generation of the LIF spectra is presented in Fig. 3. A commercial diode laser from Toptica Photonics (DL 100) at 1115 nm center wavelength is used for the excitation of Pr atoms produced by sputtering inside the HCL. The grating-stabilized extended cavity diode laser (ECDL) has a linewidth of less than 1 MHz which is sufficiently narrow to record the Doppler-broadened Pr resonances. The ECDL has a maximum output power of 83 mW at 208 mA and is tunable over a range of almost 20 nm, from 1105 to 1123 nm; without mode hopping the laser can be tuned in single mode over 20 GHz. The internal collimator lens of the ECDL is used to focus the laser beam into the HCL to yield optimum illumination of the reaction volume. In order to prevent unwanted optical feedback from the HCL and other optical elements an optical isolator with isolation 60 dB is installed in front of the ECDL.
A beam splitter placed behind the optical isolator feeds parts of the laser light into a wavemeter and an FPI. Both devices are used to determine the laser frequency. The wavemeter (uncertainty 50 MHz) is used for the absolute frequency calibration of the LIF spectra whereas the FPI (free spectral range 2.109(12) GHz) serves as an additional frequency marker in order to linearize the recorded LIF spectra.
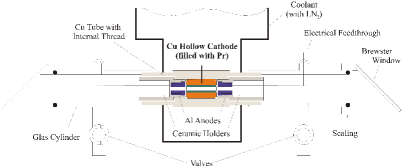
The non-commercial HCL especially designed for this experiment consists of several parts (see Fig. 4). The central element of the symmetrical HCL is a copper tube into which an axially hollowed cathode of 20 mm length is screwed, filled on the inner walls with Pr. In addition, axially hollowed anodes made from aluminum are fixed at both ends of the copper tube. The inner diameter of the hollow cathode, best for the investigation of neutral Pr, has been found to be 3 mm. The copper tube together with the cathode and the two anodes is placed inside a glass cylinder, sealed at both ends with Brewster windows to allow maximum transmission of the laser beam through the HCL.
The HCL was operated with a buffer gas (argon) at a pressure of 0.5 mbar. In order to obtain a constant discharge current of about 60 mA, a voltage of 300 V was applied. Under these conditions one can assume that the fraction of atomic Pr in the plasma amounts to more than 90 percent, the rest of the sputtered material being mainly singly ionized Pr+.
In order to achieve a more stable discharge, the HCL can be cooled with liquid nitrogen. The nitrogen cooling results in an internal temperature of the HCL of about 100 to 200 ∘C (Boltzmann temperature) which greatly reduces the Doppler-widths of the spectra down to typically 350 to 400 MHz at 1115 nm.
Passing laser radiation through the gas discharge yields a new population distribution among the two energy levels of Pr participating in a resonance. The fluorescence light that leaves the HCL in case of resonant laser excitation is collected by a pin-hole mirror (placed on the side of the incoming laser beam) and is directed to the entrance slit of the monochromator by a set of mirrors and lenses. The monochromator with a tuning range from 300 to 900 nm and a resolution of can be used to filter single LIF lines out of the total fluorescence spectrum. A photomultiplier with high sensitivity for the visible spectrum is mounted at the exit slit of the monochromator allowing the detection of extremely low fluorescence signal changes. In addition, a mechanical chopper (280 Hz) placed inside the laser beam enables a phase-sensitive detection and amplification of the LIF signals by use of a lock-in amplifier (LIA). Even very low-intensity LIF signals in an extremely noisy environment can thus be observed and recorded.
The LIF signal together with the marker signal from the FPI are simultaneously recorded and stored in a computer. The acquired LIF spectra can then be processed by an especially designed evaluation program Fitter . This program serves to determine the hfs parameters of the measured lines by fitting the experimentally recorded spectra by a theoretical curve composed of a specified number of Voigt profiles using the method of least- squares. Fitting parameters of the theoretical curve are the hyperfine constants and of the involved lower and upper energy levels, the linewidths of the Gaussian and Lorentzian parts of the Voigt profiles, and the relative intensities of all hyperfine components. The total angular momentum quantum numbers and of the lower and upper levels can be chosen separately before the algorithm of the fit is carried out. The choice of specific values defines the number of hyperfine components and is therefore a prerequisite for a good theoretical reconstruction of the recorded hfs patterns. As the positions of a maximum of 16 (if ) or 15 (if ) hfs components obey the Casimir relations (see Eq.(1)), only one additional parameter (the center of gravity position of the line) is needed. The final fit and the experimental spectrum are plotted together. An additional curve called deviation curve is shown at the bottom of each spectrum. This curve displays the error between the best fitted theoretical and the experimental curves and illustrates the quality of the fit. Fig. 5 shows an example of a typical LIF spectrum together with the adjusted theoretical curve in the best-fit situation.
IV LIF spectroscopy between 1105 and 1123 nm
In the first stage of our investigations of neutral Pr we recorded a number of lines in the range between 1105 and 1123 nm, accessible with the tunable ECDL. Since up to now all LIF experiments with Pr have been performed using Ti:Sapphire or single-mode dye lasers, the Pr spectra recorded so far have been limited to laser excitation in the visible range of the spectrum; apart from experiments employing Fourier spectroscopy Ginibre0 ; Ginibre1 no direct electric dipole transitions in the infrared range of the spectrum have thus yet been observed.
The spectral line density and the amount of known lines in the infrared region between 1105 and 1123 nm is almost ten times lower compared to the amount of lines classified in the visible. Since LIF spectroscopy is based on an optical coincidence measurement, where simultaneously the laser excitation and the detection window of the monochromator must coincide with a dipole allowed excitation line and a radiating emission line, respectively, it is a hopeless undertaking to find a resonance line in this wavelength region just by trial and error. (The wavelength range between 1105 and 1123 nm corresponds to 4 THz; if the linewidth of a hfs component is 400 MHz, the possibility of hitting the transition will be 1 : 10 000. In combination with the monochromator tunable in the range 300 to 900 nm and a bandwidth of 0.2 nm the overall possibility of recording a LIF signal is in the best case 1 : 30 000 000.)
To facilitate the task, we made use of a special database in which all fluorescence lines as well as all energy levels of Pr recorded so far are collected Ginibre0 ; Ginibre1 ; Guthoehrlein ; Bakkali ; Windholz . The database contains not only the almost 600 levels of neutral Pr given in Ginibre’s published and unpublished work Ginibre0 ; Ginibre1 ; GinibreGuthoehrlein but also about 600 further levels, most of them discovered in Hamburg Guthoehrlein ; Bakkali . The constantly updated database gives information on the wavelengths of all recorded excitation lines and their combining energy levels, including quantum numbers, hyperfine coupling constants and , and parities . These characteristic data are supplemented by a set of fluorescence wavelengths which were observed in earlier LIF experiments Guthoehrlein ; Windholz ; Bakkali ; Furmann1997 ; Furmann2006 ; Childs1981 ; Kuwamoto1996 ; Furmann1998 ; Krzykowski1998 . Apart from the identification of already measured lines and transitions the database allows in particular the prediction of new spectral lines and energy levels as well as the classification of hitherto unidentified hyperfine spectra.
According to this database, 66 lines were measured between 1105 and 1123 nm, which corresponds to the tuning range of the diode laser. Only a few of them had been classified so far. For all other lines only the transition wavelengths and no further information about the combining energy levels were listed. Since it was not our intention to check all 66 measured lines, we picked out a few of them, in particular low-lying combining energy levels. Low-lying energy levels are usually much more populated than the higher energy levels, so that the corresponding LIF resonances are expected to be much stronger. This property becomes all the more important, as the laser power of the ECDL was restricted to 60 mW inside the HCL.
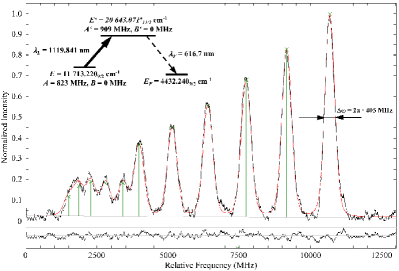
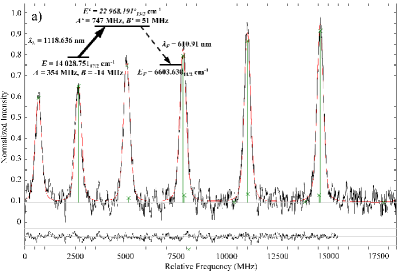
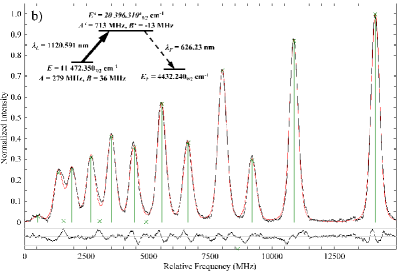
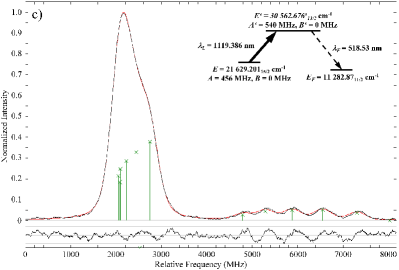
In Fig. 6 three typical hfs spectra with different S/N ratios around 1119 nm are shown, together with the corresponding excitation and emission schemes. The wavelengths of the fluorescence lines are given in air. Spectrum (a) is a confirmation of a classification given in GinibreGuthoehrlein . Spectra (b) and (c) were observed on the base of new levels taken from Guthoehrlein .
The particular hfs patterns originate from the different types of electronic transitions, defined by , as well as from the hyperfine splitting of the combining levels: well separated main hyperfine components with a characteristic flag pattern can be explained by clearly different hyperfine splitting of the lower and upper energy levels. This is the case for example for the spectra shown in Fig. 6 (a) and (b). On the contrary, the spectrum in Fig. 6 (c), apart from five small off-diagonal components, displays only one broad asymmetric structure, resulting from the overlap of all six main components because of almost equal splitting of the lower and upper energy levels. From all three spectra shown in Fig. 6 the spectrum in Fig. 6 (b) offers the best properties for an active frequency stabilization of a laser due to the good S/N ratio and the clearly separated hfs components.
In the case that no resonance lines are known in a particular wavelength region, the already mentioned database for the lines and energy levels of Pr together with a software developed at the Helmut-Schmidt- Universität Hamburg, Germany, makes it possible to search for new transitions. (Note that L. Windholz’s group from the TU Graz, Austria, developed a similar program. It is free to the public and can be used for any element.) The list of theoretically proposed transitions contains hereby not only the information on the wavelength needed for the laser excitation and their combined energy levels but also the known fluorescence lines of the levels. The latter can be used for the identification of the laser-induced transition. The question remains, however, whether the theoretically predicted transitions can be actually confirmed in the experiment.
Since the amount of known resonance lines in the infrared wavelength range is relatively low, the program turned out to be especially helpful. For example, the program predicted ten transitions between = 1118.519 nm and = 1118.563 nm () close to the 4th sub-harmonic of the D2 transition of Mg+ at = 1118.540 nmwhich have never been excited or recorded before. However, in most of these resonances the transitions start from relatively high-lying energy levels, to above the ground state, for which the chance of recording a strong LIF signal is low.
With the available laser power of 60 mW inside the HCL only two of the ten predicted Pr lines were confirmed in the experiment, namely those with the lowest initial states ( and ). They were detected by their strongest fluorescence decay channels at 567.75 and 573.58 nm, respectively. The latter Pr line is shown in Fig. 11. Both lines were recorded and classified for the first time. The two lines show a flag pattern with clearly separated hfs components and linewidths of about 375 MHz. With a S/N of about 20 and 70, respectively, it is relatively simple to stabilize a laser onto any of the six main hfs components of each of the two lines. Moreover, the presented S/N ratios could be improved by using a higher laser power. However, for the diode laser at 1115 nm, higher intensities can only be achieved with special amplifier units, e.g., tapered or fiber amplifiers. A larger laser intensity would most probably allow the detection of the other eight theoretically predicted Pr lines.
V Laser stabilization using Pr transitions
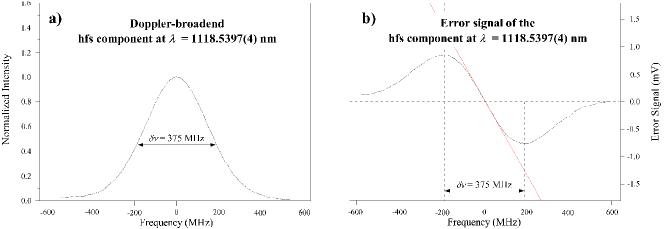
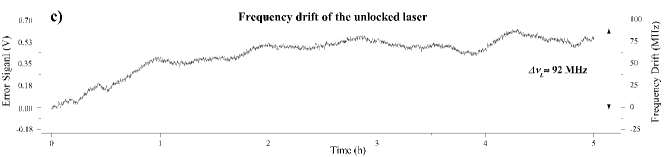
The active frequency stabilization of the infrared diode laser onto a particular Pr hfs component was performed using a so-called Lock-In-Regulator (LIR) from Toptica Photonics (see Fig. 7). The LIR module is a phase- sensitive lock-in detection unit with an integrated proportional, integral, and differential (PID) regulator. Based on a modulation of the laser frequency by dithering the piezo of the ECDL grating the first derivative of the LIF resonance is generated. This error signal is used to accomplish via the PID regulator the active frequency stabilization of the laser or, outside the lock, to investigate the frequency fluctuations and drifts of the free-running laser. For the latter, the linear part of the error signal around the zero crossing is used as a frequency discriminator (see Fig. 8 (a) and (b)). Fig. 8 (c) shows the drift behavior of the unlocked laser. For the measurements the strongest hfs component of the Pr transition
at = 1118.5397(4) nm was used, having a linewidth of 375 MHz (see Fig. 11). Within five hours of measurement a drift of more than 90 MHz was observed.
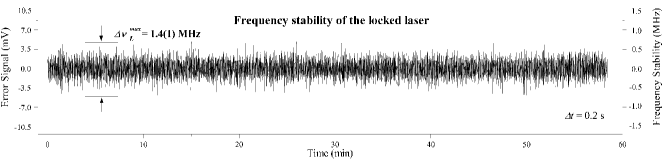
After active frequency stabilization of the laser this frequency drift was strongly reduced. Fig. 9 shows the long-term frequency stability of the laser (averaging time s) after actively locking the laser onto the mentioned hfs component. As can be seen in the figure the laser frequency was stabilized to within 1.4(1) MHz for an unlimited amount of time.
The ultimate frequency stability of the laser is determined by the S/N ratio of the LIF signal. Since the LIF signal is relatively low and furthermore obscured by the bright fluorescence background of the HCL, it is necessary to work with a lock-in amplifier (LIA) (see Sect. III). The LIF signal, after amplification by the LIA, is fed into the LIR to produce the error signal for the active frequency lock (see Fig. 7). Since the laser frequency is also modulated for the lock-in detection unit of the LIR, a too large time constant of the LIA actually improves the S/N of the LIF signal but at the same time also averages over the LIR modulation and thus suppresses the LIR error signal. A good compromise between a reasonable S/N of the LIF signal and an acceptable error signal of the LIR is therefore mandatory. For this purpose the modulation frequency of the LIR was reduced to the smallest selectable value (8.2 Hz). The bandwidth of the locking loop, given approximately by half of the modulation frequency of the LIR, therefore corresponded to about 4 Hz. This allows mainly the compensation of the low-frequency instabilities of the laser, i.e., the laser drift.
VI Using a Pr-stabilized laser for Mg+ spectroscopy
In the previous section we presented the active frequency stabilization of a diode laser onto a particular hyperfine transition of Pr at = 1118.5397(4) nm. The selected Pr line served however merely as an example to demonstrate the feasibility of locking a laser onto a Pr resonance using LIF spectroscopy. In principle, the diode laser could have been stabilized onto any other suitable Pr line in the range from 1105 to 1123 nm.
By frequency quadrupling the stabilized infrared diode laser, frequency-stable UV-light in the range 276 to 281 nm can be produced. This technique has already been employed to convert frequency-stable laser radiation at 922 nm to narrow-band UV-light at 231 nm Schwedes2003 . Since diode lasers are not yet available at 280 or 560 nm, this approach makes it possible to transfer all well-known advantages of grating-stabilized ECDLs to these wavelength regions. This is an attractive alternative to (frequency-doubled) dye lasers or tunable fiber lasers Friedenauer2006 otherwise employed in these wavelength regions.
| isotop | (nm) | (nm) | (nm) |
|---|---|---|---|
| 279.6355 | 559.2710 | 1118.5420 | |
| 279.6349 | 559.2698 | 1118.5396 | |
| 279.6347 | 559.2694 | 1118.5388 |
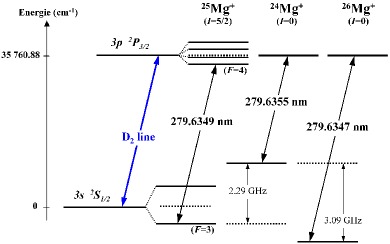
As it turns out, this technique can also be used to produce frequency-stable laser light at 279.635 nm, making it possible to excite the D2 transition of singly ionized magnesium Mg+. In recent years there has been a growing interest in Mg+ since due to its internal level structure this ion is a favorite candidate for experiments in spectroscopy, quantum optics or in quantum information science Hoeffges1997 ; Schaetz2007 ; Friedenauer2008 ; Batteiger2009 ; Home2009 ; Schmitz2009 . The precise wavelengths of the D2 lines of the three stable isotopes 24Mg+, 25Mg+, and 26Mg+ together with the corre- sponding line isotope shifts are shown in Fig. 10. The corresponding fundamental, second, and fourth sub-harmonics for the three isotopes are listed in Table 1.
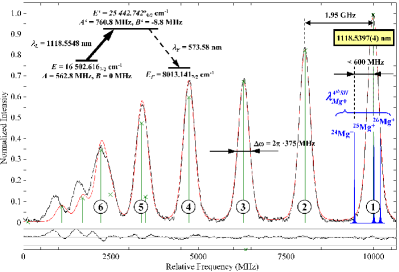
The previously discussed strongest hfs com- ponent of the Pr transition at = 1118.5397(4) nm is less than 600(100) MHz away from the 4th sub-harmonics of the Mg+ D2 line at 1118.540 nm = 4 (see Fig. 11). This resonance can therefore be conveniently used to lock the laser in the infrared and - after frequency quadruplication - to obtain frequency-stable light in the UV in order to excite the D2 transition. The remaining frequency gap of 600(100) MHz in the infrared can be easily bridged by an acousto-optical modulator (AOM). The second nearest hyperfine component of the transition is already almost 2 GHz away from , usually too large to be bridged by an AOM. Fig. 11 shows the complete hyperfine structure of the transition together with of the three stable isotopes 24Mg+, 25Mg+, and 26Mg+. The relative positions and the linewidths are drawn to scale. Other Pr hfs resonances investigated in this wavelength region exhibited either worse S/N ratios or were at least 5 GHz away from the desired .
The obtained long-term frequency stability of the laser of 1.4(1) MHz at = 1118.5397(4) nm - after frequency quadruplication - corresponds to a frequency stability of 6 MHz in the UV. This is by far sufficient for the resonant excitation of the D2 line of Mg+ which has a natural linewidth of MHz. By appropriately detuning the frequency-stabilized diode laser it thus becomes possible to excite or laser cool individual Mg+ isotopes for an unlimited amount of time.
VII Conclusion
In conclusion, we discussed the atom praseodymium (Pr) as a versatile and hitherto unexplored reference for the active frequency stabilization of a laser. With five valence electrons Pr displays an extremely rich level structure, starting already above the ground state. So far, more than 1200 energy levels and 25 000 transition lines between 320 nm and 3.5 m are known, including a rich hyperfine structure (hfs) for each resonance. This multitude of excitation lines together with the detailed knowledge of the spectrum makes Pr a very attractive reference for active laser frequency stabilization. To demonstrate the feasibility to use this element for the active frequency stabilization of lasers we actively locked a diode laser onto a particular Pr line. The corresponding excitation signals were recorded in a hollow cathode lamp (HCL) via laser-induced fluorescence (LIF) spectroscopy. Using standard locking techniques we were able to eliminate the frequency drifts of the unlocked diode laser of more than 30 MHz/h and stabilize its frequency permanently to within 1.4(1) MHz for averaging times s. The strongest hfs component of a newly found Pr line at = 1118.5397(4) nm allows - after frequency quadruplication - the production of frequency stable UV light at = 279.6349(1) nm which can be used to excite the D2 transition in Mg+. In future it might be possible to simplify the experimental design by replacing the HCL by a common rf-lamp filled with Pr.
Acknowledgement
The authors would like to especially thank Prof. Hermann Harde from the Helmut-Schmidt-Universität der Bundeswehr Hamburg for making measurements in his laboratory possible. The friendly assistance from Dr. Hans-Otto Behrens, Günther Helmrich, and Marion Kollmeier during the measurements in Hamburg was also appreciated. Thanks also go to Thomas Heine, Thorsten Schmitt, and Dr. Harald Ellmann from Toptica Photonics for their valuable technical support for the diode laser system. Furthermore, S.O. thanks the Universität Bayern e.V. for financial support.
References
- (1) A. L. Schawlow, C. H. Townes, Phys. Rev. 112, 1940 (1958).
- (2) C. E. Wieman, L. Hollberg, Rev. Sci. Instr. 62, 1 (1991).
- (3) L. Ricci et al., Opt. Commun. 117, 541 (1995).
- (4) S. Gerstenkorn, P. Luc, Atlas du spectre d’absorption de la molécule d’iode, Laboratoire Aimé-Cotton, CNRS II, Orsay (France), 14 000 - 15 600 cm-1 (1978), 15 600 - 17 600 cm-1 (1977), 17 500 - 20 000 cm-1 (1977).
- (5) S. Gerstenkorn, J. Verges, J. Chevillard, Atlas du spectre d’absorption de la molécule d’iode, Laboratoire Aimé-Cotton, CNRS II, Orsay (France), 11 000 - 14 000 cm-1 (1982).
- (6) A. Yu. Nevsky et al., Opt. Commun. 192, 263 (2001).
- (7) S. Picard et al., IEEE Trans. Instrum. Meas. 52, 236 (2003).
- (8) F.-L. Hong et al., Opt. Commun. 235, 377 (2004).
- (9) M. N. Skvortsov et al., Quantum Electron. 34, 1101 (2004).
- (10) R. M. Macfarlane, D. P. Burum, R. M. Shelby, Phys. Rev. Lett. 49, 636 (1982).
- (11) K. D. Böklen et al., Z. Phys. A 274, 195 (1975).
- (12) A. Ginibre, Phys. Scr. 23, 260 (1981).
- (13) A. Ginibre, Thèse Université de Paris-Sud, Centre d’Orsay (1988).
- (14) G. H. Guthöhrlein, Helmut-Schmidt-Universität der Bundeswehr Hamburg (Germany), unpublished energy levels and transition lines of praseodymium.
- (15) L. Windholz, Technische Universität Graz (Austria), unpublished energy levels and transition lines of praseodymium.
- (16) R. Zalubas, B. R. Borchardt, J. Opt. Soc. Am. 63, 102 (1973).
- (17) W. C. Martin, R. Zalubas, L. Hagan, ”Atomic Energy Levels - the Rare Earth Elements”, National Bureau of Standards, U.S.G.P.O. (Washington DC 1978).
- (18) W. J. Childs, L. S. Goodman, Phys. Rev. A 24, 1342 (1981).
- (19) T. Kuwamoto et al., J. Phys. Soc. Japan 65, 3180 (1996).
- (20) A. Krzykowski et al., Opt. Commun. 140, 216 (1997).
- (21) B. Furmann, Thesis, TU Poznań (1998).
- (22) A. Krzykowski, Thesis, TU Poznań (1998).
- (23) D. El Bakkali, Thesis, Helmut-Schmidt-Universität der Bundeswehr Hamburg (Germany), Fakultät für Elektrotechnik (2006).
- (24) B. Furmann et al., Phys. Scr. 74, 658 (2006).
- (25) Evaluation program Fitter for hyperfine structure measurements, Helmut-Schmidt-Universität der Bundeswehr Hamburg (Germany), laboratory for experimental physics, unpublished.
- (26) A. Ginibre - private communication to G. H. Guthöhrlein.
- (27) C. Schwedes et al., Appl. Phys. B 76, 143 (2003).
- (28) A. Friedenauer et al., Appl. Phys. B 84, 371 (2006).
- (29) J. T. Höffges et al., J. Mod. Opt. 44, 1999 (1997).
- (30) V. Batteiger et al., Phys. Rev. A 80, 022503 (2009).
- (31) T. Schätz et al., J. Mod. Opt. 54, 2317 (2007).
- (32) A. Friedenauer et al., Nat. Phys. 4, 757 (2008).
- (33) J. P. Home et al., Science 325, 1227 (2009).
- (34) H. Schmitz et al., Phys. Rev. Lett. 103, 090504 (2009).