On the Kennicutt-Schmidt relation of low-metallicity high-redshift galaxies
Abstract
We present results of self-consistent, high-resolution cosmological simulations of galaxy formation at . The simulations employ recently developed recipe for star formation based on the local abundance of molecular hydrogen, which is tracked self-consistently during the course of simulation. The phenomenological formation model accounts for the effects of dissociating UV radiation of stars in each galaxy, as well as self-shielding and shielding of by dust, and therefore allows us to explore effects of lower metallicities and higher UV fluxes prevalent in high redshift galaxies on their star formation. We compare stellar masses, metallicities, and star formation rates of the simulated galaxies to available observations of the Lyman Break Galaxies (LBGs) and find a reasonable agreement. We find that the Kennicutt-Schmidt (KS) relation exhibited by our simulated galaxies at is substantially steeper and has a lower amplitude than the relation at . The predicted relation, however, is consistent with existing observational constraints for the Damped Lyman (DLA) and LBGs. Our tests show that the main reason for the difference from the local KS relation is lower metallicity of the ISM in high redshift galaxies. We discuss several implications of the metallicity-dependence of the KS relation for galaxy evolution and interpretation of observations. In particular, we show that the observed size of high-redshift exponential disks depends sensitively on their KS relation. Our results also suggest that significantly reduced star formation efficiency at low gas surface densities can lead to strong suppression of star formation in low-mass high-redshift galaxies and long gas consumption time scales over most of the disk in large galaxies. The longer gas consumption time scales could make disks more resilient to major and minor mergers and could help explain the prevalence of the thin stellar disks in the local universe.
Subject headings:
cosmology: theory – galaxies: evolution – galaxies: formation – stars:formation – methods: numerical1. Introduction
The hierarchical Cold Dark Matter (CDM) structure formation paradigm (White & Rees, 1978; Blumenthal et al., 1984) has proved to be remarkably successful both in predicting and explaining a variety of observational data from the detailed properties of the temperature anisotropies of the Cosmic Microwave Background (Dunkley et al., 2009) to the linear (e.g., Tegmark et al., 2006) and nonlinear (e.g., Springel et al., 2006; Conroy et al., 2006; Kravtsov, 2006; Wetzel & White, 2009) clustering of galaxies.
Galaxy formation modeling within the CDM framework has produced a general picture of how galaxy-sized objects collapse out of primordial density fluctuations (e.g., Steinmetz & Navarro, 2002; Springel & Hernquist, 2003; Mayer et al., 2008). Nevertheless, some key aspects of the picture are still being developed (Birnboim & Dekel, 2003; Kereš et al., 2005) and accurate predictions of even the basic properties of galaxies, such as luminosities, colors, metallicities, and gas content remain a challenge (e.g., Mayer et al., 2008). These properties depend sensitively on the details of star formation. The root of the challenge is therefore our lack of full understanding of how gas is converted into stars under different conditions during different stages of galaxy evolution.
Empirical studies of the Kennicutt-Schmidt (KS) relation (Schmidt, 1959; Kennicutt, 1989, 1998) between the total surface density of the neutral gas , or its specific phase (atomic or molecular), and surface density of star formation rate established that the KS relation can be approximated by a power-law, , with (or, more generally, between 1 and 2) at high surface densities, when is dominated by the molecular gas, but steepens considerably at at (Kennicutt, 1998; Martin & Kennicutt, 2001; Wong & Blitz, 2002a; Heyer et al., 2004; Boissier et al., 2007; Bigiel et al., 2008; Roychowdhury et al., 2009; Bolatto, 2009). These studies, however, have been limited to samples of nearby galaxies with a relatively narrow range of metallicities () and morphologies (thin gaseous disks; see however Roychowdhury et al., 2009).
Observational picture remains sketchy at higher redshifts and lower metallicities. On one hand, recent studies show that the power law KS relation between star formation and molecular gas surface density holds in actively star forming galaxies at higher redshifts (e.g., Bouché et al., 2007; Baker et al., 2004a). On the other hand, recent searches for the UV emission associated with young stars in damped Ly systems (DLA; Wolfe & Chen, 2006) and in Ca II absorbers at low redshifts (Wild et al., 2007) indicate that at the gas surface densities characteristic for these systems ( or ) is an order of magnitude lower than implied by the local KS relation. A similar result is indicated by recent studies of the Lyman Break Galaxies (Rafelski et al., 2009; Rafelski, 2009).
Given that the typical metallicity of the DLA systems is considerably lower than solar111We refer to “solar metallicity” as a typical gas metallicity in the solar neighborhood, by mass, rather than the metallicity of the Sun, which has been recently revised downward. (Fox et al., 2009, and referencse therein), this may indicate that the relation is significantly lower at these surface densities in systems of low metallicity. The first evidence of this in the nearby galaxies is that the KS relation in the SMC appears to be significantly steeper than at (Bolatto, 2009).
Overall, the trends described above can be expected. Observations show that star formation in galaxies correlates strongly with the molecular gas (e.g., Wong & Blitz, 2002b). At the same time, SFR has only weak or no correlation with the density of atomic gas (Wong & Blitz, 2002b; Kennicutt et al., 2007; Bigiel et al., 2008). We can thus expect that relation with will depend on the molecular fraction of the gas . The molecular fraction in observed galaxies is controlled by the gas density, FUV flux, and pressure (e.g., Blitz & Rosolowsky, 2006), consistent with theoretical expectations (Elmegreen, 1993; Elmegreen & Parravano, 1994; Robertson & Kravtsov, 2008), but is also expected to be sensitive to the dust content (and thus metallicity) of the gas because dust plays an important role both in shielding molecular gas from UV radiation and in catalyzing production of (e.g., Stahler & Palla, 2005). Moreover, the efficiency with which a galaxy is able to build high-density molecular regions should depend on metallicity, because the compression of gas in the radiative shocks, arising in the highly turbulent interstellar medium (ISM) of gaseous disks, should depend on the metallicity-dependent cooling rate.
These considerations suggest that in order to make progress in our modeling of star formation in galaxies, we need simulations with both the high spatial and mass resolution to resolve the density structure and thermal state of different regions of the ISM in galaxies and a model for formation of molecular hydrogen. Several theoretical models incorporating some of these elements and potentially capable of predicting dependence of star formation relation on ISM properties have been developed recently (Krumholz & McKee, 2005; Pelupessy et al., 2006; Robertson & Kravtsov, 2008; Tasker & Bryan, 2008; Schaye & Dalla Vecchia, 2008; Gnedin et al., 2009; Tasker & Tan, 2009; Krumholz et al., 2009b; Pelupessy & Papadopoulos, 2009). These models have shown that thermodynamics of the ISM can control the shape of the density PDF of the ISM gas (Wada & Norman, 2001, 2007; Wada et al., 2002; Kravtsov, 2003; Tasker & Bryan, 2008; Robertson & Kravtsov, 2008) which, in turn, can affect the KS relation. The general prediction of the models that incorporate the physics of atomic-to-molecular transition at the boundaries of molecular clouds is that the density of this transition, controlled primarily by dust abundance (i.e., metallicity of the gas), is a key factor affecting the amplitude and slope of the KS relation (Gnedin et al., 2009; Krumholz et al., 2009b). The models of Robertson & Kravtsov (2008) have also highlighted importance of the interstellar radiation field for controlling the abundance of low-density, diffuse molecular gas (Elmegreen, 1993), as well as the slope and amplitude of the large-scale KS relation and metallicity of the gas. So far, however, none of the models have considered ISM of galaxies arising and evolving self-consistently in cosmological context.
In this paper, we present results of self-consistent, high-resolution cosmological simulations of galaxy formation, which employ the metallicity-dependent model of presented in Gnedin, Tassis, & Kravtsov (2009) and Gnedin & Kravtsov (2010). In the latter paper we also study sensitivity of global star formation to the full range of metallicities and UV fluxes. The focus of this paper is to explore the predictions of our -based star formation recipe for the KS relation in the low-metallicity, high UV-flux environments of high-redshift galaxies and compare these predictions with the existing observational constraints from DLA and Lyman Break Galaxies (LBGs).
2. Simulations and star formation model
The physical ingredients and computational setup for the simulation we use in this paper are described in Gnedin et al. (2009). As a brief summary, the Adaptive Refinement Tree (ART) code (Kravtsov, 1999; Kravtsov et al., 2002; Rudd et al., 2008) uses adaptive mesh refinement in both the gas dynamics and gravity calculations to achieve high dynamic range in spatial scale. The high-mass resolution is achieved by using the standard “zoom-in” initial conditions with particles of smaller mass resolving Lagrangian region of a system of interest.
The specific initial conditions setup we use in this paper is a Lagrangian region corresponding to five virial radii of a galactic system, which evolves to approximately Milky Way mass () at , with the mass resolution of in dark matter, in baryons, and with the spatial resolution of (in physical units) within the region. This Lagrangian region is embedded into a cubic volume of comoving Mpc on a side, which is followed with a coarse grid outside the Lagrangian region with periodic boundary conditions.
Our fiducial simulation includes star formation and supernova enrichment and thermal energy feedback, and follows self-consistently the 3D radiative transfer of UV radiation from individual stellar particles using the OTVET approximation (Gnedin & Abel, 2001). The simulation incorporates non-equilibrium chemical network of hydrogen and helium and non-equilibrium, metallicity-dependent cooling and heating rates, which make use of the local abundance of atomic, molecular, and ionic species and UV intensity, followed self-consistently during the course of the simulation.
A phenomenological model of molecular hydrogen formation is used to identify the locations of molecular clouds in the simulated galaxies, as described in Gnedin et al. (2009) and, in more detail in Gnedin & Kravtsov (2010). The model incorporates both self-shielding of molecular hydrogen from the UV radiation and the shielding by dust and takes into account catalyzing effect of dust on formation. The local abundance of dust in our model is assumed to linearly scale with gas metallicity, which is consistent with observations of the MW, LMC, and SMC (Gnedin et al., 2009; Gnedin & Kravtsov, 2010). Gas metallicity in the simulations is modeled by including metal enrichment by supernovae (both type II and Ia) assuming standard yields, and by stars via wind mass loss, with the total amount of heavy elements released into the ISM determined by the assumed Miller-Scalo IMF of the stars (see Kravtsov, 2003, for details). Once released into the gas the heavy elements are advected by the code in the same way as the gas.
We calibrate our model to fit the observed atomic and molecular gas fraction as a function of column density in the different metallicity environments of the Milky Way, LMC, and SMC and other nearby galaxies (Gnedin et al., 2009; Gnedin & Kravtsov, 2010). The model reproduces the metallicity dependence of the column density at which a sharp transition from the atomic to fully molecular gas occurs.
The star formation recipe adopted in this work is similar to the recipe 2 of Gnedin et al. (2009), albeit with somewhat different parameters. Specifically, stellar particles are formed in cells that have mass fraction of molecular hydrogen higher than according to the rate:
| (1) |
where is the density of molecular hydrogen, , is the free-fall time for a uniform sphere, years is the free-fall time in the gas with the total hydrogen number density of , and is star formation efficiency per free fall time (e.g., Krumholz & McKee, 2005; McKee & Ostriker, 2007). We adopt the efficiency of consistent with observational constraints for the average efficiency of star formation in the molecular clouds of the Milky Way and other nearby galaxies (Krumholz & Tan, 2007; McKee & Ostriker, 2007). The we adopt assumes that in low density cells, in which molecular fraction is below unity, star formation proceeds mainly in unresolved molecular clouds on subgrid scales. This assumption then also motivates setting the maximum free fall time to corresponding to the number density of typical average density of molecular clouds. The in these cells then can be viewed as reflecting the fraction of the total gas in such star forming molecular clouds, which themselves have , rather than incomplete conversion of the atomic gas into the molecular form inside the clouds.
Note that the empirical calibration of both the formation model calibration and the efficiency of star formation is done on small scales of individual molecular clouds. The results presented in this paper, however, are on global kiloparsec scales and the model was not adjusted in any way to produce these results.
3. Star formation in high redshift galaxies
3.1. Global properties of simulated galaxies
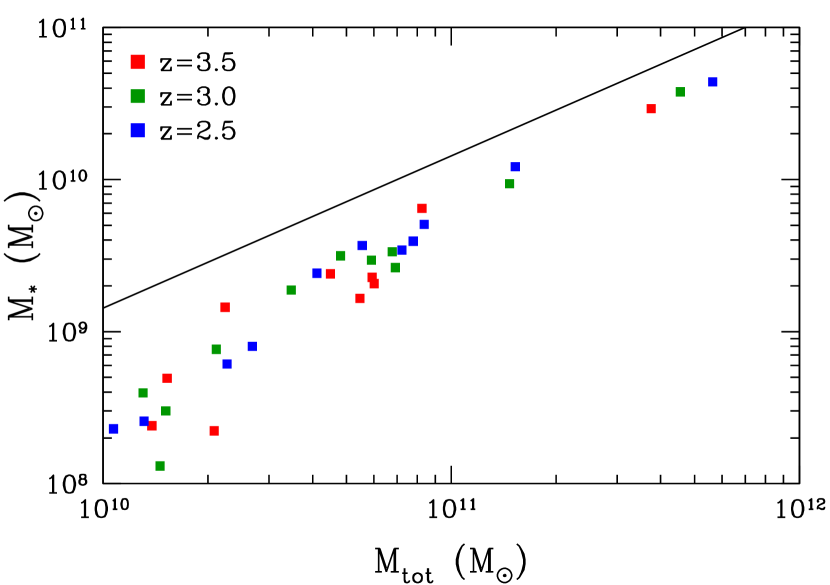
Before we address the star formation relations, we need to consider the bulk properties of simulated galaxies to make sure they can be plausible counterparts of observed LBGs and DLAs. In addition to the main Milky Way progenitor, the fully resolved Lagrangian region of the simulation volume contains a number of smaller mass galaxies. Figure 1 shows the stellar masses of the simulated galaxies versus the total mass of their parent halos, defined as a mass within a spherical radius enclosing overdensity of 180 with respect to the mean density, at redshifts .222We only include in Fig. 1 and the following figures galaxies whose centers are fully resolved to the highest resolution of our simulation ( at , nine levels of refinement), with the sole exception of Fig. 7. The figure shows that simulated galaxies span almost two orders of magnitude of total mass () and more than two orders of magnitude of stellar mass (). Interestingly, the correlation has the shape qualitatively similar to that required to explain the difference between the predicted halo mass function and observed stellar mass function at lower redshifts (e.g., Conroy & Wechsler, 2009; Moster et al., 2009b). This indicates that processes included in our simulations could, at least partly, be responsible for the observed shape of stellar mass function. We note, however, that normalization of this relation in our simulations is considerably higher than that indicated by observational analyzes (e.g., see Fig. 2 in Conroy & Wechsler, 2009), especially for lower mass systems. This indicates that star formation in small-mass halos is still considerably more efficient in our simulations than in real galaxies.
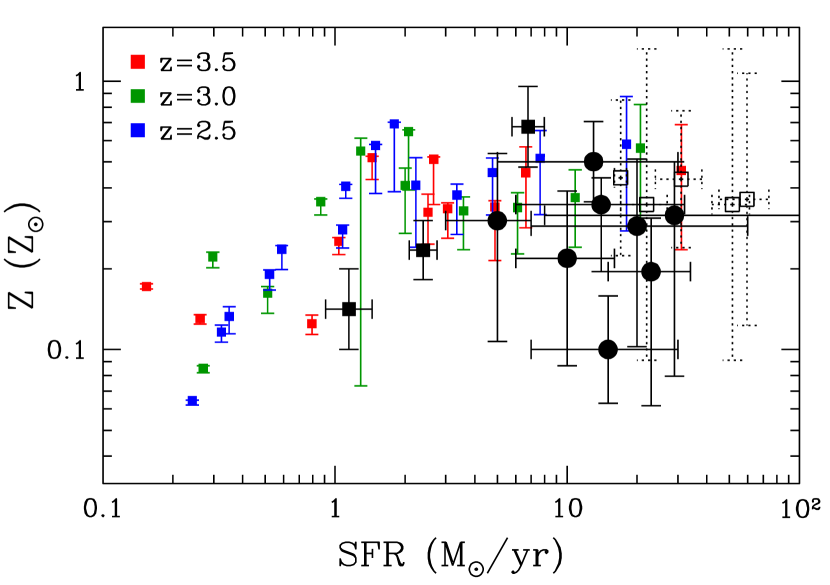
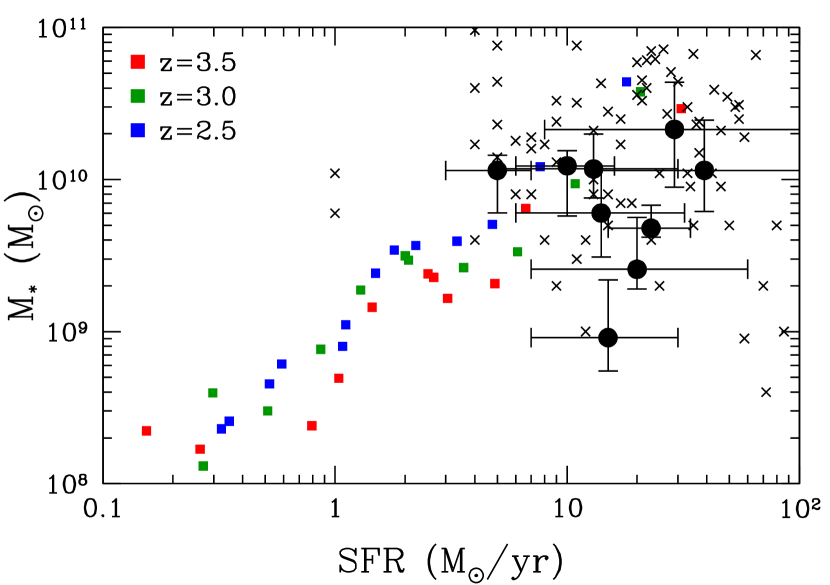
The star formation rates, stellar masses, metallicities, and radiation fields of these galaxies are shown in Figures 2 at three redshifts in the range . For comparison, we also show for the observational estimates of the same properties for the Lyman Break Galaxies from Mannucci et al. (2009b), Erb et al. (2006a), and Pettini et al. (2001). Since the volume of our simulation is relatively small, the overlap with the observed galaxies in stellar mass is limited. In the region of overlap, however, our model galaxies have star formation rates and stellar masses consistent with those of observed LBGs. The gas metallicities of our model galaxies are consistent with observations within the errorbars333We note, however, that metallicities in the simulations carry all the systematic uncertainties of the adopted nucleosynthetic yields and of the IMF..
The average metallicities of the simulated galaxies are higher than the typical metallicity of DLA systems at (Prochaska et al., 2003; Fynbo et al., 2008). This may be because the masses of most DLA systems are lower than the range of halo masses resolved in our simulations or because DLA systems probe the outer regions of the disks where metallicities are systematically lower due to metallicity gradients. It is also possible that we overestimate star formation efficiency and hence metal enrichment in objects of a given mass. The trends of star formation relations with metallicity discussed below can thus be expected to be even stronger for the real DLA systems compared to the higher-metallicity galaxies in our simulations.
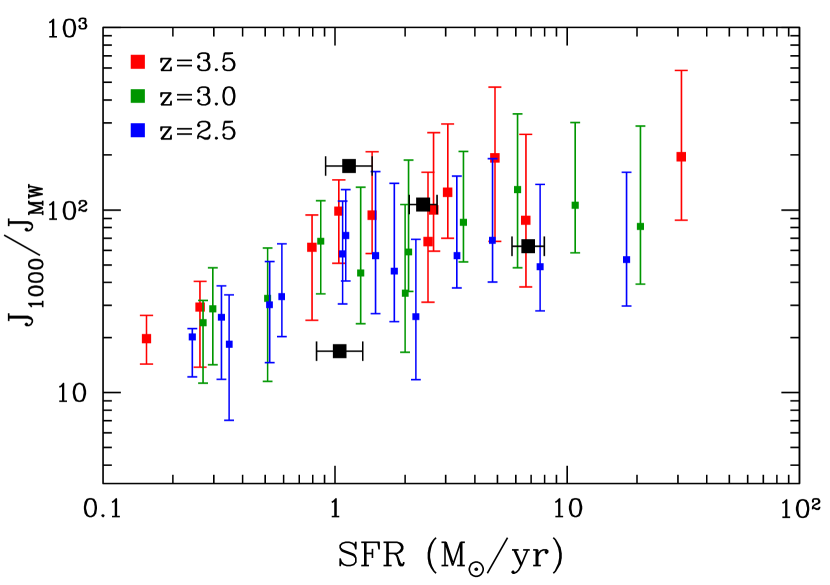
The radiation field in a galaxy may vary widely between different locations and environments. To estimate a “typical ISM value”, we show the median radiation field and its 10% to 90% range in the gas with density between and in the bottom panel of Fig. 2. The radiation fields in the ISM of our model galaxies are significantly above the typical UV intensity in the Milky Way (which we round off to at , consistent with the measurements of Draine 1978 and Mathis et al. 1983), but in agreement with the typical radiation fields measured in high-redshift galaxies (Chen et al., 2009).
3.2. The Kennicutt-Schmidt relation at high redshifts
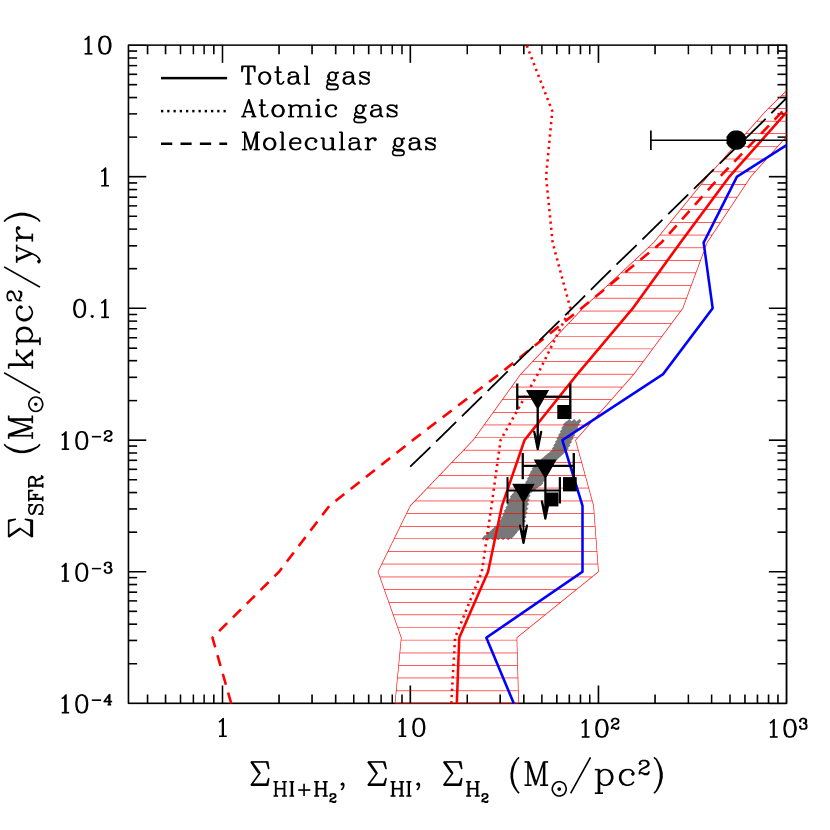
Figure 3 shows the KS relation between star formation and gas surface densities at for galaxies formed in our cosmological simulations. The star formation rate is averaged over , and the gas and SFR surface densities are measured on the scale of . We have verified that our results are robust to changes in the averaging scale (as long as the scale is pc) and the period of time over which the star formation rate is averaged (for time intervals smaller than ). The figure shows that the predicted KS relation for the galaxies is significantly steeper than the relation for galaxies (the Kennicutt 1998 fit to local galaxies is shown by the dashed line) at and its amplitude is an order of magnitude lower than the amplitude of the Kennicutt (1998) fit at . The corresponding and correlations in Figure 3 show that the steep relation is due to the rapidly decreasing ratio of molecular to atomic gas, , at . Likewise, the surface density at which surface density saturates is , considerably larger value than saturation surface density observed for local galaxies (e.g., Wong & Blitz, 2002a).
The predicted KS relation for galaxies is consistent with the recent measurements of star formation densities in Lyman Break Galaxies by Rafelski et al. (2010, in preparation), which are shown as a grey band in Fig. 3, and are complemented by the measurement of and for the lensed Lyman Break Galaxy cB58 (Baker et al., 2004a) at high gas surface density.
Our simulations are also consistent with the upper limits on star formation surface density in the DLA systems obtained by Wolfe & Chen (2006), which are shown in Fig. 3 with solid triangles and squares. The three different points of each point type correspond to the three representative choices of the smoothing angular scale in Table 1 of Wolfe & Chen (2006). Solid squares show the original limits of Wolfe & Chen (2006). However, these limits were derived assuming a specific model of “monolithic” gaseous disks for DLA systems. This model predicts a specific slope of on the high end of the column density distribution. This value of the slope is only marginally (at ) consistent with the value of measured by Prochaska & Wolfe (2009) from the Data Release 5 (DR5) of the Sloan Digital Sky Survey (SDSS), but is close to the value of measured recently by Noterdaeme et al. (2009). The two recent measurements indicate that there remains a substantial uncertainty in the high- slope of the DLA column density distribution.
Given the uncertainty in the high-end slope, we also consider an alternative model for DLAs, in which DLA absorption arises in a single spherical cloud. The clouds may contain a mixture of atomic and molecular gas and may have an arbitrary spatial distribution (including the disk-like), as long as a probability of intersecting two clouds by a single line of sight is small. This picture may correspond, for example, to the DLAs arising in the extended HI envelopes of molecular clouds. In this model any value for the high-end slope of the column density distribution is allowed. These two geometric DLA models bracket the plausible range of possible geometries and, thus, account for the implicit horizontal uncertainty of the Wolfe & Chen (2006) upper limits.
These limits, recomputed for the single cloud model, are shown in Fig. 3 as downward triangles, with the width of the errorbars on the triangles reflecting errors on the observed high-end slope from Prochaska & Wolfe (2009). The error bars also encompass the Noterdaeme et al. (2009) value and the value of for the monolithic disk model. The error bars of the triangles may serve, therefore, as a reasonable estimate of the horizonthal uncertainty of the limits due to the current uncertainty in the high-end DLA column density distribution. We have converted the Wolfe & Chen (2006) upper limits into linits in the plane by solving their equations 3 and 6 (using the values from Table 1) for normalization of the KS relation, , and effective DLA column density, , and converting into .
This conversion itself relies on a subtle assumption that requires clarification. DLA lines of sight probe column density averaged on transverse scale of pc, while in Fig. 3 is averaged on the scale of pc. The relation between the gas column densities would of course be direct if the ISM is uniform over this range of scales, but the ISM density both in real and simulated galaxies is very far from uniform and exhibits densities ranging by several orders of magnitude from the average density regions () to dense molecular clouds (). It may thus seem like there may not be any connection at all between the column densities measured by the DLAs and average , which is a mass-weighted average measured on kpc scale. For example, imagine a simple toy ISM model, in which most of the mass is in dense, massive clouds with a covering fraction so low that it is very improbable to intersect them with DLA los. In this case, area-weighted surface density can be arbitrarily low, while averaged on 500 pc scale can be arbitrarily high.
However, there are at least two arguments that correlation between and should be tight even for non-uniform ISM. First, the DLA column density is an average over tens and hundreds of pc in the los direction to quasar. Second, average effective estimated for an ensemble of DLAs corresponds to the area-weighted average surface density of ISM in galaxies probed by the DLA lines of sight. For a realistic probability density distribution (PDF) of ISM the area-weighted mean surface density should be quite close to the mass-weighted average. For example, for the log-normal projected density PDF, which is a sensible approximation to the PDF of real and model galaxies (e.g., Elmegreen, 2002), the area- and mass-weighted surface densities are directly related (see, e.g., Ostriker et al., 2001). We note, however, that the exact form of the PDF for real galaxies is yet known and so the factor in converting into is uncertain. Our conversion and conversion in Wolfe & Chen (2006), assume a tight one-to-one relation between and .
Figure 3 shows that the KS relation in our galaxies is generally consistent with the upper limits of Wolfe & Chen (2006), especially if we recall that metallicities of these galaxies are somewhat higher than the typical metallicities of DLAs. If we only consider the gas with , typical for the DLA systems, our predictions are fully consistent with the Wolfe & Chen (2006) upper limits.
What is the primary cause of the difference between KS relation and the relation indicated by observations and our simulations? The high-redshift galaxies differ from their low redshift counterparts by their systematically lower metallicities and higher interstellar UV fluxes.444There are of course further differences between local and high redshift galaxies, such as geometry of the gas distribution, amount of ISM turbulence, etc. These, however, appear to have relatively minor effect on the KS relation. The low metallicities are due to generally lower stellar masses and higher gas fractions of high-redshift galaxies, which are in the earlier stages of chemical evolution compared to their local counterparts. The higher UV fluxes are due to the considerably higher star formation rates, smaller sizes, and lower abundance of the UV absorbing dust in high redshift systems.
In principle, both lower metallicity and higher UV flux can affect star formation in galaxies. Lower metallicity and dust abundance makes it more difficult to form dense molecular regions in which stars form555For example, the transition from atomic to fully molecular gas occurs at in the Milky way, but at in the factor of 5-10 lower metallicity ISM of the SMC (Browning et al., 2003; Gillmon et al., 2006, this difference is partly due to a different dust extinction law). (e.g., Schaye, 2004; Krumholz et al., 2008, 2009a; Gnedin et al., 2009; Gnedin & Kravtsov, 2010), while high UV flux can dissociate such regions (e.g., Elmegreen, 1993; Robertson & Kravtsov, 2008; Gnedin & Kravtsov, 2010).
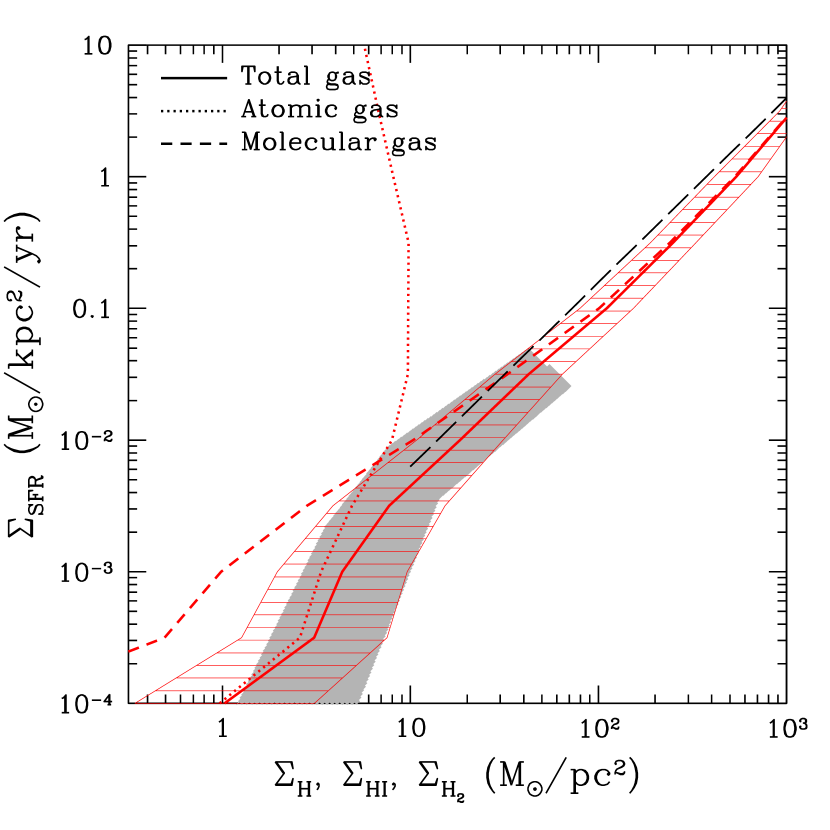
To gauge the relative importance of the metallicity and interstellar UV flux we have rerun our simulation from to () resetting the dust-to-gas ratio used in the calculations of H2 abundance and UV field to fixed multiples of the Milky Way values. We present the results of such test simulations for a full grid of metallicities and UV intensities in the companion paper (Gnedin & Kravtsov, 2010). Here we present only results for the rerun in which dust-to-gas abundance and UV flux were set to their Milky Way values. Figure 4 shows the KS relation for this test re-simulation at . As before, the star formation rate in the simulations is averaged over and the gas and SFR surface densities are averaged on the scale of pc. The figure shows that in the case of the MW metallicity and UV flux the predicted KS relation is consistent with the observed relation for the galaxies (Kennicutt, 1998; Bigiel et al., 2008). In particular, the predicted KS relation matches the approximately linear relation relation at (with indication of steepening to at ) and the significant steepening of the relation at . Simulations also reproduce the observed scatter around the mean relation reasonably well. Finally, note that the atomic hydrogen in this case saturates at surface density of , which is consistent with observations of nearby galaxies (e.g., Wong & Blitz, 2002a; Bigiel et al., 2008) and a factor of five smaller than the corresponding value for the self-consistent metallicities and UV fluxes of the simulated galaxies in Fig. 3.
The fact that the local KS relation is reproduced in simulations of high redshift disks with higher metallicity and lower UV flux indicates that the differences in the ISM structure between high and low redshift galaxies play a relatively minor role in shaping this relation. Although the density PDF in gaseous disks can be important in shaping the slope of the KS relation (Kravtsov, 2003; Tassis, 2007; Robertson & Kravtsov, 2008), our test shows that the main factors behind the difference between and KS relations are gas metallicity and UV flux in the ISM. Furthermore, additional experiments, presented in the companion paper (Gnedin & Kravtsov, 2010), show that the difference in metallicity is the primary reason behind the differences in the KS relations shown in figures 3 and 4.
The UV flux does affect star formation in the individual patches of the ISM significantly, but it also affects the surface density of atomic and molecular gas. The changes of and affected by the change in the UV flux are such that a given patch of ISM is moving approximately along the KS relation for a varying FUV flux. The average KS relation is therefore less sensitive to the changes in UV flux than to the changes in the metallicity of the same magnitude, even though star formation in individual ISM regions and galaxies is strongly affected. The change of metallicities, however, affects without affecting the surface density of neutral gas significantly, thereby changing the mean KS relation. The effect of the UV flux on the KS relation does increase for lower metallicity galaxies, as we discuss in the companion paper.
The conclusion from our experiments is therefore that the main reason the KS relation of high redshift galaxies is significantly different from their low-redshift counterparts is their lower metallicity and dust abundance, while the higher FUV flux and differences in density PDFs are secondary factors.
4. Discussion and Conclusions
In this study we use recently developed recipe for star formation in simulations of galaxy formation based on the local abundance of molecular hydrogen (eq. 1) to examine the Kennicutt-Schmidt relation expected in high redshift systems. The abundance is tracked self-consistently in the simulation using a phenomenological model, which includes effects of dissociating UV radiation, as well as self-shielding and shielding of by dust (see Gnedin et al., 2009; Gnedin & Kravtsov, 2010, for details of star formation recipe and model).
Our main result, presented in Fig. 3, is that the KS relation in the low-metallicity and high UV flux environments of is substantially steeper and has a lower amplitude than that of the galaxies at . As discussed in the previous section, the main reason for the difference is lower metallicity and dust-to-gas ratio of high redshift galaxies. While our tests show that the UV flux does affect the star formation drastically, it simultaneously affects surface density of neutral gas in such a way that the shape and normalization of the KS relation are largely unaffected.
Our predicted KS relation for galaxies agrees well with a recent estimate of in the Lyman Break Galaxies by Rafelski et al. (2009, in preparation) at low gas surface densities and measurements of SFR and gas surface density in LBG cB58 at high surface densities (Baker et al., 2004a). Our results are also consistent with the upper limits on star formation surface density derived for the subset of DLA systems at gas surface densities of (Wolfe & Chen, 2006). These limits are lower by a factor of ten compared to the for the local galaxies at the same gas surface densities (Kennicutt, 1998) similar to our simulation results. We note, however, that the typical metallicity of the gas shown in Fig. 2 is a few times higher than the typical metallicity of the DLA systems (e.g., Prochaska et al., 2003; Fynbo et al., 2008). Given that effect of decreasing metallicity on the KS relation is to steepen it at low surface densities and lower its amplitude, we can expect that for systems of lower metallicity than those we have considered in this study the KS relation should have even steeper slope and lower amplitude, as is shown by the solid blue line in Fig. 3.
A qualitatively similar trend of the KS relation with metallicity was recently predicted by Krumholz et al. (2009b) using a model of atomic to molecular transition in molecular complexes based on the Wolfire et al. (2003) semi-analytic model of atomic ISM (see also McKee & Krumholz, 2009). Their model predicts significant steepening of the KS relation below gas surface density of , where is the metallicity of the gas in the units of and is the ISM clumping factor. The latter reflects the difference between the surface density of the ISM averaged on some scale pc and the surface density of individual giant molecular complexes on the scale of pc. For averaging scales of pc used in our calculations the clumping factor should be (Krumholz et al., 2009b). The model thus predicts the steepening of the KS relation at for solar metallicities and for characteristic for our simulated galaxies. These values are considerably lower than the transition surface density of we derive for our simulated galaxies. It is not entirely clear what the source of this difference is. We note, however, that the mass fraction of molecular gas for a given large-scale surface density depends on the shape of the density PDF of the ISM, which may well depend on the gas surface density (e.g., Kravtsov, 2003). This dependence may not be captured by a single clumping factor independent of .
The strong trend of the KS relation with metallicity has several interesting implications for theoretical scenarios of galaxy formation and interpretation of observations of high redshift galaxies666For example, significantly different KS relation for high redshift galaxies may strongly bias gas mass estimates that use calibration of this relation for systems of metallicity significantly lower than solar (e.g., Erb et al., 2006b; Mannucci et al., 2009a).. The trend implies, for example, that star formation in lower-metallicity high redshift galaxies should be more centrally concentrated compared to their local counterparts. In particular, the regions of high redshift disks with should be considerably dimmer than expected from the KS relation.
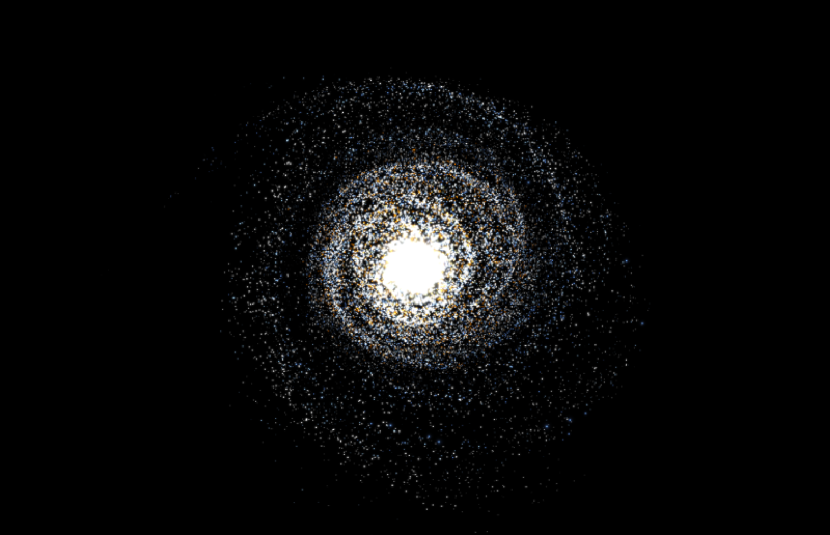
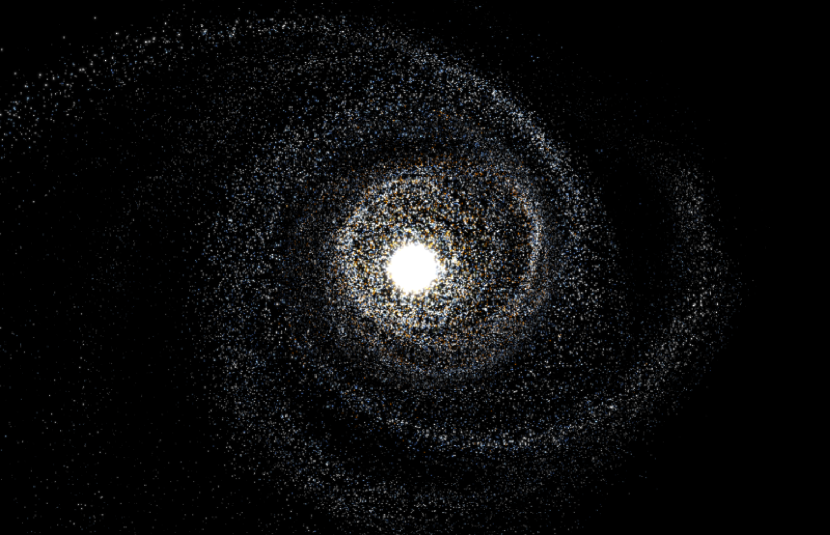
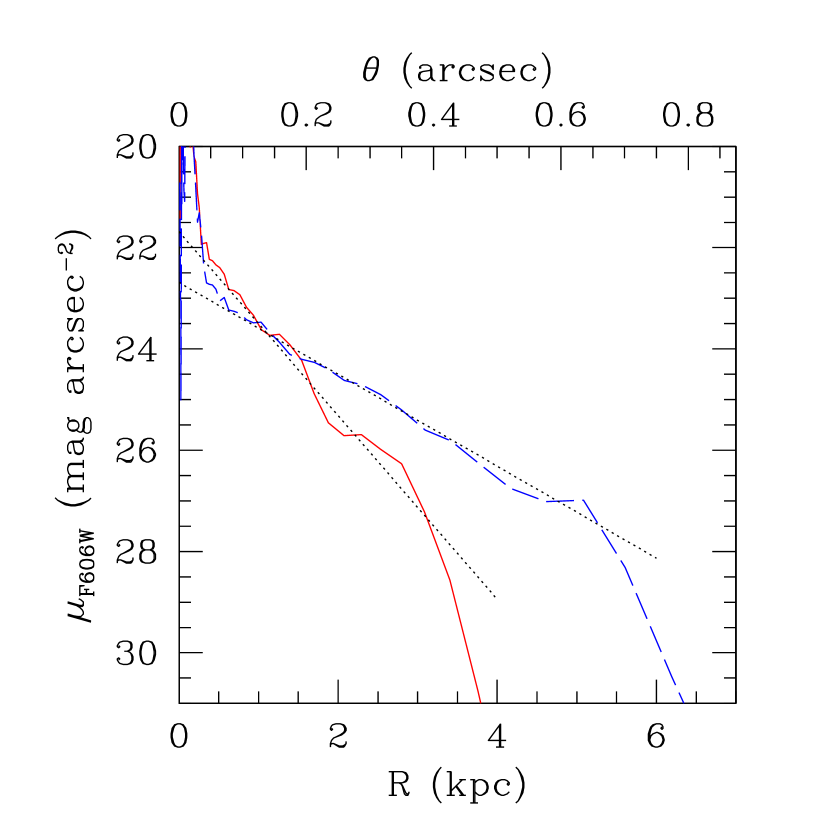
This trend is illustrated in Figures 5 and 6, which show distribution of young stars and rest-frame FUV surface brightness profiles (computed using the Flexible SPS code of Conroy & Gunn 2009) in the most massive galaxy in our self-consistent simulations compared to the test run, in which dust-to-gas ratio and UV flux were fixed to their MW values between and . The galaxies in this test run exhibit KS relation consistent with the local measurements (see Fig. 4). The star formation in the self-consistent run is concentrated towards the higher gas surface density central regions.
Figure 6 shows that the apparent size of the simulated galaxy sensitively depends on the physics of molecular gas and the form of the KS relation. In both self-consistent and test runs, the rest-frame UV emission of the simulated galaxy is well described by the extended exponential disk profile (dotted lines). The effective half-light radii of the disks, however, are different by a factor of two: kpc and kpc in the self-consistent and test runs, respectively. This illustrates that to predict the observed sizes of galaxies, it is not sufficient to model dynamics of gas condensation and acquisition of angular momentum correctly. Correct modeling of star formation in gas of different densities is equally important.
Incidentally, the search for extended low surface brightness emission in the HUDF carried out by Wolfe & Chen (2006) did not identify any objects that had isophotal radii kpc corresponding to . Figure 6 shows that surface brightness profile of the galaxy in the self-consistent simulations is consistent with the observed paucity of such extended objects in the HUDF, while the profile of the galaxy in the test run is not consistent with that search. This is another illustration of the fact that the local KS relation would predict existence of extended low surface brightness disks at that are not observed in the HUDF, as emphasized by Wolfe & Chen (2006).
The emerging picture based on observational constraints (Wolfe & Chen, 2006; Baker et al., 2004b; Wolfe et al., 2004, 2008) and our simulations is therefore that DLA systems correspond to the lower metallicity low-mass halos in which there is little or no ongoing star formation or to the outskirts of low metallicity disks surrounding centrally-concentrated, actively star forming Lyman Break Galaxies. The latter picture is qualitatively similar to the low-metallicity dwarf galaxies, which often have a very compact stellar system embedded in an extended gas-rich disk (e.g., Meurer et al., 1996; Begum et al., 2006). In this picture the neutral atomic gas probed in absorption is largely inert to star formation, but actively star forming regions providing metals and UV heating may be located in the center or in spiral arms a few kiloparsecs away within the same system.
The long gas consumption time scales at would allow newly accreted gas to accumulate at these relatively low gas surface densities, instead of being consumed on a Gyr time scale. This can result in a more extended star formation history if the host galaxy evolves quiescently or provide gas reservoir for a starburst if the host object undergoes a major merger. It is also possible that accumulating gas in the disk undergoes a starburst as it is enriched by in situ star formation and its surface density increases due to accretion of new gas, thereby creating conditions for gravitational instabilities and widespread star formation (e.g., Bournaud et al., 2007; Agertz et al., 2009; Dekel et al., 2009). The overall effect of considerably suppressed star formation at is to preserve more gas in smaller mass objects for star formation in galaxies forming the bulk of their stars at lower () redshifts.
Another potentially very important implication of the more centrally concentrated star formation is that the stars formed at high-redshifts are confined to the high surface density regions and are therefore more resistant against dynamical heating in mergers. The outer gaseous disks are resilient to major mergers (e.g.. Robertson et al., 2004, 2006; Springel & Hernquist, 2005) and would help maintain nascent stellar disks dynamically cold during minor mergers (Moster et al., 2009a), thereby facilitating formation of thin stellar disks at later epochs and helping explain the prevalence of such disks in the local universe.
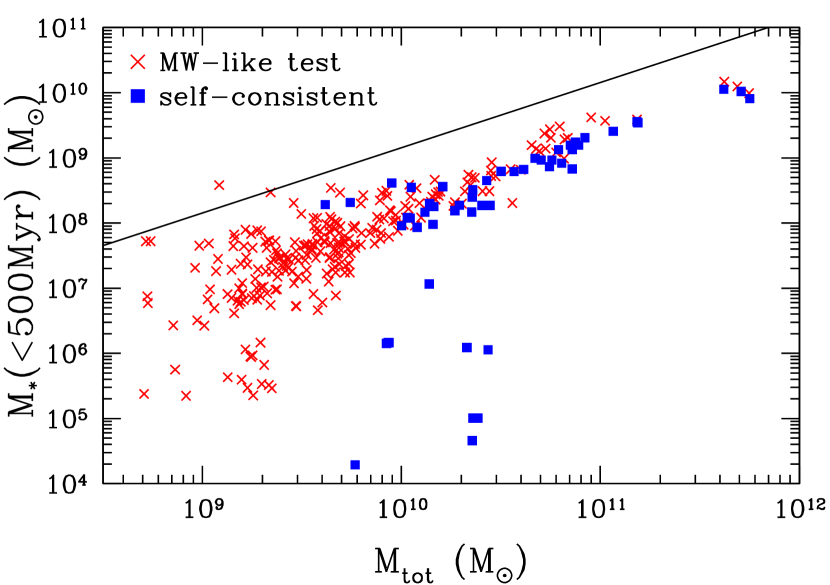
All these effects should be particularly salient in dwarf galaxies (), which have the lowest metallicities and surface gas densities and where suppression of star formation could thus expected to be particularly strong. We do indeed see a progressively lower efficiency of star formation in halos of lower mass (Fig. 1), and this decrease is not due to supernova feedback (as demonstrated by a comparison with test simulations in which the supernova feedback is artificially disabled). The fact that stellar mass is significantly decreased for a given in our star formation model compared to the standard star formation prescription is demonstrated in Figure 7. This figure shows masses of stars in simulated galaxies younger than 500 Myrs versus the total virial mass of their host halos in the full self-consistent simulation and in the test run in which dust-to-gas ration and FUV field were fixed to their Milky Way values. The latter test is equivalent to simply using the fixed density threshold for star forming gas, as is usually assumed in galaxy formation simulations.
The figure shows that self-consistent simulation with our H2-based star formation model produces systematically smaller stellar masses in simulated galaxies compared to the test run. The difference is only for the largest galaxies, but increases to a factor of two and more for smaller galaxies. Remarkably, for halo masses of the star formation is completely suppressed in the full simulation, while in the test simulation star formation is unabated down to smallest resolved halo masses, well below . This shows that low dust abundance and high FUV field can play a major role in suppressing star formation in low metallicity, low mass halos – the effect that can help explaining the difference between predicted steep small-mass slope of the halo mass function and the shallow observed faint-end slope of the luminosity function. Note that this suppression is achieved without efficient supernova feedback.
The results we presented in this paper thus indicate that other processes in the ISM in addition (or perhaps in lieu) of the standard supernova feedback may be shaping the evolution of galaxy population and setting the observed disk sizes. Investigating these processes is an interesting avenue for future research. Theoretical investigations in this direction would be greatly aided by the observations of molecular gas in high-redshift star forming galaxies provided by the CARMA and ALMA observatories in the near future.
References
- Agertz et al. (2009) Agertz, O., Teyssier, R., & Moore, B. 2009, MNRAS, 397, L64
- Baker et al. (2004a) Baker, A. J., Tacconi, L. J., Genzel, R., Lehnert, M. D., & Lutz, D. 2004a, ApJ, 604, 125
- Baker et al. (2004b) Baker, A. J., Tacconi, L. J., Genzel, R., Lutz, D., & Lehnert, M. D. 2004b, ApJ, 613, L113
- Begum et al. (2006) Begum, A., Chengalur, J. N., Karachentsev, I. D., Kaisin, S. S., & Sharina, M. E. 2006, MNRAS, 365, 1220
- Bigiel et al. (2008) Bigiel, F., Leroy, A., Walter, F., Brinks, E., de Blok, W. J. G., Madore, B., & Thornley, M. D. 2008, AJ, 136, 2846
- Birnboim & Dekel (2003) Birnboim, Y. & Dekel, A. 2003, MNRAS, 345, 349
- Blitz & Rosolowsky (2006) Blitz, L. & Rosolowsky, E. 2006, ApJ, 650, 933
- Blumenthal et al. (1984) Blumenthal, G. R., Faber, S. M., Primack, J. R., & Rees, M. J. 1984, Nature, 311, 517
- Boissier et al. (2007) Boissier, S., Gil de Paz, A., Boselli, A., Madore, B. F., Buat, V., Cortese, L., Burgarella, D., Muñoz-Mateos, J. C., Barlow, T. A., Forster, K., Friedman, P. G., Martin, D. C., Morrissey, P., Neff, S. G., Schiminovich, D., Seibert, M., Small, T., Wyder, T. K., Bianchi, L., Donas, J., Heckman, T. M., Lee, Y.-W., Milliard, B., Rich, R. M., Szalay, A. S., Welsh, B. Y., & Yi, S. K. 2007, ApJS, 173, 524
- Bolatto (2009) Bolatto, A. 2009, in preparation
- Bouché et al. (2007) Bouché, N., Cresci, G., Davies, R., Eisenhauer, F., Förster Schreiber, N. M., Genzel, R., Gillessen, S., Lehnert, M., Lutz, D., Nesvadba, N., Shapiro, K. L., Sternberg, A., Tacconi, L. J., Verma, A., Cimatti, A., Daddi, E., Renzini, A., Erb, D. K., Shapley, A., & Steidel, C. C. 2007, ApJ, 671, 303
- Bournaud et al. (2007) Bournaud, F., Elmegreen, B. G., & Elmegreen, D. M. 2007, ApJ, 670, 237
- Browning et al. (2003) Browning, M. K., Tumlinson, J., & Shull, J. M. 2003, ApJ, 582, 810
- Chen et al. (2009) Chen, H.-W., Perley, D. A., Pollack, L. K., Prochaska, J. X., Bloom, J. S., Dessauges-Zavadsky, M., Pettini, M., Lopez, S., Dall’aglio, A., & Becker, G. D. 2009, ApJ, 691, 152
- Conroy & Gunn (2009) Conroy, C. & Gunn, J. E. 2009, ArXiv e-prints
- Conroy & Wechsler (2009) Conroy, C. & Wechsler, R. H. 2009, ApJ, 696, 620
- Conroy et al. (2006) Conroy, C., Wechsler, R. H., & Kravtsov, A. V. 2006, ApJ, 647, 201
- Dekel et al. (2009) Dekel, A., Sari, R., & Ceverino, D. 2009, ApJ, 703, 785
- Draine (1978) Draine, B. T. 1978, ApJS, 36, 595
- Dunkley et al. (2009) Dunkley, J., Komatsu, E., Nolta, M. R., & et al. 2009, ApJS, 180, 306
- Elmegreen (1993) Elmegreen, B. G. 1993, ApJ, 411, 170
- Elmegreen (2002) —. 2002, ApJ, 577, 206
- Elmegreen & Parravano (1994) Elmegreen, B. G. & Parravano, A. 1994, ApJ, 435, L121+
- Erb et al. (2006a) Erb, D. K., Steidel, C. C., Shapley, A. E., Pettini, M., Reddy, N. A., & Adelberger, K. L. 2006a, ApJ, 646, 107
- Erb et al. (2006b) —. 2006b, ApJ, 646, 107
- Fox et al. (2009) Fox, A. J., Prochaska, J. X., Ledoux, C., Petitjean, P., Wolfe, A. M., & Srianand, R. 2009, A&A, 503, 731
- Fynbo et al. (2008) Fynbo, J. P. U., Prochaska, J. X., Sommer-Larsen, J., Dessauges-Zavadsky, M., & Møller, P. 2008, ApJ, 683, 321
- Gillmon et al. (2006) Gillmon, K., Shull, J. M., Tumlinson, J., & Danforth, C. 2006, ApJ, 636, 891
- Gnedin & Abel (2001) Gnedin, N. Y. & Abel, T. 2001, New Astronomy, 6, 437
- Gnedin & Kravtsov (2010) Gnedin, N. Y. & Kravtsov, A. V. 2010, in preparation
- Gnedin et al. (2009) Gnedin, N. Y., Tassis, K., & Kravtsov, A. V. 2009, ApJ, 697, 55
- Heyer et al. (2004) Heyer, M. H., Corbelli, E., Schneider, S. E., & Young, J. S. 2004, ApJ, 602, 723
- Kennicutt (1989) Kennicutt, Jr., R. C. 1989, ApJ, 344, 685
- Kennicutt (1998) —. 1998, ApJ, 498, 541
- Kennicutt et al. (2007) Kennicutt, Jr., R. C., Calzetti, D., Walter, F., Helou, G., Hollenbach, D. J., Armus, L., Bendo, G., Dale, D. A., Draine, B. T., Engelbracht, C. W., Gordon, K. D., Prescott, M. K. M., Regan, M. W., Thornley, M. D., Bot, C., Brinks, E., de Blok, E., de Mello, D., Meyer, M., Moustakas, J., Murphy, E. J., Sheth, K., & Smith, J. D. T. 2007, ApJ, 671, 333
- Kereš et al. (2005) Kereš, D., Katz, N., Weinberg, D. H., & Davé, R. 2005, MNRAS, 363, 2
- Kravtsov (1999) Kravtsov, A. V. 1999, PhD thesis, AA(NEW MEXICO STATE UNIVERSITY)
- Kravtsov (2003) —. 2003, ApJ, 590, L1
- Kravtsov (2006) —. 2006, proceedings of the XLIst Rencontres de Moriond (arXiv/0607463)
- Kravtsov et al. (2002) Kravtsov, A. V., Klypin, A., & Hoffman, Y. 2002, ApJ, 571, 563
- Krumholz et al. (2009a) Krumholz, M. R., Ellison, S. L., Prochaska, J. X., & Tumlinson, J. 2009a, ArXiv:0906.0983
- Krumholz & McKee (2005) Krumholz, M. R. & McKee, C. F. 2005, ApJ, 630, 250
- Krumholz et al. (2008) Krumholz, M. R., McKee, C. F., & Tumlinson, J. 2008, ArXiv:0805.2947, 805
- Krumholz et al. (2009b) —. 2009b, ApJ, 699, 850
- Krumholz & Tan (2007) Krumholz, M. R. & Tan, J. C. 2007, ApJ, 654, 304
- Mannucci et al. (2009a) Mannucci, F., Cresci, G., Maiolino, R., Marconi, A., Pastorini, G., Pozzetti, L., Gnerucci, A., Risaliti, G., Schneider, R., Lehnert, M., & Salvati, M. 2009a, MNRAS, 398, 1915
- Mannucci et al. (2009b) —. 2009b, ArXiv:0902.2398
- Martin & Kennicutt (2001) Martin, C. L. & Kennicutt, Jr., R. C. 2001, ApJ, 555, 301
- Mathis et al. (1983) Mathis, J. S., Mezger, P. G., & Panagia, N. 1983, A&A, 128, 212
- Mayer et al. (2008) Mayer, L., Governato, F., & Kaufmann, T. 2008, Advanced Science Letters, 1, 7
- McKee & Krumholz (2009) McKee, C. F. & Krumholz, M. R. 2009, ApJ submitted (arXiv/0908.0330)
- McKee & Ostriker (2007) McKee, C. F. & Ostriker, E. C. 2007, ARA&A, 45, 565
- Meurer et al. (1996) Meurer, G. R., Carignan, C., Beaulieu, S. F., & Freeman, K. C. 1996, AJ, 111, 1551
- Moster et al. (2009a) Moster, B. P., Maccio’, A. V., Somerville, R. S., Johansson, P. H., & Naab, T. 2009a, MNRAS submitted (arXiv/0906.0764)
- Moster et al. (2009b) Moster, B. P., Somerville, R. S., Maulbetsch, C., van den Bosch, F. C., Maccio’, A. V., Naab, T., & Oser, L. 2009b, ApJ submitted (arXiv/0903.4682)
- Noterdaeme et al. (2009) Noterdaeme, P., Petitjean, P., Ledoux, C., & Srianand, R. 2009, A&A, 505, 1087
- Ostriker et al. (2001) Ostriker, E. C., Stone, J. M., & Gammie, C. F. 2001, ApJ, 546, 980
- Pelupessy & Papadopoulos (2009) Pelupessy, F. I. & Papadopoulos, P. P. 2009, ApJ submitted (arxiv/0910.4905)
- Pelupessy et al. (2006) Pelupessy, F. I., Papadopoulos, P. P., & van der Werf, P. 2006, ApJ, 645, 1024
- Pettini et al. (2001) Pettini, M., Shapley, A. E., Steidel, C. C., Cuby, J.-G., Dickinson, M., Moorwood, A. F. M., Adelberger, K. L., & Giavalisco, M. 2001, ApJ, 554, 981
- Prochaska et al. (2003) Prochaska, J. X., Gawiser, E., Wolfe, A. M., Castro, S., & Djorgovski, S. G. 2003, ApJ, 595, L9
- Prochaska & Wolfe (2009) Prochaska, J. X. & Wolfe, A. M. 2009, ApJ, 696, 1543
- Rafelski (2009) Rafelski, M. 2009, private communication
- Rafelski et al. (2009) Rafelski, M., Wolfe, A. M., Cooke, J., Chen, H.-W., Armandroff, T. E., & Wirth, G. D. 2009, ArXiv:0908.0343
- Robertson et al. (2006) Robertson, B., Bullock, J. S., Cox, T. J., Di Matteo, T., Hernquist, L., Springel, V., & Yoshida, N. 2006, ApJ, 645, 986
- Robertson et al. (2004) Robertson, B., Yoshida, N., Springel, V., & Hernquist, L. 2004, ApJ, 606, 32
- Robertson & Kravtsov (2008) Robertson, B. E. & Kravtsov, A. V. 2008, ApJ, 680, 1083
- Roychowdhury et al. (2009) Roychowdhury, S., Chengalur, J. N., Begum, A., & Karachentsev, I. D. 2009, MNRAS, 397, 1435
- Rudd et al. (2008) Rudd, D. H., Zentner, A. R., & Kravtsov, A. V. 2008, ApJ, 672, 19
- Schaye (2004) Schaye, J. 2004, ApJ, 609, 667
- Schaye & Dalla Vecchia (2008) Schaye, J. & Dalla Vecchia, C. 2008, MNRAS, 383, 1210
- Schmidt (1959) Schmidt, M. 1959, ApJ, 129, 243
- Springel et al. (2006) Springel, V., Frenk, C. S., & White, S. D. M. 2006, Nature, 440, 1137
- Springel & Hernquist (2003) Springel, V. & Hernquist, L. 2003, MNRAS, 339, 312
- Springel & Hernquist (2005) —. 2005, ApJ, 622, L9
- Stahler & Palla (2005) Stahler, S. W. & Palla, F. 2005, The Formation of Stars
- Steinmetz & Navarro (2002) Steinmetz, M. & Navarro, J. F. 2002, New Astronomy, 7, 155
- Tasker & Bryan (2008) Tasker, E. J. & Bryan, G. L. 2008, ApJ, 673, 810
- Tasker & Tan (2009) Tasker, E. J. & Tan, J. C. 2009, ApJ, 700, 358
- Tassis (2007) Tassis, K. 2007, MNRAS, 382, 1317
- Tegmark et al. (2006) Tegmark, M., Eisenstein, D. J., Strauss, M. A., & et al. 2006, Phys. Rev. D, 74, 123507
- Wada et al. (2002) Wada, K., Meurer, G., & Norman, C. A. 2002, ApJ, 577, 197
- Wada & Norman (2001) Wada, K. & Norman, C. A. 2001, ApJ, 547, 172
- Wada & Norman (2007) —. 2007, ApJ, 660, 276
- Wetzel & White (2009) Wetzel, A. R. & White, M. 2009, MNRAS submitted (arxiv/0907.0702)
- White & Rees (1978) White, S. D. M. & Rees, M. J. 1978, MNRAS, 183, 341
- Wild et al. (2007) Wild, V., Hewett, P. C., & Pettini, M. 2007, MNRAS, 374, 292
- Wolfe & Chen (2006) Wolfe, A. M. & Chen, H.-W. 2006, ApJ, 652, 981
- Wolfe et al. (2004) Wolfe, A. M., Howk, J. C., Gawiser, E., Prochaska, J. X., & Lopez, S. 2004, ApJ, 615, 625
- Wolfe et al. (2008) Wolfe, A. M., Prochaska, J. X., Jorgenson, R. A., & Rafelski, M. 2008, ApJ, 681, 881
- Wolfire et al. (2003) Wolfire, M. G., McKee, C. F., Hollenbach, D., & Tielens, A. G. G. M. 2003, ApJ, 587, 278
- Wong & Blitz (2002a) Wong, T. & Blitz, L. 2002a, ApJ, 569, 157
- Wong & Blitz (2002b) —. 2002b, ApJ, 569, 157