The unusual N iv]-emitter galaxy GDS J033218.92-275302.7:
star formation or AGN-driven winds from a massive galaxy at z=5.56
Abstract
Aims. We investigate the nature of the source GDS J033218.92-275302.7 at redshift 5.56.
Methods. The spectral energy distribution of the source is well-sampled by 16 bands photometry from UV-optical (HST and VLT), near infrared, near infrared (VLT) to mid-infrared (Spitzer). The detection of a signal in the mid-infrared Spitzer/IRAC bands 5.8, 8.0 – where the nebular emission contribution is less effective – suggests that there is a Balmer break, the signature of an underlying stellar population formed at earlier epochs. The high-quality VLT/FORS2 spectrum shows a clear Ly emission line, together with semi-forbidden N iv] 1483.3-1486.5 also in emission. These lines imply a young stellar population. In particular, the N iv] 1483.3-1486.5 feature (if the source is not hosting an AGN) is a signature of massive and hot stars with an associated nebular emission. Conversely, it may be a signature of an AGN. The observed SED and the Ly emission line profile were modeled carefully to investigate the internal properties of the source.
Results. From the SED-fitting with a single and a double stellar population and from the Ly modeling, it turns out that the source seems to have an evolved component with a stellar mass of 51010 and age 0.4 Gyrs, and a young component with an age of 0.01 Gyrs and star formation rate in the range of 30-200 . The limits on the effective radius derived from the ACS/z850 and VLT/Ks bands indicate that this galaxy is denser than the local ones with similar mass. A relatively high nebular gas column density is favored from the Ly line modeling (). A vigorous outflow ( 450 km/s) has been measured from the optical spectrum, consistent with the Ly modeling. From ACS observations it turns out that the region emitting Ly photons is spatially compact and has a similar effective radius ( 0.1 kpc physical) estimated at the 1400Å rest-frame wavelength, whose emission is dominated by the stellar continuum and/or AGN. The gas is blown out from the central region, but, given the mass of the galaxy, it is uncertain whether it will pollute the IGM to large distances.
We argue that a burst of star formation in a dense gas environment is active (possibly containing hot and massive stars and/or a low luminosity AGN), superimposed on an already formed fraction of stellar mass.
Key Words.:
galaxies: formation — galaxies: evolution — source GDS J033218.92-275302.71 Introduction
In the past few years, dedicated space-borne and ground-based observatories and refined techniques have allowed us to discover and analyze galaxies at increasingly large distances. It is common practice in observational cosmology to select efficiently star-forming galaxies (e.g. Lyman break galaxies, LBGs, or Lyman alpha emitters, LAEs) and active galactic nuclei (AGN) up to redshift 6.5 (e.g. Steidel et al., 1999; Dickinson et al., 2004; Giavalisco et al., 2004a; Bouwens et al., 2006; Taniguchi et al., 2005; Ando et al., 2006; Cristiani et al., 2004; Fan et al., 2003; Fontanot et al., 2007) or spheroidal/fossil massive galaxies up to redshift 4, whose apparent morphology has recently introduced a sub class of objects (e.g. Daddi et al., 2005; Cimatti et al., 2008; van Dokkum et al., 2008; Buitrago et al., 2008).
High-redshift galaxies have been studied through deep multi-wavelength surveys, with the aim of maximizing the information on the energetic output of the sources spanning a wide range of the electromagnetic spectrum from X-ray to radio wavelengths. This approach has shown its efficiency of constraining luminosity functions up to redshift 6-7 and down to few percent of (e.g. Bouwens et al. (2007, 2008)), stellar mass functions (for masses higher than ) up to redshift 6 (Fontana et al., 2006, 2009; Eyles et al., 2005, 2007; Stark et al., 2007, 2009; Yan et al., 2005; Labbé et al., 2006) and morphology evolution (Taniguchi et al., 2009; Conselice et al., 2008; Ferguson et al., 2004).
Detailed studies of internal the properties of high-redshift galaxies, such as information about hot stars, dust, ionized gas in regions, and the large-scale outflows of neutral and ionized interstellar material (ISM) are now becoming feasible up to redshift 4-5 (e.g. Shapley et al., 2003; Ando et al., 2007; Ouchi et al., 2008; Vanzella et al., 2009). Useful information from the Ly profile modeling of high-redshift galaxies with radiative transfer codes is producing interesting constraints on the dynamical and physical state of the ISM and ionizing sources (e.g. Verhamme et al. (2008); Schaerer & Verhamme (2008)).
From this point of view, thanks to the combination of depth, area, and multivawelength coverage, the Great Observatories Origins Deep Survey project (see Dickinson et al. (2003b); Giavalisco et al. (2004b) for a review about this project) is ideal for studing galaxies at high redshift and the connection between photometric, spectroscopic, and morphological - size properties (e.g. Pentericci et al., 2007, 2009; Conselice et al., 2008; Ravindranath et al., 2006; Vanzella et al., 2009), and their relation with the environment (e.g. Elbaz et al., 2007).
Along with enabling a systematic study of normal galaxies, multi-frequency surveys over large areas and depth also allow us to discover rare objects. In particular, a new class of objects showing prominent N iv] 1486 emission have recently been reported. Such a feature is rarely seen at any redshift. A small fraction (1.1%, 1.7z4) of the QSO sample extracted from the SDSS fifth data release is nitrogen rich, showing N iv] 1486 or N iii] 1750 emission lines and N v] 1240 also in emission (typically stronger than the rest of the population (Jiang et al., 2008). Similarly, Glikman et al. (2007) discuss the discovery of two low-luminosity quasars at redshift 4 with Ly and C iv lines, moderately broad N iv] 1486 emission, and an absent N v] 1240 line. In these particular cases, the blinding intensity of the central engine is reduced, allowing study of the properties of the host galaxy. Fosbury et al. (2003) report on an lensed galaxy at redshift 3.357 (the ) whose spectrum shows N iv] 1486, O iii] 1661, 1666, C iii] 1907, 1909, as well as the absence of the N v] 1240 line. Their modeling of the spectrum favors a hot (T80000K) blackbody over an AGN as the ionizing source. Alternatively, Binette et al. (2003) suggest an obsured AGN as a photoionizing source of the Lynx arc. Villar-Martin et al. (2004) propose a population of Wolf-Rayet (WR) stars as the ionization source for the same galaxy, with an age below 5 Myr that contributes to a fast enrichment of the interstellar medium. In this scenario the stars involved are much colder than those proposed in Fosbury et al. (2003).
In the present work we report on the source GDS J033218.92-275302.7 at redshift 5.563 located within the GOODS southern field, for which extensive information (photometry, spectroscopy and morphology) is available. The galaxy has been discovered during the ESO/FORS2 spectroscopic survey (Vanzella et al. (2006)). We focus our attention on this source because it shows several unique characteristics. First the high S/N spectrum exibits a relatively bright N iv] 1486 feature in emission, a unique example among the more than 100 spectra of high z starburst galaxies that were obtained from the GOODS/FORS2 campaign (Vanzella et al. (2008)). Second, while the spectrum shows a bright Ly line indicating a young stellar component, the photometry shows a prominent Balmer break indicating that there is also an evolved component. Finally, the bright IRAC flux suggests that this is a massive galaxy, especially interesting if one considers its very high redshift.
Indeed the object was already noted by several authors; for example, Fontanot et al. (2007) selected it as an AGN candidate on the basis of morphological and color considerations, but discarded it from the sample because of its peculiar optical spectrum. Wiklind et al. (2008) report it among the 11 candidates with photometric redshifts in the range 4.9z6.5, dominated by an old stellar population, with ages 0.2-1.0 Gyr and having very high stellar masses, in the range . Also Stark et al. (2007) report for this source a stellar mass highr than . Similarly Pentericci et al. (2009) note that this is one of a handful of bright Ly emitting LBGs at high redshift with an evolved population, indicating that not all Lyman alpha emitters are young primeval galaxies.
As noted recently by Schaerer & de Barros (2009) and Raiter et al. (2009), strong nebular emission lines may bias the result of the SED-fitting of high-redshift galaxies (e.g. [O iii] 4959-5007, H). Indeed the apparent photometric breaks might actually be produced in some cases by the boost of some of the lines. Something similar may be happening in this case, therefore it is important to quantify the strength of these lines and their influence on global photometry.
In the present work we perform dedicated SED-fitting allowing single and multiple stellar populations, and important information is extracted from the Ly profile modeling. Together with the morphological appearance, constraints have been placed on the stellar mass density, ages, gas, dust content, and outflows.
The work is structured as follow. In Section 2 a summary of the photometric, spectroscopic, and morphological properties is given, and in Sect. 3 the possible scenarios are discussed about the nature of the source. Section 4 describes the SED and Ly modeling, and in Sect. 5 we discuss the results. Section 6 concludes the work. In the following the standard cosmology is adopted (=70 km/s/Mpc, =0.3,=0.7). If not specified, magnitudes are given on the AB system.
2 Source GDS J033218.92-275302.7
Source GDS J033218.92-275302.7 is located within the southern field of the Great Observatories Origins Deep Survey. The multi-wavelength observations consists of deep U, R (VLT), , , and (HST), , , (VLT), 3.6, 4.5, 5.8, 8.0, and 24 (Spitzer) bands. Moreover observations in the X-ray and radio domains are available from Chandra and the Very Large Array, respectively (Luo et al., 2008; Miller et al., 2008).
A considerable part of the spectroscopic information of that field has been collected by the VLT/FORS2 spectrograph, which has produced about one thousand redshift determinations (with a resolution of 13Å, at 8600Å), between redshift 0.5 and 6.2, in particular more than one hundred LBGs have been confirmed at redshift beyond 3.5 (Vanzella et al., 2005, 2006, 2008). The VLT/FORS2 spectroscopic survey has been complemented in the redshift interval 1.6 3.5 and at 1 by the VLT/VIMOS spectroscopic survey, which is producing more than 5000 spectroscopic identifications (Popesso et al., 2008; Balestra et al., 2010). Such measurements increase the spectroscopic information available from previous works (e.g. VVDS Le Fèvre et al., 2005; Szokoly et al., 2004).
Source GDS J033218.92-275302.7 with =24.610.03 was selected as a –band dropout and was confirmed to be at redshift 5.563 (redshift of the Ly line, Vanzella et al. (2006)).
2.1 UV spectral properties

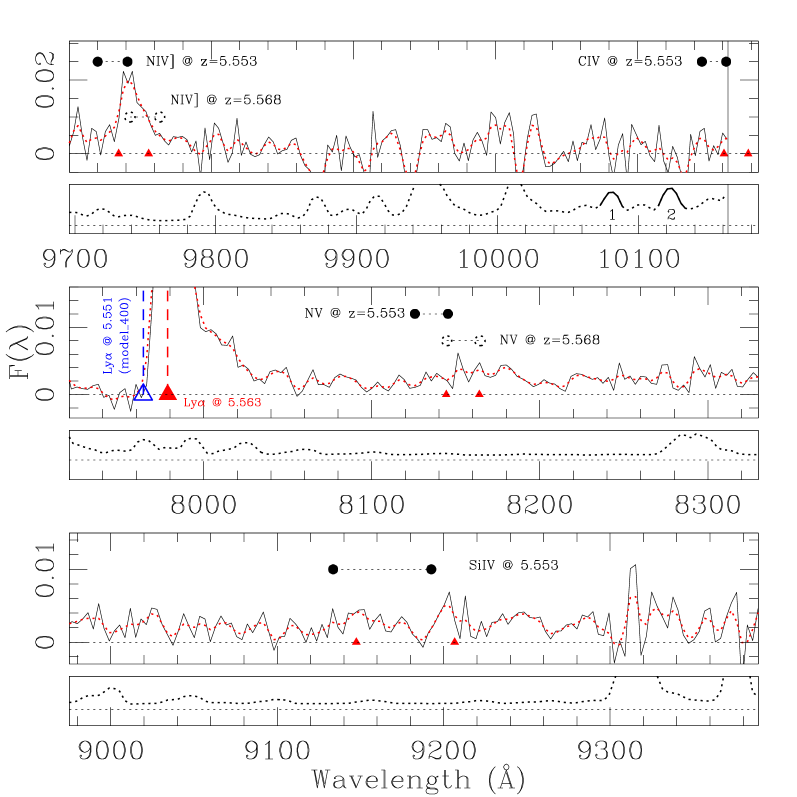
The main spectral features are the Ly emission line (EW60Å rest frame), the break of the continuum blueward of the line, and the semi-forbidden emission line N iv] 1486, a doublet 1483.3-1486.5Å (see Fig. 1 and Table 1 for a physical quantities summary). The detection of the N iv] 1486 in emission is unusual for LBGs. However, this atomic transition has been identified by Fosbury et al. (2003) in the arc and in a sub class of QSOs (e.g., Glikman et al. (2007), Baldwin et al. (2003)). In the following the main properties of the UV spectrum are described:
| Obs. Spect. properties | |
|---|---|
| z ( Ly 1215.7) | 5.563 |
| FWHM ( Ly 1215.7) | 600100 |
| ( Ly ) | 59Å (89Å from phot.⋆) |
| L( Ly ) | 3.81043 |
| ( Ly ) | 31 |
| z (N iv] 1486) | 5.553 (1486.5Å) |
| FWHM (N iv] 1486) | 400100 |
| (N iv] 1486) | Å (33Å from phot.⋆) |
| L(N iv] 1486) | 1043) |
| L(N v 1240-1243) | 1.060.57 1042 |
| L(Si iv 1393.8-1402.8) | 1.130.731042 |
| L(C iv] 1548.2-1550.8) | 61042 (2 limit) |
| V(Ly - N iv] 1486) | +45750 |
| Morph. (rest-frame) | (kpc physical) |
| (GALFIT) | 0.080.01 kpc (ACS band) |
| (GALFIT) | 0.110.01 kpc (ACS band) |
| 0.9 kpc (0.6” seeing, ISAAC band) | |
| (SExtr.) | 0.83 (S/G, ACS band) |
| (SExtr.) | 8.8 kpc2 (AREAF 303 pix., band) |
| continuum not detected, 2 of the noise fluctuations is adopted. | |
| adopting the continuum derived from the ACS band. | |
-
1.
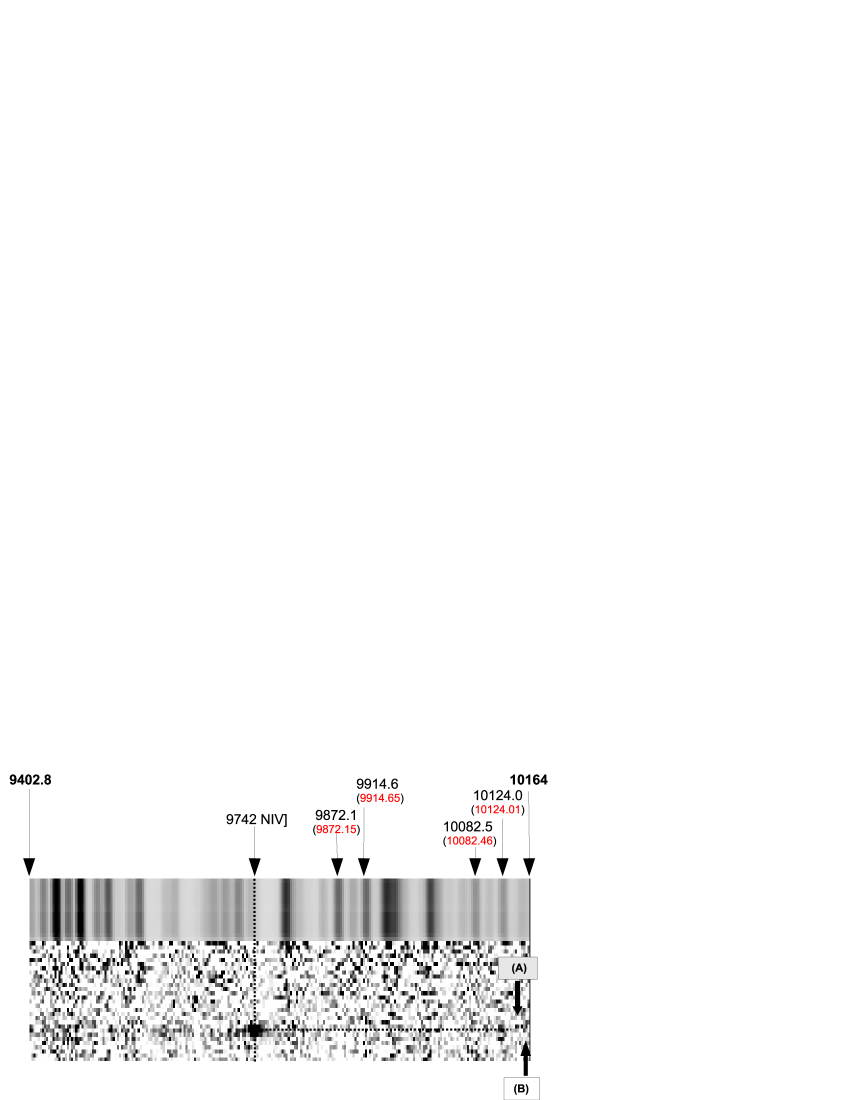
As shown in the top panel of Fig. 2 an emission line at 9742Å is detected. The spectral resolution is in principle sufficient to resolve the double profile of the two N iv] 1486 components, i.e 1483.3Å and 1486.5Å. We interpret this feature as the detection of one of the two components. A first possibility is that this line is the 1483.3Å component: in this case the redshift turns out to be higher than the observed Ly redshift. The Ly emission from LBGs is commonly observed to be redshifted relative to the systemic velocity traced by other, non-resonant emission lines or stellar absorption lines (Shapley et al. (2003), Tapken et al. (2007), Verhamme et al. (2008), Vanzella et al. (2009)). Therefore, it would be unusual if, in this object, the N iv] redshift were higher than that from Ly . The other possibility is that we are detecting the 1486.5Å component at redshift 5.553, suggesting a high-density limit111the ratio of those components is related to the electron density, Raiter et al. (2009), Keenan et al. (1995) and a velocity offset (i.e. a presence of an outflow) between Ly and N iv] lines of +457 km/s (dz=0.01). A further proof of this possibility is that the redshift and outflow estimated from the spectrum are consistent with the results from the Ly profile modeling discussed below (see Sect. 4.2). Therefore, in the following we assume the line to be the 1486.5Å component.
- 2.
-
3.
From the 2-dimensional spectrum, the FWHM of the spatial profiles of the Ly and the continuum (by collapsing columns along the Y-axis, see Fig. 3) are fully comparable, 0.7 arcsec. This is also compatible with the seeing during observations, 0.7 arcsec. More interestingly, a better constraint on the Ly extension comes from the ACS band. As shown in Fig. 1, the band is mainly probing the UV emission region between the Ly line and 1300Å (less than 100Å rest-frame), and the part blueward of the Ly line is strongly attenuated by the IGM absorption. Since the Ly equivalent width is 60Å, it turns out that the ACS image is dominated by the Ly emission. In Sect. 2.3 we show that the morphological properties derived from the band (probing the Ly line) and the band (not containing the Ly line and probing the emission at 1400Å) are similar, e.g. the effective radii of the two are the same order. This implies that the spatial extension of the Ly line is similar to the emitting region at 1400Å rest-frame.
Figure 3 shows the contour plots of the 2-dimensional Ly region. Various sigmas above the noise fluctuation are reported from 1 to 20. It is evident that the asymmetric shape in the wavelength domain (that extends at least 40Å (3)). If the Ly emission arises from a simple expanding shell of material, then it is expected to have less of velocity width at its outer extremes than along the line of sight to the central region, where the transverse velocity component tends to zero.

2.2 Photometric properties
Fig. 5 shows the overall SED (black squares) and Table 2 summarizes the multi-band photometry of the source collected from different instruments mounted on ground and space-based telescopes. Magnitudes, errors and 1- lower limits (l.m.) are derived from the MUSIC catalog, (Grazian et al., 2006; Santini et al., 2009). There are other two WFI U bands observations not reported in the table, U35 and U38, with a slightly different filter shape. Their lower limits are 27.84 and 26.75, respectively, much shallower than the limit provided by the VLT .
Despite the high redshift of the source discussed here, its (-) color is 0.59, significantly bluer than the typical threshold of 1.3 adopted to select galaxies beyond redshift 5.5 (e.g. Dickinson et al., 2004; Bouwens et al., 2007). This comes from the contribution of the Ly emission to the flux in the filter (see Fig. 1), that decreases the (-) color by about 0.7 magnitudes (as shown in Vanzella et al. (2009)). For this reason it has been selected as a –band dropout source. It is also an R–band dropout source if referred to the ground-based photometry, see Table 2.
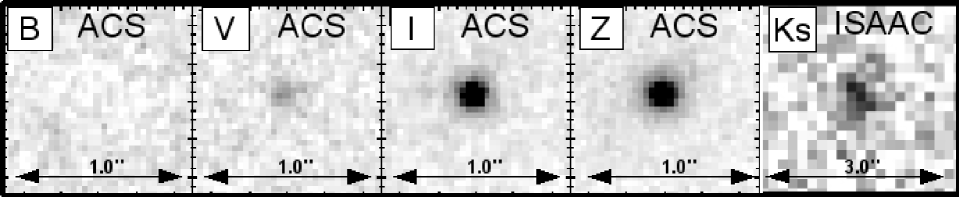
As shown in Fig. 4, the source has been detected in the band with a magnitude of 27.630.22, showing an attenuation of 94% to respect the 1400Å emission ( band), which is consistent with the average IGM transmission at this redshift (e.g. Songaila, 2004).
Apart from the IGM attenuation that influences the bands bluer than the , the main feature of the SED is the discontinuity detected between VLT/ISAAC , , and bands ( rest-frame) and the Spitzer/IRAC channels ( rest-frame), see Fig. 5. Such a discontinuity is consistent with estimates available in the literature for the same object (FIREWORKS, Wuyts et al. (2008), Stark et al. (2007), Wiklind et al. (2008), Raiter et al. (2009)).
The typical uncertainties (1) span the range 0.03 to 0.11 going from the HST/ACS, VLT/ISAAC and Spitzer channels 1 and 2, for the last two Spitzer bands (5.6 and 8 ) the errors increase to 0.2/0.3 mags.


| R | Js | H | Ks | 3.6 | 4.5 | 5.8 | 8.0 | 24 | |||||
| 29.49 | 29.86 | 27.86 | 27.11 | 25.22 | 24.61 | 24.68 | 24.80 | 24.21 | 22.82 | 23.00 | 23.37 | 23.18 | 22.61 |
| 1 l.m | 1 l.m | 0.179 | 0.195 | 0.039 | 0.031 | 0.116 | 0.151 | 0.140 | 0.014 | 0.024 | 0.235 | 0.198 | 1 l.m. |
| Other two WFI U bands are available, U35 and U38 with slightly different filter shape. The lower limits are 27.84 and 26.75, respectively, | |||||||||||||
| much shallower than the limit provided by the . | |||||||||||||
2.3 Morphological properties
Image cutouts of the isolated source GDS J033218.92-275302.7 in the , , , (HST/ACS), and (VLT/ISAAC) bands are shown in Fig. 4, where each box is 1.0 arcsec wide for the ACS figures (6 kpc proper at the redshift of the source), while it is 3 arcsec on a side for the ISAAC image. We considered the ACS/ and the ISAAC/Ks bands to derive basic morphological quantities (see Table 1).

-
•
band ( 1400Å)
The uncorrected-PSF effective radius () available from the ACS/GOODS public catalog v2.0 is 3.37 pixels. The same quantity derived from a sample of 80 stellar-like sources (SExtractor star/galaxy index larger than 0.97, 1.0=star, 0.0=extended source) with magnitude in the range 23.5-25 gives a median value and 1 percentiles of , implying that this source is not a stellar-like object (see Fig. 6). The same result is obtained for the band (6 from the median value of the stars). We note that the SExtractor star/galaxy index of the source is quite high, 0.83, but lower than the typical value of the stars. Therefore, even though the present galaxy is clearly a compact source in the UV rest-frame, it is marginally resolved both in the and bands.
To derive PSF-corrected morphological parameters, we ran the GALFIT program (Peng et al. (2002)) in both bands. The morphological shape of the source is not particularly complicated so a good fit is reached (reduced = 0.591) by adopting a simple Gaussian profile (Sèrsic model with =0.5) and leaving the , the axis ratio , the coordinates , the magnitude, and the position angle as free parameters (SExtractor estimates were used as a first guesses). In the left panel of Fig. 7 the band image of the galaxy is shown, and the residuals map provided by GALFIT, as a result of the subtraction of the best-fit model from the original galaxy, do not show significant structures (middle panel of the same figure). An effective radius =0.620.05 pixels (0.110.01 kpc physical) and =0.610.14 have been obtained. We explored how the variation in affects the residuals fixing n=0.5 and B/A=0.61. GALFIT was run 80 times by varying the from 0.025 to 2.0 pixels with a step of 0.025. Its behavior is shown in the right panel of Fig. 7 where the minimum of the residuals for 0.650 is clear, still with acceptable values between 0.3-1.0 (pixels). It is worth noting that, if we perform the same fit in the band, the best is slightly smaller than the band (0.425 pixels, i.e. 0.013 arcsec or 0.080.01 kpc physical), implying an even more compact region for the Ly emission.

Figure 7: The ACS image of the source (left, 100100 pixels) and the residual image after subtraction of the model derived from GALFIT (middle). In the right panel the behavior of the residuals (standard deviation calculated on a 2020 pixels area centered on the source) as a function of the (fixed during GALFIT runs) is shown. The minimum value corresponds to 0.65 pixels, i.e. 0.02 arcsec or 0.12 kpc proper. The dotted line indicates the median value of the background residuals (standard deviation calculated in the blank regions). -
•
band ( 3300Å).
To approach the optical rest-frame wavelengths, we exploit the information derived from the near infrared (NIR hereafter) observations (VLT/ISAAC Ks band). The resolution from the ground is not comparable to that obtained from the space; however, we note that the present object has an FWHM fully consistent with the seeing at the epoch of observations of that particular region of the GOODS field (0.50 arcsec), i.e., it is not resolved. Assuming a Gaussian shape with an FWHM of 0.50 arcsec, it turns out that the is 0.9 kpc physical. For the Gaussian profile the =(FWHM/2)/1.738, i.e. the radius containing half of the total light. Since the source is not resolved, the derived is an upper limit at this wavelength.
There are three other sources (with secure redshift, quality “A”) in the FORS2 sample that show a similar UV morphology of the source discussed here (with a SExtractor smaller than 3.5 pixels (0.105 arcsec)). One is the QSO GDS J033229.29-275619.5 (Fontanot et al. (2007)) fully compatible the stellar PSF and two other LBGs: GDS J033217.22-274754.4 at redshift 3.652 already described in Vanzella et al. (2008) with a double structure of the Ly profile and GDS J033240.38-274431.0 at redshift 4.120, which shows a continuum with clear Ly emission and no other features.
3 Possible scenarios for GDS J033218.92-275302.7
3.1 A chance superposition ?
If we interpret the emission line detected at =9742Å as a [O ii] 3727 foreground emitter superimposed on a background and brighter higher-z (z=5.563) LBG, its redshift would be 1.614. It is well known that in the GOODS-S field there is an overdensity structure at that redshift, z=1.61 (e.g. Vanzella et al., 2008; Castellano et al., 2007; Kurk et al., 2009). However we can exclude this possibility on the basis of the ACS morphology, shows a compact and circular shape (see Fig. 4) and from the ultradeep U band observations carried out by the VLT/VIMOS instrument (Nonino et al. (2009)), provide an upper limit of 30 AB at 1 (also it has not been detected in the ACS band image). The source should be detectable in the blue if there is star formation activity traced by the [O ii] 3727 line. Moreover, assuming a flat continuum at that 1 limit (30 AB), the rest-frame [O ii] 3727 equivalent width would be larger than 104Å. Even though we consider this possibility largely unlikely, we note that an example of strong [O ii] 3727 emitter has been reported by Stern et al. (2000).
3.2 Is it an AGN ?
The spectral range up to 10164Å allows us to detect possible emission lines testing for the presence of an AGN (e.g. N v] 1240-1243, SiIV 1393.8-1402.8, and C iv] 1548.2-1550.8). Those features are routinely detected in spectra of the most obscured AGNs (e.g. Polletta et al., 2006, 2008).
3.2.1 Line emission in the UV
-
•
N v 1240-1243 feature.
Observationally, the N v emission is often present in the AGN case. The FORS2 spectrum allow us to measure emission features down to 2. No N v line is detected (see Fig. 2).
-
•
C iv 1548.2-1550.8 feature.
Unfortunately, the C iv line is at the very red limit of the observed spectrum, which in this particular slit position is determined by the detector end. Figures 8 and 2 (top panel) show the 2-dimensional and the 1-dimensional spectra zoomed at the red edge, respectively. On one hand, if the redshift of the C iv feature is higher than 5.565 (z(C iv)5.565, higher than the Ly redshift), then the doublet is completely out. Alternatively, if z(C iv)5.554, then the doublet is completely in. In general, LBGs show the observed Ly redshift as higher than the other spectral features because of its asymmetry which typically arises from backscattering of the receding material (e.g. Shapley et al., 2003; Vanzella et al., 2009). Similarly, in the AGN case, a blueshift of the C iv feature with respect to the observed Ly peak is typically observed, of several hundred kilometers per second. In particular a blueshift of 600100 with respect to the Ly line is measured in the SDSS QSO composite spectrum (e.g. see Table 4 and Figure 9 of Vanden Berk et al. (2001)). If this is the case, the C iv feature should fall in the available spectrum, and its luminosity limit is 6 at 2 of the background noise fluctuation.
The limits and luminosities estimates on Ly , N v, Si iv, and C iv are reported in Table 1.
3.2.2 X-ray emission
We further note that this source has not been detected in the X-ray by the 2 Ms Chandra ultra-deep observations, neither in the MIPS 24m by Spitzer (with 1 lower limit of 22.61 AB) nor by the VLA at 20 cm down to 8 (at 1, Tozzi et al. (2009)).
A correlation between 2-10 keV X-ray luminosity and [O iii] 5007 or H emission line luminosities is observed for galaxies at (e.g., Panessa et al. (2006), Silverman et al. (2008)). Assuming that this correlation also holds at higher redshifts, then we may use the X-ray luminosity to derive a constraint on the fluxes for AGN-powered emission lines in the IRAC bands.
From the current 2 Ms observations, there is no detection at the position of the source (3 limit of 3 erg/s at 3-13 keV rest-frame, Luo et al. (2008)). This limit roughly corresponds to an upper limit for both H and [O iii] 5007 luminosities of and , respectively. Such values are affected by large uncertainties in the assumed relations (intrinsic scatter) and the limit derived from the 2 Ms image. However, if compared to the (at least) one magnitude jump between the VLT/ISAAC and Spitzer/IRAC magnitudes, these estimations suggest that, besides a line contribution to the IRAC magnitudes, there is also a significant contribution from stellar emission beyond 5000Å rest-frame, i.e., of a relatively evolved stellar population (see Sect. 4). For example a line luminosity of 7 is needed to boost the 4.5 AB magnitude from 24 to 23 (adopting a bandwidth of 10100Å, Fazio et al. (2004)).
3.2.3 A rare class of QSOs: an open possibility
It is interesting to compare our N iv] 1486 emitter spectrum with the composite spectra of quasars available in the literature. This has already been done by several authors (e.g. Baldwin et al. (2003), Glikman et al. (2007), and Jiang et al. (2008)). None of the published average quasar spectral templates show any trace of N iv] 1486 emission. Nevertheless, focusing the attention on this spectral feature, Bentz et al. (2004) compile a sample of 6650 quasars in the range 1.6z4.1 showing the N iv] 1486 line (other than the N iii] 1750), and more recently an updated work by Jiang et al. (2008) (on SDSS data release 5) reported that such objects are 1.1% of the total SDSS quasar sample. They also note that for this small fraction, the N v 1240 and Ly are much stronger than the rest of the population. We recall that our source does not show the N v 1240 line.
More interestingly and similar to our findings, Glikman et al. (2007) have discovered two low luminosity QSOs at redshift 4 showing Ly , N iv] 1486 and C iv 1548-1550 emissions, but no detection of N v 1240. In one case the equivalent width of the N iv] 1486 is larger than the C iv one (240Å vs. 91Å), while it is the opposite for the other (24Å vs. 91Å). Our source has a luminosity of =-22.1 (AB) and shows a clear N iv] 1486 emission with an equivalent width of 22Å and FWHM 400 . The Ly line shows a narrow component with a measured FWHM of 600 . As performed in Glikman et al. (2007), since the blue side of the line profile is absorbed, we forced the symmetry in the line by mirroring the red side of the line profile over the peak wavelength and computed the Gaussian fit. The narrow-line component increases to 750 . The broad-line feature (indicated with a segment in the innner box of Fig. 1) gives an FWHM of 3500 . This would put the source in the QSO regime (velocity width larger than 1000 ). Therefore, the present source may be consistent with the interpretation of a low-luminosity quasar in which the host starburst galaxy is visible (similarly to Glikman et al. (2007)).
The study of stellar populations of low-luminosity AGNs (e.g. low-luminosity Seyfert galaxies, low-ionization nuclear emission line regions, LINERs, and transition-type objects, TOs) has been addressed for the local Universe (e.g., González Delgado et al. (2004)), but this is still a poorly explored regime at higher redshift. While it is beyond the scope of the present work to explore the link between the coevolution of (circumnuclear) starburst activity and the central black hole accretion, we simply note that both AGN and star-formation required gas to fuel them, and it happens on different temporal and spatial scales, on sub-parsec and typically above few hundred parsecs (up to several kilo-parsecs) regions, respectively (e.g., Davies et al. (2007), Chen et al. (2009)). In the present case, the size of the UV emitting region is compact, but still resolved in the ACS image (as shown in Sect. 2). In summary, the presence of an AGN – in a rare evolutionary stage – may be indicated by the N iv] 1486 and broad Ly features, even though N v 1240, Si iv 1394-1493, and (possibly) C iv 1548-1550 are not detected.
3.3 A multi-burst galaxy in a peculiar stage of evolution ?
The source GDS J033218.92-275302.7 has already been analyzed in Wiklind et al. (2008), who classify it as a “pure” balmer break galaxy (their ID ). The discontinuity detected between the and 3.6 bands is interpreted as a signature of the Balmer break, suggesting a relatively evolved age of stellar populations with a significant stellar mass already in place (age of 0.7Gyr and 7-8). A similar conclusion has been reached by Stark et al. (2007), who find an even higher stellar mass of (their ID 328020).
However, most probably the observed (-3.6) color is contaminated by emission lines in the 3.6 band, e.g. [O iii] 4959-5007. A similar boost to the flux in the 4.5 band may come from the H emission line. It was also selected as H emitter by R. Chary et al., private communication. Apart from the evident Ly emission, which implies the presence of young ( 10 Myr) stars – i.e., some “current”/ongoing star formation – significant nebular emission is also robustly supported by the detection of the N iv] 1486 line. As mentioned above, a similar feature has been identified in the arc and may indicate a short powerful starburst in which very hot and massive stars (T80000 K, Fosbury et al. (2003)) or cooler Wolf-Rayet stars are involved (Villar-Martin et al. (2004)). A similar blackbody ionizing source may be present in this source. The ongoing star formation activity would also be responsible for the measured outflow, whose spectral signature is in the red tail of the Ly profile (see Ly modeling in Sect. 4.2). It is beyond the scope of the present work to model the ionizing source; nevertheless, we note that in a “pure” nebular scenario, the continuum is practically flat, and the observed “breaks” are produced by strong nebular emission lines (see Raiter et al. (2009) for a dedicated discussion). Alternatively, a different interpretation suggests a contribution from a relatively evolved stellar population that produces the Balmer break signature (see next section). Given the current spectroscopic and photometric information, the following scenario may be possible: 1) ongoing active star formation in an -like region that produces nebular emission, as probed by the Ly and N iv] 1486 features, and 2) an already evolved population of stars formed at higher redshift, as probed by the signal detected in the IRAC bands, in particular, redwards of the 4.5 (beyond 7000Å rest-frame).
4 SED and Ly modeling
We cannot definitively distinguish between the two scenarios described above, in particular for the explanation of the N iv] 1486 feature. In either case, even though the source reflects an early stage of coevolution of the (circumnuclear starburst) galaxy with its AGN or it is an source, the features of the host galaxy are detected and can be investigated. We therefore need to model the SED allowing for multiple stellar populations. Moreover, valuable information can be derived from the Ly line modeling. This is performed in the following sections.
4.1 Modeling the SED
The SED modeling was performed adopting the multiwavelength GOODS-MUSIC photometric catalog (Grazian et al. (2006)), and the spectral fitting technique was developed in Fontana et al. (2003, 2006) (similar to those adopted in other works, e.g., Dickinson et al. (2003); Drory et al. (2004)). In the previous section we pointed out that this galaxy likely contains a mixed stellar population, both young stars, as implied by a bright Ly line, the N iv] 1486 line, and old stars that produce the 4000Å break, clearly observed in broad band photometry. We therefore model the SED of the galaxy both with a single stellar population and with a more plausible double stellar population. More complicated mixes of multiple stellar populations becomes unconstrained by the data given the many degrees of freedom of each population. We actually reduce the number of degree of freedom by imposing the requirement that both populations (old and young) are affected by the same dust extinction (with a Calzetti or a Small Magellanic Cloud extinction curve). Although this might not be true, we feel that it is plausible for very compact objects such as the one we are studying. We fix the rest-frame equivalent width of the Ly line to be EW=60Å, as measured from the spectrum and regardless of the star formation rate.
As discussed in the previous section, the contribution of nebular lines to the photometry may affect the IRAC magnitudes of the 3.6 and 4.5 bands. In particular, the [O iii] emission contributes to the 3.6 channel and the H line to the 4.5 channel. While the H line can be modeled relatively easily and its luminosity can be assumed to be proportional to the global SFR through the well-known Kennicutt relations, disentangling the [O iii] contribution is harder. Moustakas et al. (2006) investigated the [O iii] nebular emission line as a quantitative SFR diagnostic and conclude that the large dispersion in the [O iii]/H ratio among star-forming galaxies precluded its suitability for SFR studies.
We therefore treat the [O iii] contribution in three different ways: 1) by assuming a mean [O iii] flux as inferred in local star-burst galaxies (corresponding to a ratio f([O iii])/f([O ii])=0.32), 2) by assuming a maximum [O iii] flux in the 3.6 band 10 times larger than in the previous case, corresponding to the maximum observed [O iii]/H in star-burst galaxies, and 3) by neglecting the 3.6 band in the fit.
In the SED-fitting computation, the formal errors of the observed magnitudes have a minimum value permitted for each band. This was done to avoid over-fitting in the minimization procedure, and it affects only the 3.6 and 4.5 bands, whose errors are increased to 0.1 (the minimum permitted) during the fit.
The results of the various fits are reported in Table 3: for each model, we report the best-fit () total stellar mass, age, (the star formation e-folding timescale), current SFR, and (indicated with ) for the single and double populations, as well as the minimum and maximum values allowed by the fit (at 1). For the double stellar populations the best-fit ages of the young and the evolved components are reported (in the last two columns).
| MODEL | |||||||||||
| Gyrs | Gyrs | ||||||||||
| Single / [O iii] ave | 5.2 | 6.8 | 9.1 | 22 | 29 | 30 | 0.00 | 0.00 | 0.00 | 0.71 | 0.3 |
| Single / [O iii] max | 5.2 | 6.8 | 9.1 | 22 | 29 | 30 | 0.00 | 0.00 | 0.00 | 0.71 | 0.3 |
| Single / no 3.6 | 3.4 | 4.5 | 6.8 | 22 | 34 | 50 | 0.00 | 0.03 | 0.06 | 0.79 | 0.6 |
| Single SB09 | 4.1 | 6.4 | 8.4 | 17 | 36 | 41 | 0.00 | 0.05 | 0.10 | 1 | 0.7 |
| Double / [O iii] ave | 4.0 | 5.7 | 6.9 | 22 | 54 | 249 | 0.00 | 0.03 | 0.15 | 0.01,0.4 | 0.6,0.1 |
| Double / [O iii] max | 4.2 | 6.2 | 6.9 | 21 | 79 | 145 | 0.00 | 0.03 | 0.10 | 0.01,0.4 | 0.6,0.1 |
| Double / no 3.6 | 3.6 | 5.5 | 6.0 | 23 | 81 | 146 | 0.00 | 0.06 | 0.15 | 0.01,0.4 | 2.0,0.1 |
| SED-fitting according to the Schaerer & de Barros (2009) method. | |||||||||||
4.1.1 A single stellar population model
Although the single stellar population model with a declining exponential SFR is clearly an oversimplification it can set useful limits. From Table 3, we see that in all cases the best-fit stellar mass is well above and the age more than 700 Myrs, implying a formation redshift z13. The variation in the [O iii] flux of a factor 10 does not have a strong impact on the values of mass, age and SFR. Even neglecting the 3.6 band, the stellar mass is set to 4.51010 (with a minimum value of 3.4), but the most notable change is that some dust extinction is allowed, with a best fit =0.06.
It is worth noting that the stellar mass and ages we find are comparable to those derived by Wiklind et al. (2008) and Stark et al. (2007) if the nebular line treatment is not inserted. If we insert the [O iii] prescription, our estimates become somewhat smaller, even though still significatively large given the redshift of the source (corresponding to 0.91 Gyrs after the Big-Bang). In particular, Stark et al. (2007) derive a mass of but without including the 5.8 and 8 IRAC bands in the SED fitting, while Wiklind et al. report a mass of 7 but assume a photometric redshift of 5.2.
For comparison we have also fitted the SED with the method of Schaerer & de Barros (2009) allowing for numerous emission lines. The results obtained (see Table 3 and Fig. 5) are compatible with the two other approaches used here (see also next section). In addition, these models predict an intrinsic Ly equivalent width of EW(Ly) 49-70 Å (1 interval), in good agreement with the observations. It is worth mentioning that the present source is different from those analyzed by Schaerer & de Barros (2009), extracted from a sample of z6 star-forming galaxies of Eyles et al. (2007). First, the photometric break between the NIR bands and the first two Spitzer/IRAC channels 3.6 and 4.5 is at least twice for our source, 1.5 mags. The source is brighter in absolute scale, allowing smaller photometric errors see Table 2. The main nebular contributors at z5.6 to the IRAC channels 3.6 and 4.5 are the H, [O iii], and H lines, respectively. In this case the H line falls on the blue edge of the 3.6 filter transmission (Fazio et al. (2004)), so its contribution is further attenuated. However, more importantly, in our case the source has also been detected where the contribution of nebular lines is less effective (at this redshift), i.e. in the 5.8 and 8.0 bands. Even though the photometric errors slightly increase in these bands, the break is still large ( 1 magnitude). For comparison, in the sample of Eyles et al. (2007), the source SBM031 (with = 25.35) has not been detected in the reddest IRAC channels 3 and 4. This is the main reason for this galaxy maintaining a relatively large estimation of the age and stellar mass, even considering the nebular contribution.
4.1.2 A mixed stellar population model
In this case we allow for two stellar populations with different redshifts of formation and different star formation histories. The only constraint we impose (a part the spectroscopic redshift) is that both stellar populations are affected by the same dust extinction. In Table 3 the best-fit values for total stellar mass and the star formation rate corresponding to the sum of the two contributions are shown, each taken with the relevant normalization factor, while we separately report two best-fit ages for each population. In all cases, the best-fit solution is made by an older stellar component (of 0.4 Gyrs) that contributes to most of the stellar mass, while the young component has high values of SFR.
The global stellar mass remains similar to the previous single population case, regardless of the [O iii] treatment, with mean values of 5-6 and in all cases greater than 4. The SFRs increase by a factor of at least two, and solutions with values as high as SFR=250 are acceptable. In all cases, the e-folding timescale of the star formation rate of the young population is close to 100 Myrs. The derived ages of the two stellar populations are 0.01 and 0.4 Gyrs, independent of the [O iii] treatment. The age of the old component is still quite large (but less than the previous case), implying a formation redshift around z8. Most important, solutions with small but non negligible dust extinction are always preferred.
Formally the best-fit solution among those including all bands is the double population with maximum [O iii] contribution (). 222We performed separate fits with enlarged errors in the 5.8 and 8 channels to explore their possibile underestimation, and the consequence is even higher stellar masses, since more weight is given to the 3.6 and 4.5 bands. In summary we consider that 5 is a fair estimate of the total stellar mass and that, considering all uncertainties in the data and in the modeling, a solid lower limit can be set at (the contribution of the young component to the total stellar mass is negligible, 1% in all cases). The galaxy contains a stellar population that is at least 400 Myrs old, and the average extinction (=0.03-0.06) is smaller but not incompatible with the extinction factor that comes from the Ly profile modeling (see below).
4.2 Modeling of the Ly line

| Param. | zsys_V400 | zsys_V500 | zsys | V400 | V500 | free |
|---|---|---|---|---|---|---|
| [cm-2] | 20.8 | 20.8 | 20.8 | 20.8 | 21.4 | |
| [km s-1] | 400 | 500 | 500 | 400 | 500 | |
| 3.0 | 3.0 | 3.0 | 3.0 | 3.0 | ||
| [km s-1] | 10.0 | 40.0 | 40.0 | 20.0 | 10.0 | |
| 5.553 | 5.553 | 5.553 | 5.551 | 5.540 | ||
| 3.97 | 3.22 | 3.22 | 3.19 | 1.785 | 1.785 |
The galaxy shows an Ly emission line with an FWHM of 600 , an evident asymmetric profile, a clear sharp decline in flux on the blue side and a red tail of Ly photons extending up to 40Å (1500 ) from the peak of the line (see inner box of Fig. 1 and Fig. 3).
Ly is a resonance line that undergoes a complicated radiation transport, with the line formation under the influence of numerous parameters: not only dust but also the geometry, kinematics, and temperature structure of the neutral ISM (e.g. Ahn et al. (2003), Verhamme et al. (2006)). These parameters influence the line profile and, if sufficient care is taken, the line profile itself can be used to provide independent and unique constraints (Verhamme et al. (2008)). Using the Monte Carlo Lyman-alpha (MCLya) radiation transfer code of Verhamme et al. (2006), we computed a wide array of possible emergent line profiles.
Parameter fitting is performed using a standard least squares fitting engine to minimize the statistic. Details of the software and fitting can be found in Hayes et al. (2009, in prep). The parameter space is not entirely unconstrained; e.g., it is possible to observationally constrain two of the parameters: the N iv] 1486 line puts the systemic redshift at 5.553; and the velocity shift between N iv] 1486 and Ly constrain the expanding velocity of the gas shell to respect the stellar component, =457 km s-1 (See Table 1). Since our grid of shell parameters is discrete, we adopted the nearest values of the outflow velocity of 400 and 500 km s-1. We ran six independent fits in total for all combinations of constraints denoted as follows: zsys_V400 and zsys_V500 constraining both and (400 and 500 km/s); zsys constraining ; V400 and V500 constraining (400 and 500 km/s, respectively); and free in which all parameters are fit without constraint.
The results of the fits are presented in Fig. 9 and Table 4. In general, all the fits agree with the case free, in particular V500 and free produce the same values. The Ly modeling favors high column densities ( cm-2), outflow velocities of 400-500 km/s (consistent with observations when is allowed to vary), and a 3.0 for all models with error of +1/-2 (in the free case), which provides a rough estimate of the extinction .
We also explored the possibility that the emerging Ly shape is caused by a static gas (=0). In this case the expected double-peaked structure (e.g. Verhamme et al. (2006)) would mimic the single peak observed, since the bluer one could be self-absorbed (by the galaxy and IGM). From the modeling it turns out that high values of the Doppler333Where the Doppler parameter is as the contribution of thermal and turbulent motions. parameter and intrinsic FWHM are favored, 160km/s and 1000 km/s, respectively. This is not surprising since it is a way to drive photons away from line center in the absence of a wind. However, in all cases the resulting fit worsens in general and, in particular, the extended red and wavy tail of the line is no longer reproduced. Conversely, this feature favor the above interpretation of backscattered photons from an expanding shell (the presence of a wind would agree also with the ongoing star formation activity).
It is worth mentioning that we do not expect that the extinction undergone by the nebular lines ( from Ly fitting) should match what is undergone by the stars (, from SED fitting). Indeed Verhamme et al. (2008) find a large scatter in the relation between the extinction determined from the Ly profile fits versus other methods including photometric fit and/or measured spectral slopes (see Fig. 12 of their work). Calzetti et al. (2001) find an empirical relation of = 0.44 , which would make the two results even more consistent (within their uncertainties).
5 Discussion
5.1 Summary of the modeling
The SED fitting and the Ly modeling indicate that:
-
1.
The column density of the nebular neutral gas is high, . We note that this value is comparable to those found for the damped Lyman-alpha systems, e.g., Wolfe et al. (2005).
-
2.
The outflow velocity derived from the Ly modeling is consistent with the observed one, and it is relatively high (greater than 400 km/s).
-
3.
A young and an evolved stellar population are both present. The first with an SFR in the range 30-200 and negligible contribution to the total stellar mass (1%). The second with a stellar mass of 51010 and an age of 0.4 Gyr.
-
4.
The extinctions derived from the different methods are compatible within the 1- uncertainties and in general are relatively small (in the range 00.3).
Although the signal-to-noise ratios are low, the galaxy is strongly detected in both the IRAC 5.8 and 8.0 bands, where no nebular lines or strong nebular continuum should contribute at . Even if emission lines contribute flux to the shorter wavelength IRAC channels, the longer-wavelength IRAC channels indicate a significant increase in flux density relative to the rest-frame UV continuum, suggesting the presence of a Balmer break from an evolved stellar population.
Summarizing, this galaxy shows several interesting observed properties: 1) its stellar mass is still relatively high ( 51010) with a component of already evolved stellar populations (0.4 Gyr); 2) it contains a star-forming component able to produce nebular emission lines and with an age of 10 Myr; 3) a substantial wind is measured both from the optical spectrum and from the Ly modeling, of 450/500 km/s; and 4) the source is compact in the rest-frame UV and U-band rest-frame wavelengths.
5.2 An already dense galaxy ?
As described in the previous sections, the SED fitting analysis implies a stellar mass of 5, with a significant, evolved component with an age of 0.4 Gyr. If the very compact size measured in the ACS and ISAAC images for the rest-frame ultraviolet light can be assumed to apply to the overall distribution of the evolved stellar population, then it implies a very high stellar mass density:
-
1.
If we assume a constant size over all wavelengths from the 1400Å to optical bands rest-frame (ACS band, 0.11 kpc physical), the stellar density in a spherical symmetric shape turns out to be =(0.5)/(4/3) 3.5.
-
2.
Similarly, assuming a constant size over all wavelengths from the 3300Å rest frame (ISAAC band, 0.9 kpc physical), the stellar density in a spherical symmetric shape turns out to be =(0.5)/(4/3) 8.2.
In both cases, given the estimations of the effective radius and the stellar mass of 5, the source appears to be ultradense if compared with the local mass-size relation. In case (1) the stellar mass density should be considered an upper limit if the derived from the 1400Å rest-frame is a fair estimate of the smallest size. Locally, on average, the is larger than 2 kpc (3 kpc) for early type (late type) galaxies with the comparable stellar mass (Shen et al. (2003)).
Interestingly, the Ly modeling suggests (in all cases) a relatively high column density of the neutral gas, the turns out in the range . We further note that, assuming that the Schmidt law is valid at this redshift (Kennicutt 1998), adopting the observed area of 8.8 and two possible SFRs estimates (see Table 3), 30 and 100 , the mass of the gas turns out to be and , respectively, which represents a significant fraction if compared to the stellar mass ( 5).
As noted by Buitrago et al. (2008), massive ultradense spheroid observed at intermediate redshift 1.5-3 and the globular clusters have remarkably similar stellar densities (above ), suggesting a similar origin. A massive ultradense galaxy at 1.5-3 should form its stars very quickly in earlier epochs and in a high gas-density environment. In this sense the present source may represent a “precursor” of the ultradense spheroids recently discovered at redshift 1.5-3.
5.3 Feedback in action ?
The current burst of star formation may be caused by a previous infall of gas and/or to a merger event (even though the UV morphology is quite regular). A vigorous wind of 450 km/s is detected both from the observations (Ly and N iv] 1486 velocity offset) and from the Ly modeling (leaving all parameters free). As discussed above, the Ly emission arise from a compact region with an effective radius not larger than 0.1 kpc (the PSF-deconvolved in the band is 0.08 kpc physical), a possible indication that the outflow of gas is in its initial phase of expansion from the central region. This particular phase of the galaxy evolution showing hot and massive stars and/or a low-luminosity AGN may be an efficient mechanism to blow the material out from the potential well of the galaxy, in some way influencing the subsequent star formation activity and/or the surrounding IGM.
Wind propagation and escape is quite sensitive to the entrainment fraction and to the velocity of the wind itself. This occurs because the two primary forces limiting wind propagation are the galaxy’s potential well and the ram pressure of the gas that must be swept up even if the wind is fast. Moreover, if entrainment is significant, then the mass over which the wind energy and momentum must be shared may be much greater.
Therefore it is first useful to compare the escape velocity from the halo with the estimated wind velocity. Following the calculation of Ferrara et al. (2000), the escape velocity can be expressed as
| (1) |
with =1.65. The isothermal halo density profile is assumed (), with an extension out to a radius ==, defined as the radius within which the mean dark matter density is 200 times the critical density at redshift of the galaxy. The turns out to be 30 kpc at this redshift, assuming a halo mass of . Under these assumptions, the escape velocity is , about the same (or a bit larger) as the wind estimated velocity from spectral features, (or from the Ly modeling, ). It is possible that we are observing the transport of material from the galaxy to the halo, which will remain confined. If we assume a slightly lower mass of the halo, e.g. (a factor 10 higher than the stellar mass), then the escape velocity turns out to be and an =24 kpc. In this case, the velocity of the wind would be sufficient to escape the potential well of the halo.
Indeed, from SPH simulations it appears that the main contributors to the metal enrichment of the low-density regions of the IGM are “small” galaxies with stellar masses below (Aguirre et al. (2001b)), and similar results have been obtained by other authors (e.g. Oppenheime & Davè (2008), Bertone et al. (2005)). In the present case the uncertainty on the halo mass prevents any clear conclusion. If we assume a value lower than , then the expanding material may reach characteristic distances (namely “stall radius”) where the outflow ram pressure is balance by the IGM pressure up to few hundred kpcs (e.g. Aguirre et al. (2001a)).
6 Concluding remarks
A peculiar galaxy belonging to the GOODS-S field has been discussed. The main observed features are the relatively strong nebular emission in the ultraviolet (Ly and N iv] 1486) and the presence of the detected through the NIR VLT/ISAAC and Spitzer/IRAC data. Indeed, from the SED fitting with single and double stellar populations and the Ly modeling, it turns out that the source seems to have an evolved component with stellar mass of 51010 and age 0.4 Gyrs, a young component with an age of 0.01 Gyrs (contributing to 1% of the total stellar mass), and a star formation rate in the range of 30-200 . At present no evidence of common “N iv] emitters” is observed in surveys of high redshift galaxies or quasars. However, there are rare cases in the literature that show this line emission (together with other atomic transitions), spanning from a pure region source to a subclass of low-luminosity quasars. In the first case, very hot and massive stars with low metallicity are required to produce the N iv] line; however, it is difficult to reproduce the signal measured in the Spitzer/IRAC channels with a pure nebula, in particular at wavelengths beyond 4.5 , i.e. to reconcile the two observed facts: 1) the presence of a relatively evolved stellar population and 2) the low-metallicity environment needed if the N iv] emission arises from stellar photoionization. Alternatively, the low-luminosity quasar/AGN interpetation may explain the N iv] emission, the broad Ly component, and the properties of the host galaxy discussed here, i.e., starforming, massive, and evolved galaxy.
The limits on the size derived from the ACS/ and VLT/Ks bands indicate that this object is denser than the local ones with similar mass, with a significant mass of the gas still in place (comparable to the stellar one). A relatively high nebular gas column density is also favored from the Ly line modeling, , comparable to those found for the damped Lyman-alpha systems. The region emitting Ly photons is spatially compact, close to that at the continuum emission at 1400Å, 0.1 kpc, in which a vigorous outflow ( 450/500 km/s) has been measured from the spectrum and Ly modeling. The gas is expanding from this region, but given the uncertainty on the halo mass, it is dubious whether it will pollute the IGM to great distances.
Such special objects are the key to understanding fundamental passages in the formation and evolution of the galaxy population. Future instruments will shed light on the nature of this interesting object, in particular, the JWST and the ELTs will give better and new constraints on the optical rest-frame morphology and nebular emission.
Acknowledgements.
We would like to thank the anonymous referee for very constructive comments and suggestions. We are grateful to the ESO staff in Paranal and Garching, who greatly helped in the development of this program. We thank J. Retzlaff for the informations about the VLT/Ks images of the GOODS-S field and the useful comments and discussions of P. Tozzi, F. Calura, R. Chary, S. Recchi, P. Monaco, and F. Fontanot about the work. EV would like to thank Anna Raiter and R.A.E. Fosbury for precious discussions about the photoionization modeling. We acknowledge financial contributions from contract ASI/COFIN I/016/07/0 and PRIN INAF 2007 “A Deep VLT and LBT view of the Early Universe”.References
- Ando et al. (2006) Ando, M., Ohta, K., Iwata, I., Akiyama, M., et al., 2006, ApJ, 645, 9
- Ando et al. (2007) Ando, Masataka, Ohta, Kouji, Iwata, Ikuru, Akiyama, Masayuki, Aoki, Kentaro, Tamura, Naoyuki, 2007, PASJ, 59, 717
- Aguirre et al. (2001b) Aguirre, Anthony, Hernquist, Lars, Schaye, Joop, Weinberg, David H., 2001, ApJ, 560, 599A
- Aguirre et al. (2001a) Aguirre, Anthony, Hernquist, Lars, Schaye, Joop, Katz, Neal, Weinberg, David H., Gardner, Jeffrey, 2001, ApJ, 561, 521A
- Ahn et al. (2003) Ahn, Sang-Hyeon, Lee, Hee-Won, Lee, Hyung Mok, 2003, MNRAS, 340, 863A
- Baldwin et al. (2003) Baldwin, J. A., Hamann, F., Korista, K. T., et al., 2003, ApJ, 583, 649
- Balestra et al. (2010) Balestra, I., Mainieri, V., Popesso, P., Dickinson, M., et al., 2010, A&A, 512, 12
- Beckwith et al. (2006) Beckwith, S. V. W., et al. 2006, AJ, 132, 1729
- Bentz et al. (2004) Bentz, M. C., Hall, P. B., & Osmer, P. S., 2004, AJ, 128, 561
- Bertone et al. (2005) Bertone, Serena, Stoehr, Felix, White, Simon D. M., 2005, MNRAS, 359, 1201B
- Binette et al. (2003) Binette, L., Groves, B., Villar-Martin, M., Fosbury, R. A. E., Axon, D. J., 2003, A&A, 405, 975B
- Bouwens et al. (2006) Bouwens, R.,J., Illingworth, G.,D., Blakeslee, J.,P., Franx, M., 2006, ApJ, 653, 53
- Bouwens et al. (2007) Bouwens, R. J., Illingworth, G. D., Franx, Marijn, Ford, Holland, 2007, ApJ, 670, 928
- Bouwens et al. (2008) Bouwens, R. J., Illingworth, G. D., Franx, M., Ford, H., 2008, ApJ, 686, 230
- Buitrago et al. (2008) Buitrago, F., Trujillo, I., Conselice, C. J., Bouwens, R., J., Dickinson, M., Yan, H., 2008, ApJ, 687, 61
- Castellano et al. (2007) Castellano, M., Salimbeni, S., Trevese, D., Grazian, A., Pentericci, L., et al., 2007, ApJ, 671, 1497C
- Cimatti et al. (2008) Cimatti, A., Cassata, P., Pozzetti, L., Kurk, J., Mignoli, M., Renzini, A., et al., 2008, A&A, 482, 21C
- Conselice et al. (2008) Conselice, Christopher J., Rajgor, Sheena, Myers, Robert, 2008, MNRAS, 386, 909
- Cristiani et al. (2004) Cristiani, S., Alexander, D. M., Bauer, F., Brandt, W. N., et al., 2004, ApJ, 600, 119
- Chen et al. (2009) Chen, Yan-Mei, Wang, Jian-Min, Yan, Chang-Shuo, Hu, Chen, Zhang, Shu, 2009, ApJ, 695, 130
- Daddi et al. (2005) Daddi, E., Renzini, A., Pirzkal, N., Cimatti, A., et al., 2005, ApJ, 626, 680D
- Davies et al. (2007) Davies, R. I., Sanchez, F. Mueller, Genzel, R., et al., 2007, 2007, ApJ, 671, 1388
- Dickinson et al. (2004) Dickinson, M., Stern, D., Giavalisco, M., Ferguson, H. C., Tsvetanov, Z., et al., 2004, ApJ, 600, 99
- Dickinson et al. (2003) Dickinson, Mark, Papovich, Casey, Ferguson, Henry C., Budavári, Tamàs, 2003, ApJ, 587, 25D
- Dickinson et al. (2003b) Dickinson et al. 2003, in the proceedings of the ESO/USM Workshop ”The Mass of Galaxies at Low and High Redshift” (Venice, Italy, October 2001), eds. R. Bender and A. Renzini, astro-ph/0204213
- Drory et al. (2004) Drory, N., Bender, R., Hopp, U., 2004, ApJ, 616, 103
- Elbaz et al. (2007) Elbaz, D., Daddi, E., Le Borgne, D., Dickinson, M., Alexander, D. M., et al., 2007, A&A, 468, 33E
- Eyles et al. (2005) Eyles, L. P., Bunker, A. J., Stanway, E. R., Lacy, M., Ellis, R. S., Doherty, M., 2005, MNRAS, 364, 443
- Eyles et al. (2007) Eyles, L. P., Bunker, A. J., Ellis, R. S., Lacy, M., Stanway, E. R., Stark, D. P., Chiu, K., 2007, MNRAS, 374, 910
- Fan et al. (2003) Fan, X., Strauss, M. A., Schneider, D. P., & Becker. R. H., 2003, AJ, 125, 1649
- Fazio et al. (2004) Fazio, G. G., Hora, J. L., Allen, L. E., et al., 2004, ApJS, 154, 10F
- Ferguson et al. (2004) Ferguson, Henry C., Dickinson, Mark, Giavalisco, Mauro, Kretchmer, Claudia, et al., 2004, ApJ, 600,107
- Ferrara et al. (2000) Ferrara, Andrea, Pettini, Max, Shchekinov, Yuri, 2000, MNRAS, 319, 539F
- Fontana et al. (2003) Fontana, A., Donnarumma, I., Vanzella, E., Giallongo, E., Menci, N., et al., 2003, ApJ, 594, 9
- Fontana et al. (2006) Fontana, A., Salimbeni, S., Grazian, A., Giallongo, E., Pentericci, L., et al., 2006, A&A, 459, 745F
- Fontana et al. (2009) Fontana, A., Santini, P., Grazian, A., Pentericci, L., Fiore, F., et al., 2009, (arXiv/0901.2898)
- Fontanot et al. (2007) Fontanot, F., Cristiani, S., Monaco, P., Nonino, M., Vanzella, E., Brandt, W. N., Grazian, A., Mao, J., 2007, A&A, 461, 39
- Fosbury et al. (2003) Fosbury, R. A. E., Villar-Martín, M., Humphrey, A., Lombardi, M., et al., 2003, ApJ, 596, 797
- Giavalisco et al. (2004a) Giavalisco, M., Ferguson, H. C., Koekemoer, A. M., Dickinson, M., Alexander, D. M., Bauer, F. E., Bergeron, J., et al. 2004, ApJ, 600, L93
- Giavalisco et al. (2004b) Giavalisco, M., Dickinson, M., Ferguson, H. C., Ravindranath, S., Kretchmer, C., Moustakas, L. A., Madau, P., Fall, S. M., Gardner, Jonathan P., Livio, M., Papovich, C., Renzini, A., Spinrad, H., Stern, D., Riess, A., 2004, ApJ, 600, 103
- Glikman et al. (2007) Glikman, Eilat, Djorgovski, S. G., Stern, Daniel, Bogosavljevic, Milan, Mahabal, Ashish, 2007, ApJ, 663, 73
- González Delgado et al. (2004) Gonzalez Delgado, Rosa M., Cid Fernandes, Roberto, Perez, Enrique, et al., 2004, ApJ, 605, 127
- Grazian et al. (2006) Grazian, A., Fontana, A., de Santis, C., Nonino, M., Salimbeni, S., Giallongo, E., Cristiani, S., Gallozzi, S., Vanzella, E., 2006, A&A, 449, 951
- Grazian et al. (2007) Grazian, A., Salimbeni, S., Pentericci, L., Fontana, A., Nonino, M., Vanzella, E., et al., 2007, A&A, 465, 393G
- Jiang et al. (2008) Jiang, Linhua, Fan, Xiaohui, Vestergaard, M., 2008, ApJ, 679, 962
- Keenan et al. (1995) Keenan, F. P., Ramsbottom, C. A., Bell, K. L., Berrington, K. A., et al., 1995, ApJ, 438, 500
- Kurk et al. (2009) Kurk, J., Cimatti, A., Zamorani, G., Halliday, C., Mignoli, M., Pozzetti, L., 2009, A&A accepted, (arXiv/0906.4489K)
- Labbé et al. (2006) Labbé, I., Bouwens, R., Illingworth, G. D., Franx, M., 2006, ApJ, 649, 67
- Le Fèvre et al. (2005) Le Fèvre, O., Vettolani, G., Garilli, B., Tresse, L., et al., 2005, A&A, 439, 845L
- Luo et al. (2008) Luo, B., Bauer, F. E., Brandt, W. N., Alexander, D. M., Lehmer, B. D., et al., 2008, ApJS, 179, 19L
- Miller et al. (2008) Miller, Neal A., Fomalont, Edward B., Kellermann, Kenneth I., Mainieri, Vincenzo, et al., 2008, ApJS, 179, 114M
- Moustakas et al. (2006) Moustakas, John, Kennicutt, Robert C., Jr., Tremonti, Christy A., 2006, ApJ, 642, 775M
- Nagao et al. (2008) Nagao, Tohru, Sasaki, Shunji S., Maiolino, Roberto, Grady, Celestine, 2008, ApJ, 680, 100N
- Nonino et al. (2009) Nonino, M., Dickinson, M., Rosati, P., Grazian, A., Reddy, N., Cristiani, S., et al., 2009, ApJ, 183, 244
- Oppenheime & Davè (2008) Oppenheimer, Benjamin D., Davè, Romeel, 2008, MNRAS, 387, 577O
- Ouchi et al. (2008) Ouchi, Masami, Shimasaku, Kazuhiro, Akiyama, Masayuki, et al., 2008, ApJ, 176, 301
- Panessa et al. (2006) Panessa, F., Bassani, L., Cappi, M., Dadina, M., Barcons, X., et al., 2006, A&A, 455, 173P
- Peng et al. (2002) Peng, Chien Y., Ho, Luis C., Impey, Chris D., Rix, Hans-Walter, 2002, AJ, 124, 266
- Pentericci et al. (2007) Pentericci, L., Grazian, A., Fontana, A., Salimbeni, S., Santini, P., de Santis, C., Gallozzi, S., Giallongo, E., 2007, A&A, 471, 433
- Pentericci et al. (2009) Pentericci, L., Grazian, G., Fontana, A., Castellano, M., Giallongo, E., Salimbeni, S., Santini, P., A&A, 2009, A&A, 494, 553P
- Polletta et al. (2006) Polletta, Maria del Carmen, Wilkes, Belinda J., Siana, Brian, et al., 2006, ApJ, 642, 673
- Polletta et al. (2008) Polletta, M., Omont, A., Berta, S., Bergeron, J., Stalin, C. S., Petitjean, P., 2008, A&A, 492, 81P
- Popesso et al. (2008) Popesso, P., Dickinson, M., Nonino, M., Vanzella, E., Daddi, E., et al., 2009, A&A, 494, 443P
- Raiter et al. (2009) Raiter, A., R. A. E., Fosbury, H., Teimoorinia and P. Rosati, 2009, A&A, 510, 109
- Ravindranath et al. (2006) Ravindranath, Swara, Giavalisco, Mauro, Ferguson, Henry C., Conselice, Christopher, Katz, Neal, et al., 2006, ApJ, 652, 963
- Santini et al. (2009) Santini, P., Fontana, A., Grazian, A., Salimbeni, S., Fiore, F., Fontanot, F., 2009, A&A accepted, (arXiv/0905.0683)
- Schaerer & Verhamme (2008) Schaerer, D., Verhamme, A., 2008, A&A, 480, 369
- Schaerer & de Barros (2009) Schaerer, Daniel, de Barros, Stephane, 2009, A&A accepted, (arXiv/0905.0866)
- Shapley et al. (2003) Shapley, A.E., Steidel, C.C., Pettini, M., Adelberger, K.L., 2003, ApJ, 588, 65
- Shen et al. (2003) Shen, Shiyin, Mo, H. J., White, Simon D. M., Blanton, Michael R., 2003, MNRAS, 343, 978S
- Silverman et al. (2008) Silverman, J. D., Lamareille, F., Maier, C., et al., 2008, ApJ, 696, 396
- Songaila (2004) Songaila, Antoinette, 2004, AJ, 127, 2598
- Stark et al. (2007) Stark, D. P., Bunker, A. J., Ellis, R. S., Eyles, L. P., Lacy, M., 2007, ApJ, 659, 84S
- Stark et al. (2009) Stark, D. P., Ellis, R. S., Bunker, A., Bundy, K., Targett, T., Benson, A., Lacy, M., 2009, ApJ, 697, 1493
- Steidel et al. (1999) Steidel, C.C., Adelberger, K.L., Giavalisco, M., Dickinson, M., Pettini, M., 1999, ApJ, 519, 1
- Stern et al. (2000) Stern, D., Bunker, A., Spinrad, H., Dey, A., 2000, ApJ, 537, 73
- Szokoly et al. (2004) Szokoly, G., P., Bergeron, J., Hasinger, G., Lehmann, I., Kewley, L., Mainieri, V., Nonino, M., Rosati, P., Giacconi, R., Gilli, R., Gilmozzi, R., Norman, C., Romaniello, M., Schreier, E., Tozzi, P., Wang, J., X., Zheng, W., Zirm, A., 2004, ApJS, 155, 271
- Taniguchi et al. (2005) Taniguchi, Y., Ajiki, M, Nagao, T.k, et al., 2005, PASJ, 57, 165
- Taniguchi et al. (2009) Taniguchi, Y., Murayama, T., Scoville, N. Z., Sasaki, S. S., et al. 2009, (arXiv/0906.1873)
- Tapken et al. (2007) Tapken, C., Appenzeller, I., Noll, S., Richling, S., Heidt, J., Meinkohn, E. and Mehlert, D., 2007,A&A, 467, 63
- Taylor-Mager et al. (2007) Taylor-Mager, Violet A., Conselice, Christopher J., Windhorst, Rogier A., Jansen, Rolf A., 2007, ApJ, 659, 162
- Tozzi et al. (2009) Tozzi, P., Mainieri, V., Rosati, P., Padovani, P., et al., 2009, ApJ, 698, 740
- Trujillo et al. (2007) Trujillo, Ignacio, Conselice, C. J., Bundy, Kevin, Cooper, M. C., 2007, MNRAS, 382, 109T
- Vanden Berk et al. (2001) Vanden Berk, Daniel E., Richards, Gordon T., Bauer, Amanda, et al., 2001, AJ, 122, 549
- van Dokkum et al. (2008) van Dokkum, Pieter G., Franx, Marijn, Kriek, Mariska, Holden, Bradford, Illingworth, Garth D., Magee, Daniel, et al., 2008, ApJ, 677, 5
- Vanzella et al. (2005) Vanzella, E., Cristiani, S., Dickinson, M., et al., 2005, A&A, 434, 53
- Vanzella et al. (2006) Vanzella, E., Cristiani, S., Dickinson, M., et al., 2006, A&A, 454, 423
- Vanzella et al. (2008) Vanzella, E., Cristiani, S., Dickinson, M., Giavalisco, M., et al., 2008, A&A, 478, 83
- Vanzella et al. (2009) Vanzella, E., Giavalisco, M., Dickinson, M., Cristiani, S., Nonino, M., et al., 2009, ApJ, 695, 1163
- Verhamme et al. (2006) Verhamme, A., Schaerer, D., Maselli, A., 2006, A&A, 460, 397
- Verhamme et al. (2008) Verhamme, A., Schaerer, D., Atek A., Tapken, C., 2008, A&A, 491, 89
- Villar-Martin et al. (2004) Villar-Martin, M., Cerviño, M., González Delgado, R. M., 2004, MNRAS, 355, 1132
- Wiklind et al. (2008) Wiklind, T., Dickinson, M., Ferguson, H. C., Giavalisco, M., Mobasher, B., Grogin, N. A., Panagia, N., 2008, ApJ, 676, 781
- Wolfe et al. (2005) Wolfe, A. M., Gawiser, E., Prochaska, J. X., 2005, ARA&A, 43, 861W
- Wuyts et al. (2008) Wuyts, Stijn, Labbè, Ivo, Schreiber, Natascha M. Forster, Franx, Marijn, et al., 2008, ApJ, 682, 985
- Yan et al. (2005) Yan, H., Dickinson, M., Stern, D., Eisenhardt, P. R. M., Chary, R., Giavalisco, M., et al., 2005, ApJ, 634, 109