PKS 1502+106: a new and distant gamma-ray blazar in outburst
discovered by the Fermi Large Area Telescope
Abstract
The Large Area Telescope (LAT) on board the Fermi Gamma-ray Space Telescope discovered a rapid ( 5 days duration), high-energy ( MeV) gamma-ray outburst from a source identified with the blazar PKS 1502+106 (OR 103, S3 1502+10, z=1.839) starting on August 05, 2008 ( UTC, MJD 54683.95), and followed by bright and variable flux over the next few months. Results on the gamma-ray localization and identification, as well as spectral and temporal behavior during the first months of the Fermi all-sky survey are reported here in conjunction with a multi-waveband characterization as a result of one of the first Fermi multi-frequency campaigns. The campaign included a Swift ToO (followed up by 16-day observations on August 07-22, MJD 54685-54700), VLBA (within the MOJAVE program), Owens Valley (OVRO) 40m, Effelsberg-100m, Metsähovi-14m, RATAN-600 and Kanata-Hiroshima radio/optical observations. Results from the analysis of archival observations by INTEGRAL, XMM-Newton and Spitzer space telescopes are reported for a more complete picture of this new gamma-ray blazar. PKS 1502+106 is a sub-GeV peaked, powerful flat spectrum radio quasar (luminosity at MeV, , is about erg s-1, and black hole mass likely close to M☉), exhibiting marked gamma-ray bolometric dominance, in particular during the asymmetric outburst (, and 5-day averaged flux F ph cm-2 s-1), which was characterized by a factor greater than 3 of flux increase in less than 12 hours. The outburst was observed simultaneously from optical to X-ray bands (F erg cm-2 s-1, and hard photon index , similar to past values) with a flux increase of less than one order of magnitude with respect to past observations, and was likely controlled by Comptonization of external-jet photons produced in the broad line region (BLR) in the gamma-ray band. No evidence of a possible blue bump signature was observed in the optical-UV continuum spectrum, while some hints for a possible 4-day time-lag with respect to the gamma-ray flare were found. Nonetheless, the properties of PKS 1502+106 and the strict optical/UV, X- and gamma-ray cross correlations suggest the contribution of the synchrotron self Compton (SSC), in-jet, process should dominate from radio to X-rays. This mechanism may also be responsible for the consistent gamma-ray variability observed by the LAT on longer timescales, after the ignition of activity at these energies provided by the BLR-dissipated outburst. Modulations and subsequent minor, rapid flare events were detected, with a general fluctuation mode between pink-noise and a random-walk. The averaged gamma-ray spectrum showed a deviation from a simple power-law, and can be described by a log-parabola curved model peaking around 0.4-0.5 GeV. The maximum energy of photons detected from the source in the first four months of LAT observations was GeV, with no significant consequences on extragalactic background light predictions. A possible radio counterpart of the gamma-ray outburst can be assumed only if a delay of more than 3 months is considered on the basis of opacity effects at cm and longer wavelengths. The rotation of the electric vector position angle observed by VLBA from 2007 to 2008 could represent a slow field ordering and alignment with respect to the jet axis, likely a precursor feature of the ejection of a superluminal radio knot and the high-energy outburst. This observing campaign provides more insight into the connection between MeV-GeV flares and the moving, polarized structures observed by the VLBI.
Subject headings:
gamma-rays: observations – quasars: individual: PKS 1502+106 (catalog ) – quasars: general – galaxies: active – galaxies: jets – X-rays: galaxies1. Introduction
The Large Area Telescope (LAT), on board the Fermi Gamma-ray Space Telescope (formerly GLAST; Ritz, 2007), was successfully launched by NASA on 2008, June 11, from Cape Canaveral, Florida, on a Delta II Heavy launch vehicle. While still in the commissioning and checkout phase, it discovered and monitored bright, flaring gamma-ray emission above 100 MeV from a source identified with the blazar PKS 1502+106 (historically also known as OR 103 and S3 1502+10). The large field of view, effective area and sensitivity and the nominal survey observational mode make Fermi-LAT an unprecedented all-sky monitor of -ray flares and source variability (see, e.g. McEnery, 2006; Thompson, 2006; Lott et al., 2007; Atwood et al., 2009).
At the beginning of August 2008, PKS 1502+106 was the second brightest extragalactic source in the -ray sky, exhibiting a sudden high-energy outburst announced in ATel #1650. This outburst successfully triggered the first (unplanned) Fermi multi-frequency campaign. Major renewed gamma-ray activity observed by Fermi in January 2009 was announced via ATel #1905.
PKS 1502+106 is a luminous, quasar-like (optically broad-line and flat radio spectrum) AGN discovered during the 178 MHz pencil beam survey from the Mullard Radio Astronomy Observatory, Cambridge, UK, (appearing in a list not included in the 4C catalog; Crowther & Clarke, 1966; Williams et al., 1967), and was re-observed and characterized as an extragalactic source by both the Australian National Radio Astronomy Observatory of Parkes, NSW, Australia, (Day et al., 1966, id.: PKS 1502+106), and the Ohio State University (“Big Ear”) Radio Observatory, Delaware, OH, USA, (Fitch et al., 1969, id.: OR 103). The source exhibited substantial radio flux variations (factor ), a high degree of linear polarization, a core-dominated, one-sided and curved radio jet with a variable, a complex morphology at VLBI scales (An et al., 2004; Lister et al., 2009a), and a compact large scale structure. 11 VLBA observations at 15.4 GHz performed between Aug. 1997 and Aug. 2007 showed a FWHM major beam axis in the range 1.02-1.57 mas, a minor axis beam axis of 0.5 mas, and a total flux density in the range 0.88-1.93 Jy (Lister et al., 2009a), and apparent jet speed of (Lister et al., 2009b). The 22 and 37 GHz flux history shows several long-term flares ( 1 Jy variations, i.e. of the total flux range span, on typical timescales of a year, and peak fluxes well above 2 Jy), with at least five flares and an average trend that was slightly increasing from 1988 to mid-2004 (Teräsranta et al., 2005). WMAP fluxes at similar frequencies (K, Ka, Q bands) are in agreement with these flux ranges (López-Caniego et al., 2007). The Doppler factor estimated from the observed 37 GHz variability and brightness temperature (Hovatta et al., 2009) agrees with the jet speed () cited above, a Doppler factor and viewing angle .
This radio blazar was identified in the optical band by Blake (1970) with a position refinement by Argue & Sullivan (1980), while an initial spectroscopic inspection was performed by Burbidge & Strittmatter (1972). Variations mag were observed in its optical flux history (Palomar-Quest and Catalina Sky Surveys, ATel #1661), together with a variable and relatively high degree (up to ) of linear polarization, pointing out a dominant synchrotron emission with no observed dilution by thermal components. The redshift of PKS 1502+106, as confirmed by the good S/N spectrum of the Sloan Digital Sky Survey ( at high confidence), is in agreement with the value estimated previously by Smith et al. (1977). A less remote value () is reported in other works (Burbidge & Strittmatter, 1972; Wright et al., 1979; Wilkes et al., 1983), although the possible multiple MgII absorption system (pointed out by a feature shortward of the 4388 Å emission line) would be very unusual for a low redshift object.
Serendipitous X-ray data of PKS 1502+106 are available because the source lies about NE of the bright Seyfert type-1 galaxy Mkn 841, although only one multifrequency work dedicated to this blazar (George et al., 1994) has appeared previously. Early X-ray observations (ROSAT, ASCA) showed low-amplitude variations on short timescales (factor on timescales of a year), a flat 0.1-10 keV photon index between 1.4 and 1.9, and an intrinsic X-ray luminosity of erg s-1, and a 2-10 keV flux in the range erg cm-2 s-1(George et al., 1994; Akiyama et al., 2003; Watanabe et al., 2004). PKS 1502+106 was speculated to be a possible -ray source before the LAT discovery because of the superluminal motions of jet components (up to as/year Lister & Homan, 2005; An et al., 2004), and the multiwaveband spectral indexes and (consistent with other FSRQs detected by EGRET, George et al., 1994). Only modest intrinsic X-ray absorption was suggested by this work, and the optical and near-IR reddening claimed in Watanabe et al. (2004) is probably due to the synchrotron jet dominance at these low frequencies rather than by absorption from inner nuclear light.
A relation involving the misalignment between the pc- and kpc-scale radio structure (position angle) and the -ray emission was postulated as well (Cooper et al., 2007). However, only a cumulative upper limit by EGRET of ph cm-2 s-1 was reported (Phase/Cycle I, combined Viewing Periods: 24.0 to 25.0, i.e. April 02-23, 1992; Fichtel et al., 1994), and the source was likewise undetected in the following EGRET cycles (Hartman et al., 1999; Casandjian & Grenier, 2008).
In the following we use a CDM (concordance) cosmology with values given within 1 of the WMAP results (Komatsu et al., 2009), namely , and , and a Hubble constant value km s-1 Mpc-1.
In Section 2, first results on the -ray identification, the observed MeV-GeV outburst and the subsequent four months of monitoring by the Fermi-LAT are described. In Section 3, multifrequency results obtained through simultaneous optical-UV-X-ray observations by Swift (thanks to a 16-day long monitoring following a triggered Target of Opportunity, ToO), and by radio-optical observatories (the 40m dish telescope of the Owens Valley Radio Observatory, the Effelsberg 100m dish radio telescope, the ring radio telescope RATAN-600, the VLBA within the MOJAVE program, and the Kanata telescope of the Higashi-Hiroshima Observatory) are summarized. In addition, past and unpublished observations by the XMM-Newton and Spitzer space telescopes are analyzed and presented in Section 4 for a more complete picture. Finally, in Section 5 and 6, discussion and concluding remarks are reported.
2. Gamma-ray observations and results by Fermi-LAT
2.1. LAT observations
The LAT instrument is a pair tracker-converter telescope comprising a modular array of 16 towers—each with a tracker based on silicon micro-strip detector technology—and a calorimeter based on a hodoscopic array of 96 CsI(Tl) crystals, surrounded by an Anti-Coincidence Detector capable of measuring the directions and energies of cosmic -ray photons with energies from 20 MeV to GeV (for details, see, e.g. Bellazzini et al., 2002; Michelson, 2007; Atwood et al., 2007, 2009; Abdo et al., 2009h).
The reduction and analysis of LAT data was performed using the Science Tools v.9.8, based in particular on a unbinned maximum-likelihood estimator of the spectral model parameters (gtlike tool). Events were selected using the Instrument Response Functions (IRFs) P6_V1_DIFFUSE. This selection provides the cleanest set of events (in terms of direction, energy reconstruction and background rejection) at the cost of reduced effective area at low energies, and takes into account the differences between front- and back-converting events. To minimize contamination by Earth albedo -ray events that have reconstructed directions with angles with respect to the local zenith have been excluded. For this object with high Galactic latitude, events are extracted within a acceptance cone centered at the PKS 1502+106 radio position. This cone, substantially larger than the 68% containment angle of the PSF at the lowest energies, provides sufficient events to accurately constrain the diffuse emission components. The gtlike model includes the PKS 1502+106 point source component, two other point sources from the 3 month catalog (both faint and low-confidence sources with TS of the TS value of PKS 1502+106 for the same period), a component for the Galactic diffuse emission (GALPROP code, see, e.g. Moskalenko et al., 2003, and references therein), and an isotropic component including the extragalactic diffuse emission and the residual background from cosmic rays.
The Fermi-LAT data of PKS 1502+106 presented here were obtained during the first four months of the LAT survey (Aug.-Dec. 2008). In this period PKS 1502+106 was one of the most persistently bright, variable sources in the high-energy sky and almost certainly the source with the highest luminosity. The background contribution within a few degrees was only a small fraction of the source count rate, with no nearby source confusion. The time interval was sufficient for a fine determination of the average spectrum, for a first look at the mid-timescale variability and detection of posterior flares, for a refined localization, and a first cross comparison with the other multifrequency monitoring data. The first -ray detection of PKS 1502+106 by the LAT occurred in July 2008, when it was confirmed by the high-level Automatic Science Processing pipeline monitoring (ASP; Chiang et al., 2006, 2007), based on a wavelet-based (pgwave) quick-look detection tool (e.g. Damiani et al., 1997; Marcucci et al., 2004; Ciprini et al., 2007a) and a maximum likelihood analysis, and by the LAT Source Catalog algorithm (mr_filter) based on wavelet analysis in the Poisson regime (Starck & Pierre, 1998) and the peak-finding tool sExtractor (Bertin & Arnouts, 1996). The rapid and markedly time-asymmetric -ray outburst announced in ATel #1650 and triggering an unplanned Target of Opportunity (ToO) multifrequency campaign was seen from Aug. 05 (about 23 UTC) until about Aug. 11, 2008 ( days duration), with a fast rise, slower decay, and an approximately two-day sustained peak flux.
Some caveats related to the preflight instrument response functions (P6_V1), which overestimated the acceptance at low energies, are briefly described in Abdo et al. (2009b).
2.2. Gamma-ray source localization, association and identification
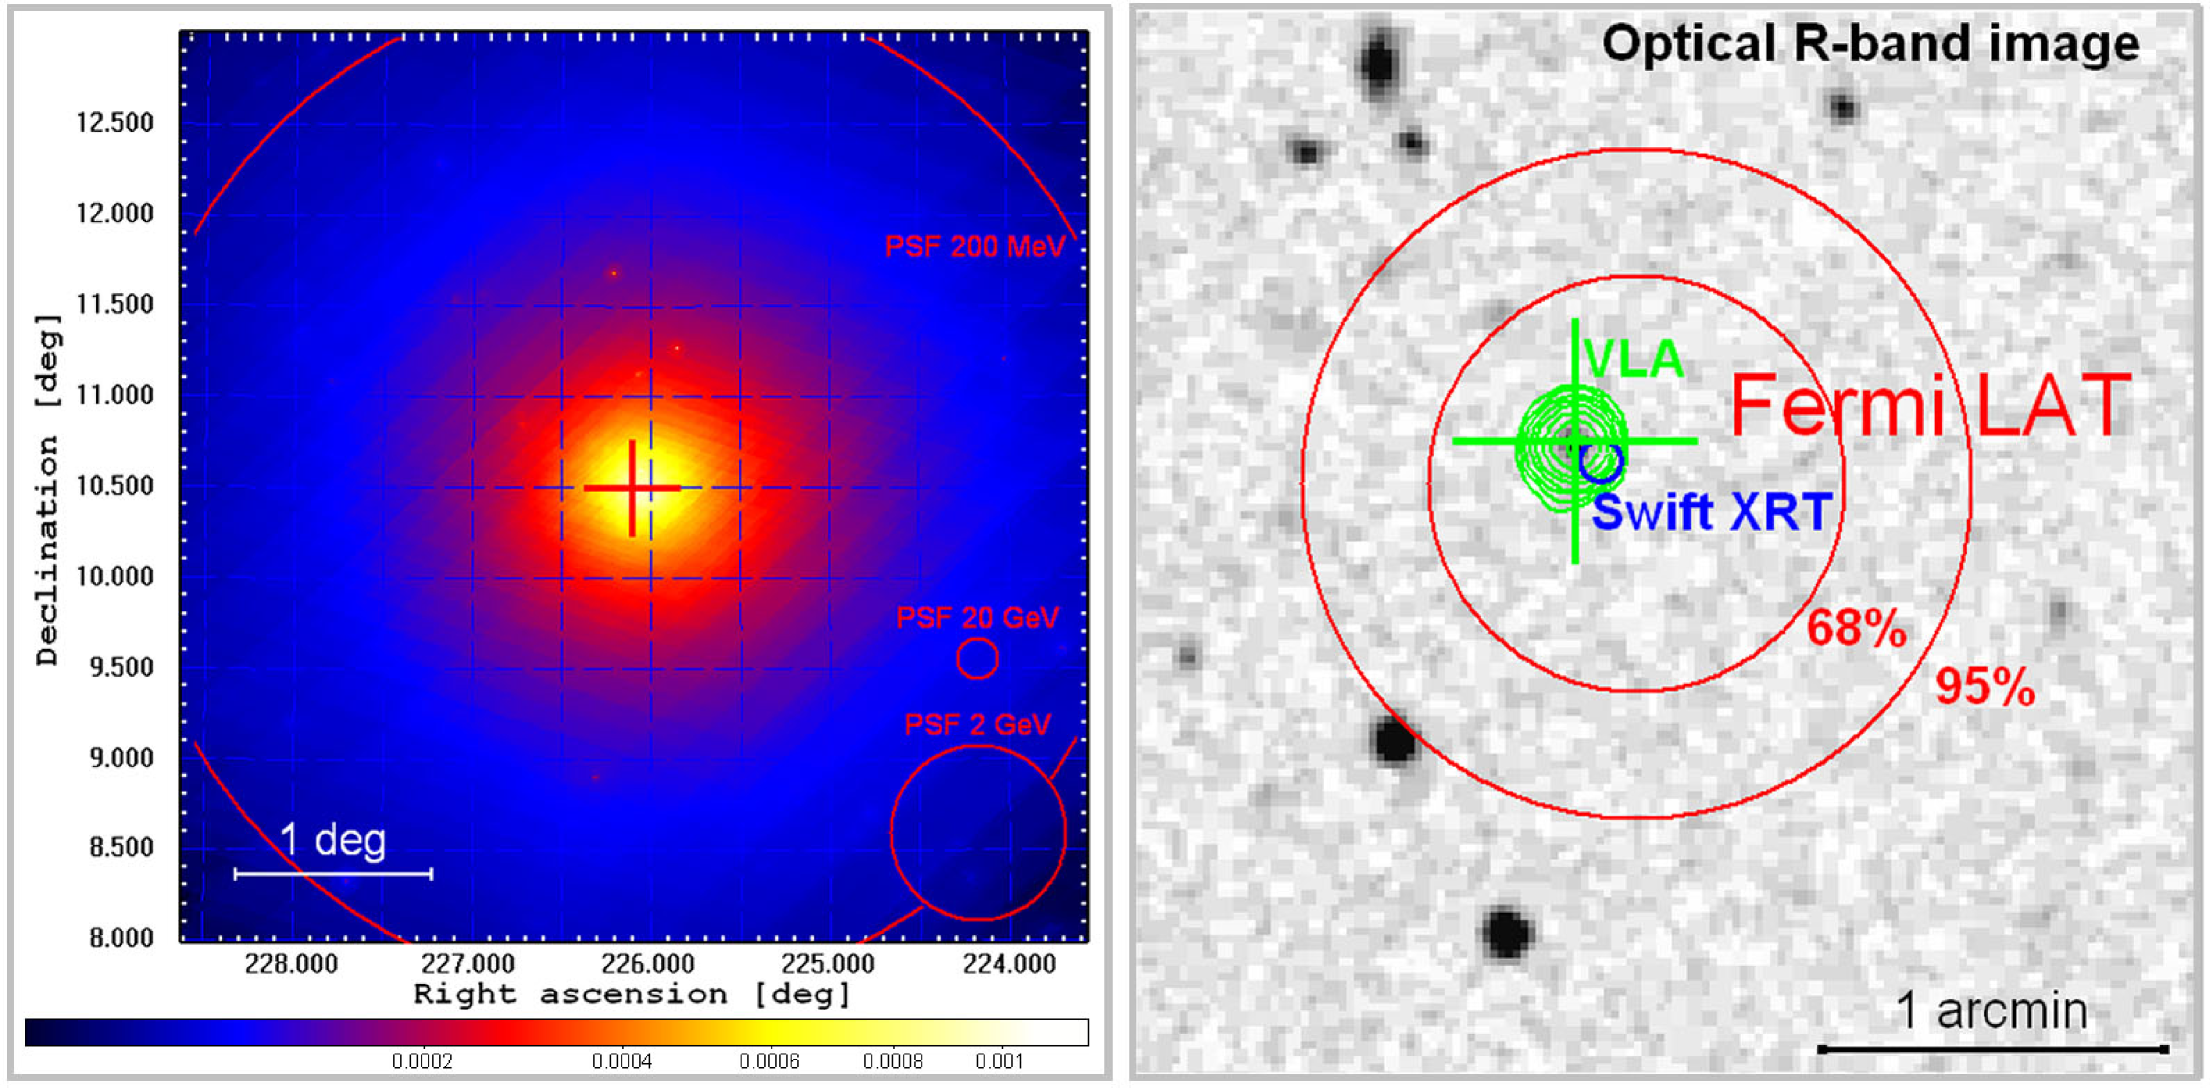
The LAT PSF and sensitivity provides an unprecedented angular resolution in gamma-rays (68% containment radius better than at 1 GeV, Atwood et al., 2007; Cecchi et al., 2007; Atwood et al., 2009; Abdo et al., 2009c, h), making the association and identification processes less difficult than in previous experiments. In the case of this very bright -ray source, we obtained—beyond the good spatial “association”—a firm “identification” with PKS 1502+106. The 3-month bright source list results (Abdo et al., 2009c, id: 0FGL J1504.4+1030), provided a good initial localization: RA: 226.12∘, Dec: +10.51∘; and , ( being the radius of 95% confidence region, TS the likelihood test statistic from the 200 MeV to 100 GeV analysis). Application of the pointlike tool (Burnett, 2007; Abdo et al., 2009c) on a much longer (nine-month, Aug. 2008 - Apr. 2009) LAT dataset with very high statistics, provided an excellent localization (outlined in Fig.1): RA: 226.10179∘, Dec: +10.4927∘, , with 68% and 95% LAT error circles of and respectively (statistical only). Studies of bright source localizations indicate a systematic uncertainty in the localization of ”, that can be taken as an estimate of the systematics with this tool (more details on the production of pointlike density maps and localization are described in Camilo et al., 2009). The relevant improvement in the localization carried out on a nine-month baseline is due to the high variability that occurred with this source. These localization values are in agreement with the VLBI radio and optical positions of PKS 1502+106, the VLA contours and the Swift XRT error box (Fig. 1). PKS 1502+106 is the only bright VLA radio source (calibrator source list) located within the LAT 95% confidence circle. The Seyfert galaxy Mkn 841 (observed with a hard X-ray cutoff, see Sect.4) is positioned well outside of these localization circles, as are other HB89-catalog quasars in this region.
Beyond the excellent spatial association, the most secure and distinctive signature for firm identification of this new gamma-ray source found by Fermi is the observed correlation between the -ray, X-ray and optical-UV variability (see sections 3 and 4). This object was also a member of the pre-launch CGRaBS (Healey et al., 2008, object id: CGRaBS J1504+1029) and Roma-BZCAT (Massaro et al., 2009, object id: BZQ J1504+1029 ) catalogs listing candidate gamma-ray blazars. Finally, a method based on a “figure of merit” (described in Sowards-Emmerd et al., 2003, 2005) for this LAT source position provides a very high likelihood of identification with PKS 1502+106.
2.3. Gamma-ray temporal behavior
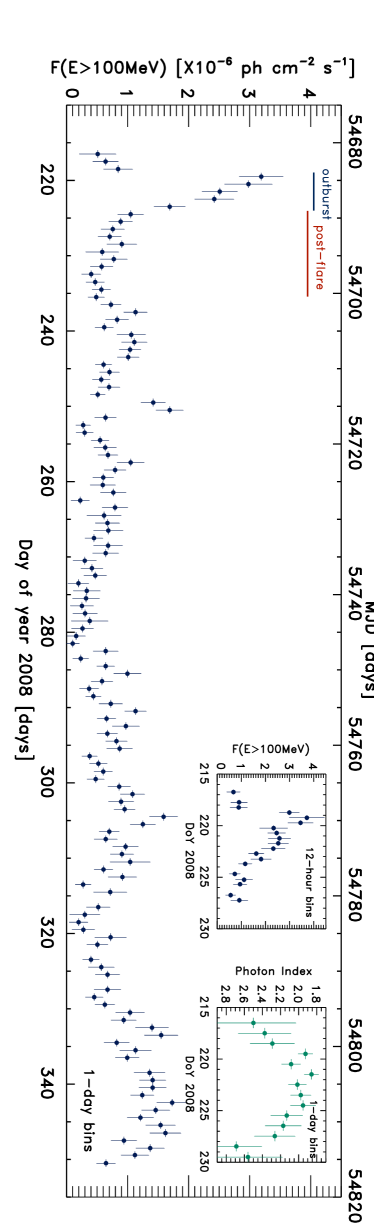
The typically bright -ray flux and the enduring activity shown by PKS 1502+106 in -rays, allowed a firm detection of the source by the LAT on a daily basis. Fig. 2 shows the light curve (daily bins, MeV) extracted with the gtlike tool over the first four and half months of LAT all-sky survey. A fast-rising, markedly asymmetric and bright outburst was found, with a factor of increase in flux in less than 12 hours. The integrated flux at MeV averaged in the 12h bin of the peak emission (between Aug. 05 and Aug. 06, 2008, i.e. DOY 218-219) was ph cm-2 s-1 (statistical only), as measured when the LAT instrument was still in commissioning and checkout phase (all-sky nominal mode). The emission from PKS 1502+106 then faded more slowly in the following days, and the entire outburst interval spanned Aug. 05 around 23 UTC until to Aug. 11 around 00 UTC, 2008 (i.e. DOY, 218.95-224.0, days duration Fig. 2). The peak flux appeared elevated for less than two days, rivaling the brighest apparent flux of other extragalactic sources at that time (Section 2.1). The finer, 12-hour bin light curve ( Fermi orbits, ensuring still similar exposures) reported in the right inset panel of Fig. 2, shows the elevated flux held for at least one 1.5 days, while the slower fading decay exhibits a high flux ( ph cm-2 s-1) plateau, or a secondary superposed flare, that extended for about 2.5 days. During this outburst a “harder when brighter” spectral trend is suggested, despite the photon index error dispersion (see the daily photon indices reported on the right inset panel of Fig. 2). The gtlike performances and the current IRFs used did not allow to go below a daily binning in the extrapolation of the photon index values, and this was possible in an acceptable way with respect to amplitude of the statistical error only for the high-flux and high photon count statistics available around the outburst epoch.
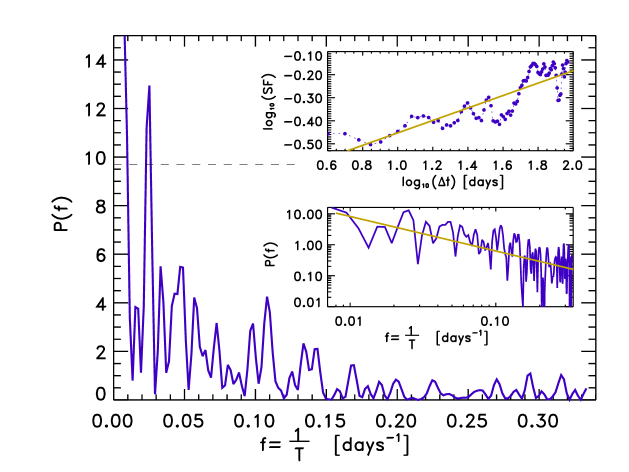
A consistent level of variability, with a couple of minor but relevant rapid flares, occurred after the major outburst with fluctuations on timescales of weeks. Renewed activity and increased average brightness from the end of Nov. 2008 were observed. Two rapid flares approached a maximum peak flux of ph cm-2 s-1(daily bin estimations), on Sept. 06 (DOY 250), where a simultaneous cross-correlated optical flare was observed as well, and on Oct. 30 (DOY 304). Visual inspection of the light curve reported in Fig.2 suggests a period of higher activity beginning in mid Nov. 2008 (after about DOY 320), and, in general, a series of modulations occurring on about a one-month timescale, with faster fluctuations and rapid flare episodes superposed. The power spectral density (PSD) shows a power-law dependence, . Similar time scale dependence is exhibited by the first order structure function (Fig. 3) and by the autocorrelation function. More detailed variability analysis for this and other blazars using a longer dataset will be presented in Abdo et al. (2009d).
above 100 MeV
| Interval [MJD (DOY)] | Best-fit Model and Parameters |
|---|---|
| All observations | Log-parabola |
| 54682.680 (217.680) | |
| 54775.580 (310.580) | |
| F [ph cm-2 s-1] | |
| Outburst/high state | Power Law |
| 54683.955 (218.955) | |
| 54688.985 (223.985) | F [ph cm-2 s-1] |
| Post-flare/lower state | Log-parabola |
| 54689.063 (224.063) | |
| 54775.580 (310.580) | |
| F [ph cm-2 s-1] |
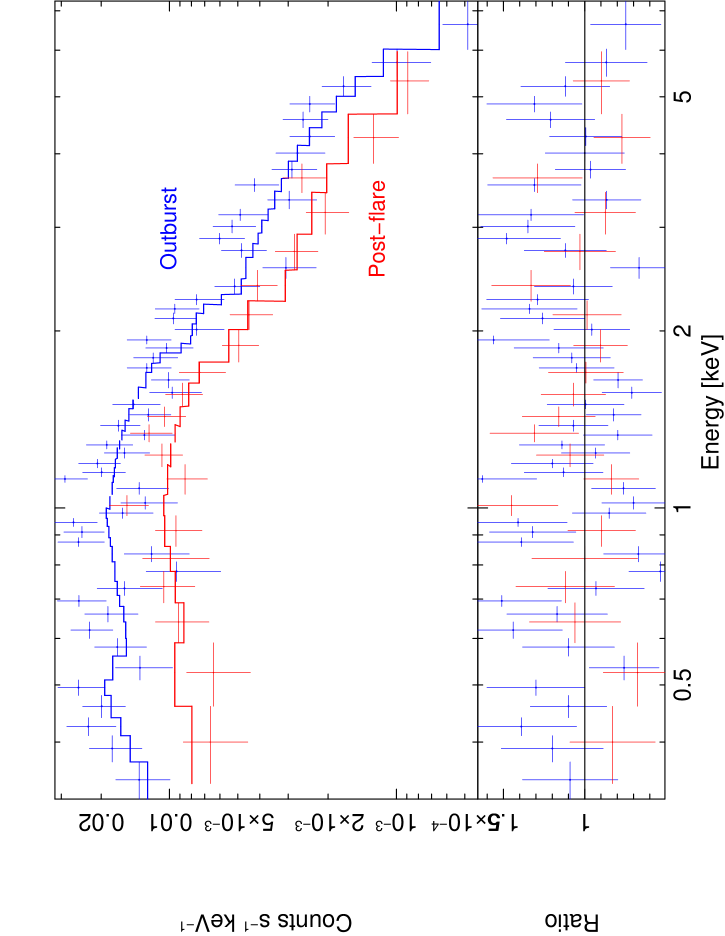
2.4. Gamma-ray spectra
We have analyzed the time-averaged spectra of PKS 1502+106 for three intervals: the high-state of the outburst (DOY, 218.95-224.0, i.e. Aug. 05 - Aug. 11, 2008, about 5 days); the post-flare period characterized by an intermediate brightness level and during which simultaneous Swift observations were performed (DOY 224.0-235.42, i.e.Aug. 11-Aug. 22, 2008, about 11.4 days); the longer and heterogeneous period that includes the outburst and the following 4 months of Fermi-LAT monitoring (Aug.02 to Dec.07, 2008, days, where the source displayed different stages of activity and significant variability). Events below 200 MeV were excluded from these analyses because of calibration uncertainties at those energies. An isotropic background model was used as PKS 1502+106 was very bright relative to other point sources during the period stated above, because is located at high Galactic latitude, and because checks with more complex models provided no significant difference. Furthermore, no appreciable differences were observed using different acceptance cone radii for the event extraction.
The spectra for the post-flare and cumulative 4-month datasets can be consistent with a log-parabola (LP) model, (see, e.g. Landau et al., 1986; Inoue & Takahara, 1996; Fossati et al., 2000; Massaro et al., 2004; Perlman et al., 2005). The likelihood ratio test (Mattox et al., 1996) rejects the hypothesis that the spectrum is a power law (null hypothesis) against the one that the spectrum is curved as a log-parabola model. This model is preferred over a simple power-law model at the 11.4 sigma significance level. Broken power-law (BPL) fits show a similar improvement over single power-law models, but we find no evidence to prefer BPL over the log-parabola representation. For the full time interval characterized by very high statistics, the logarithm of the likelihood increases significantly when allowing to vary, and an increase of the value for the BPL with respect to simple power-law model of the same order of the increase for the LP vs. power-law test is not observed. The LP description introduces the advantage of only one extra parameter (while BPL model adds two parameters) with respect to the simple power-law model, it allows modeling of mild spectral curvatures with no abrupt cutoffs, and provides a better phenomenological physical interpretation. On the other hand there can be still caveats when using gtlike with a broken power-law model, in particular in determining the break energy when statistics do not allow a high number of energy bins. It is also plausible that an energy spectrum averaged over a long period of time, and containing different activity stages with time varying hardness, may exhibit an apparent curvature. Finally this does not exclude BPL model if the spectrum is extracted in different time intervals.
The average spectrum during the outburst state is consistent with a simple power-law model, . The outburst state shows a rather hard spectrum, suggesting a maximum peak in the MeV energy bands (in the representation), in agreement with the LP peaks found for the spectra cited above. The extrapolated and averaged fluxes integrated above 100 MeV, and the spectral fit parameters for all three periods are shown in Table 1.
3. Simultaneous multifrequency observations
Because of the reasonably uniform exposure and high sensitivity of the LAT, and the broad-band radio-to-gamma-ray emission of this kind of AGN, simultaneous multifrequency data are very important to the investigation of the physical properties of supermassive black holes and relativistic jets, beyond the benefit of a firm source identification (Section 2.2). With this in mind, several campaigns on a few selected objects, or ToO list of candidates for flaring sources, were prepared pre-launch by the Fermi collaboration (Tosti, 2007; Thompson, 2007). PKS 1502+106 was a previously unknown -ray source, with no pre-planned multifrequency campaign. But following the LAT outburst (reported in ATel #1650), a ToO campaign was initiated on Aug. 07, 2008. This was the first Fermi multifrequency campaign that had not been planned pre-launch, and saw triggers for ToO pointings by INTEGRAL and Swift, long-term radio flux and structure monitoring, as well as optical observations by ground based facilities.
The fast response ToO pointing by INTEGRAL provided 200ks of observations during the period Aug. 09, 01:53 UT - Aug. 11, 15:12 UT, 2008 (revolution 711). However, PKS 1502+106 was not detected (preliminarily) by the imager IBIS on board INTEGRAL. Extrapolating the X-ray flux observed by Swift, the hard-X-ray flux had likely already faded to slightly below the IBIS detection threshold in this epoch (more details will appear in Pian et al., 2009).
3.1. Simultaneous X-ray and UV-optical observations and results by Swift
The Swift satellite (Gehrels et al., 2004) performed a ToO monitoring campaign of PKS 1502+106 with daily snapshots from Aug. 07 to Aug. 22, 2008. This quite long-term observing campaign by Swift allowed extended daily snapshots for about 16 days, using the three instruments onboard: the X-ray telescope (XRT) for the 0.2-10 keV energy band, the Ultraviolet/Optical Telescope (UVOT) for multiband photometry, and the Burst Alert Telescope (BAT) for the 15-150 keV hard X-ray band. BAT data were not used because of source confusion problems with Mkn 841 which is about a factor of 10 brighter than PKS 1502+106 in the hard X-ray band. The 16 days of observations by Swift allow for cross-correlation studies between the -ray, X-ray and UV-optical bands during both the active flaring stage and the fading post-flare stage of PKS 1502+106.
| Obs. id. (date) | Best-fit Model and Parameters |
|---|---|
| All observations | Power Law |
| (MJD 54685-54701) | |
| :52910s | =1.05/80 |
| F erg cm-2 s-1 | |
| Outburst/high state | Power Law |
| (MJD 54685-54689) | |
| :27680s | =1.11/52 |
| F erg cm-2 s-1 | |
| Post-flare/lower state | Power Law |
| (MJD 54690-54701) | |
| :25230s | =0.76/32 |
| F erg cm-2 s-1 |
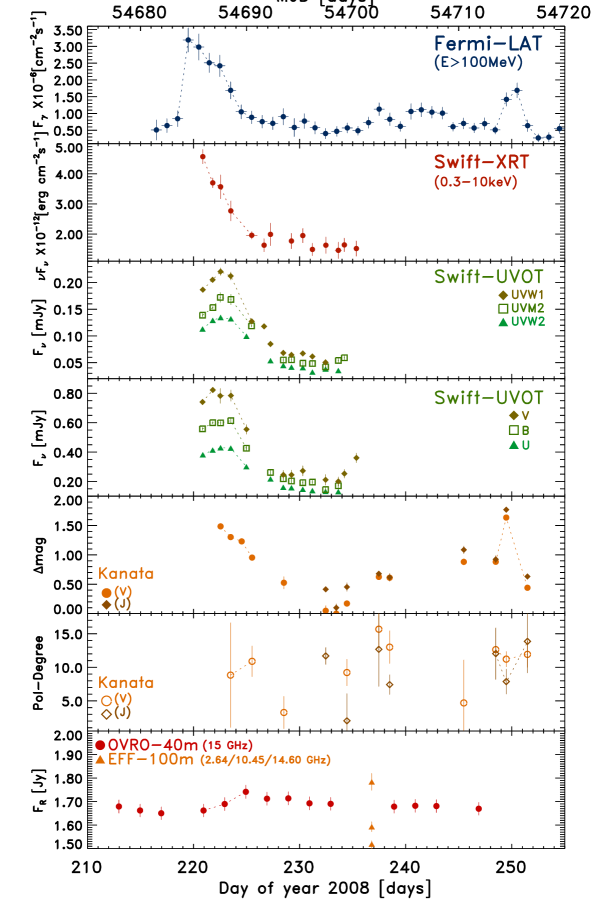
The XRT was set in photon counting mode, and the data were processed by the xrtpipeline with the use of standard software (HEADAS software, v6.4) and standard filtering and screening criteria. The XRT events in the 0.3–10 keV energy band were extracted using the xrtgrblc FTOOL from circular regions centered on the source position with variable radii depending on the source intensity and applying correction for vignetting, Point-Spread Function corrections and hot pixels and columns with the use of exposure maps. The XRT X-ray flux light curve is shown in the second panel of Fig. 4. The 0.3-10keV count rate of PKS 1502+106 measured by XRT was at a level 0.05 counts/sec (from our data), up from a level of 0.02 counts/sec (archival past observations). The 0.3-10 keV XRT 16-day long light curve obtained in August 2008 (Fig.4) shows an initial count rate of 0.05 counts/sec, and a gradual decay down to the level of about 0.02 counts/sec.
The X-ray spectrum of each observation segment was fitted with an absorbed power law. Because of the low number of events from the source, event were not grouped and C-statistics was used, fixing the column density to the Galactic value cm-2 in that direction (in agreement with values used, for example, in George et al., 1994; Akiyama et al., 2003), and using . The error on the photon index and the flux (0.3-10keV) is large due to the low statistics. The background photons were selected in a circular region close to the source. No significant photon index variation was observed between the high and the low state, while the count rate and flux did vary.
The Swift Ultraviolet/Optical Telescope (UVOT) photometry was done using the publicly available UVOT FTOOLS data reduction suite, and is in the UVOT photometric system described in Poole et al. (2008). The photometric data points were corrected for Galactic extinction using the dust maps of Schlegel et al. (1998) and the Milky Way extinction curve of Pei (1992). These simultaneous multi-band optical and UV data show an increase of about 2 magnitudes in all filters when compared with the past-years archival values (i.e., from about 19 to 17 in B band). The flux light curves in the six UVOT bands are shown in the third and fourth panel of Fig. 4. These fluxes appears to be well correlated. A slight rise in flux of 3 days is observed in all the UVOT bands, followed by a fading similar to the flux decrease seen in -rays and X-ray bands. If the time of the observed UV and optical maximum is related to the flare activity at higher energies, this would imply an interesting time lag of about 4 days.
3.2. Simultaneous near-infrared and optical monitoring
PKS 1502+106 was also monitored in the optical V and near-infrared J bands with some photometric and polarimetric snapshots by the TRISPEC istrument attached to the 1.5-m “KANATA” telescope at the Higashi-Hiroshima Observatory, Japan (Watanabe et al., 2005; Uemura et al., 2008), within a twofold program of optical follow up for LAT flaring sources and regular monitoring of about 20 blazars. Imaging relative photometry was performed using some comparison stars in the same field, but due to the absence of an accurate calibration for this field we prefer to report only the relative magnitude difference mag with respect to the minimum level (fifth panel Fig. 4). The optical and near-infrared band imaging photometry is performed simultaneously in TRISPEC with a unit of polarimetric sequence (consisting of successive exposures at four position angles of the half-wave plate, where a set of linear polarization parameters, Q/I, U/I, are derived).
These flux observations, performed for a longer interval with respect to the Fermi-Swift campaign (i.e. until Sept. 22, 2008), show a high correlation between the V- and J-band light curves and show an optical decay phase comparable to that observed in the UVOT photometric observations (fifth panel of Fig.4). Remarkably, a strong correlation with the LAT gamma-ray light curve is found, including the first (Sept. 04-07, 2008) of the possible minor flares occurring after the initial large outburst. The observation of a flare in the optical (V) and near-IR (J) bands, simultaneous with a second -ray flare have the twofold advantage of providing a validation of such a minor LAT flare as a real feature displayed by this blazar, and, even more crucially, in confirming the firm identification of the new gamma-ray source seen by Fermi with the blazar PKS 1502+106.
Comparing the Kanata-TRISPEC V-band and J-band colors, the color index varies between 2.05 and 1.69 (during the Sept.04-07 minor, rapid flare cited above). On the other hand, the degree of linear optical (in bands) polarization observed (sixth panel of Fig.4) , remains rather scattered by error dispersion irrespective the flux level, even during the minor flare mentioned (the maximum degrees recorded during the monitoring were and ).
3.3. Simultaneous radio flux-structure data by single-dish and VLBI observations
As part of an ongoing blazar monitoring program, the Owens Valley Radio Observatory (OVRO) 40-m radio telescope has observed PKS 1502+106 at 15 GHz approximately every two days since mid-2007. Flux densities for the periods from July 26 to September 3, 2008 (MJD 54673–54711) and October 23 to December 9, 2008 (MJD 54762–54809) are shown in Figure 6. Flux densities were measured using azimuth double switching as described in Readhead et al. (1989) after peaking up on-source. The relative flux density uncertainty for this source is dominated by a conservative 1.6% systematic error with a typical thermal error contribution of 5 mJy. Absolute flux density is calibrated to about 5% using the Baars al. (1977) model for 3C 286. This absolute uncertainty is not included in the plotted errors.
The measured flux densities in the MJD 54673–54711 (DoY 208-246) time period fit a 1.69 Jy constant-flux model with ( data points). This indicates no statistically significant variability in this time period. The beginning of a bright radio flare is apparent in the MJD 54762–54809 (DoY 297-344) time period with an increase of at least 30% over the earlier mean flux density.
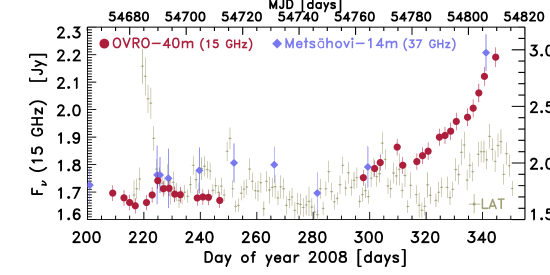
A less intensive monitoring at 37 GHz was carried out with the 13.7m radio telescope at Metsähovi Radio Observatory, Helsinki University of Technology, Finland. The flux density scale is set by observations of DR 21, and sources 3C 84 and 3C 274 are used as secondary calibrators. A detailed description on the data reduction and analysis can be found in Teräsranta et al. (1998).
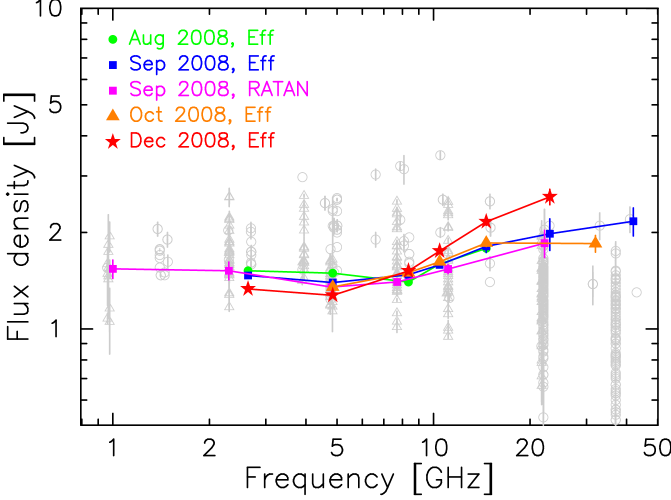
The PKS 1502+106 flare was also followed-up by the Effelsberg 100-m radio telescope with four multi-frequency radio spectra obtained on August 23, September 16, October 18, and December 6, 2008 (within the F-GAMMA project, see Fuhrmann et al., 2007). Each radio spectrum consists of simultaneous measurements at various frequencies between 2.6 and 42 GHz. The observations were performed using cross-scans in azimuth/elevation with the number of sub-scans matching the source’s brightness at the given frequencies. The data reduction was done using standard procedures described in Fuhrmann et al. (2008); Angelakis et al. (2008).
Other radio observations are available at six frequencies between 1 and 21.7 GHz thanks to the 600-m ring transit radio telescope of the Russian Academy of Sciences RATAN-600 (Korolkov & Parijskij, 1979), which observed the source on September 10, 26, and October 2, 2008. A weighted average of these three observations, is presented in Fig 7. Previous RATAN-600 data which cover the period between 1997 and March 2008 are also shown for comparison. The observing methods, the data processing, and the amplitude calibration is described in Kovalev et al. (1999).
All single-dish spectra obtained with the Effelsberg 100-m and RATAN-600 radio telescopes are presented in Figure 7. Here, no indication of a flare or strong difference/variability between August and September can be noted. However, the December 2008 spectrum shows the beginning of a bright radio flare with a clear spectral steepening towards higher frequencies ( GHz). This is in good agreement with the strong flux density increase seen in the 15 GHz light curve during November/December (Fig.7).
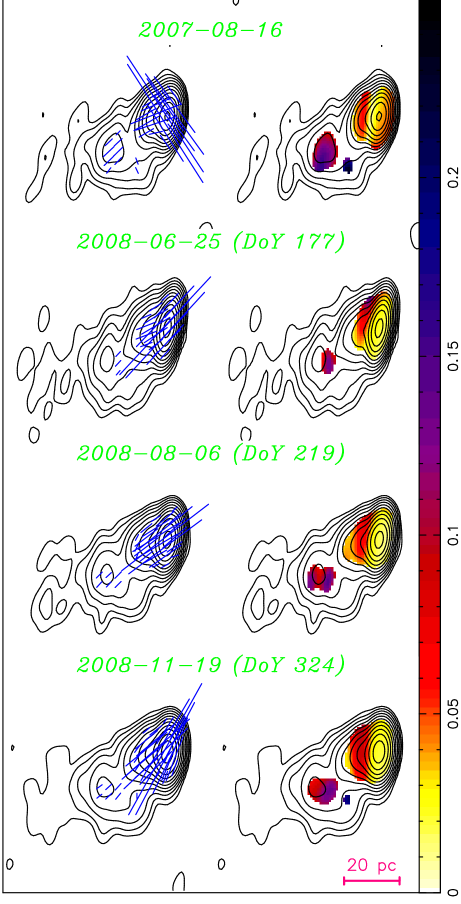
Detailed radio images at sub-milliarcsecond scale of the PKS 1502+106 superluminal jet were obtained during three epochs in 2008 with Fermi already in orbit: on June 25, August 06 (during the maximum peak of the -ray outburst), and November 19. These observations were performed as part of the MOJAVE monitoring program conducted with the Very Long Baseline Array (VLBA) at cm (Lister & Homan, 2005; Lister et al., 2009a) and provided useful high resolution total intensity and linear polarization images. These VLBA images close to the -ray flare are reported and compared to the map obtained one year earlier in Figure 8. The highest integrated flux density value since the beginning of the 2 cm VLBA monitoring in 1997 (Kellermann et al., 2004) was measured on November 19, 2008 (DOY 324) as Jy, with a peak intensity of 1.6 Jy beam-1. These values are significantly higher than the typical level of 1.3 Jy reported in the program (Kovalev et al., 2005; Lister et al., 2009a, b) and indicate a radio flare happening in the source VLBI core. The core flux density and brightness temperature raised to higher values as well which means that the flare happens in the VLBI core, as expected. These finding are in good agreement with the single-dish results presented above (Figure 6 and Figure 7). The second relevant feature is the direction of the electric vector position angle (EVPA) in the core region, which rotated between the 2007 and 2008 epochs by 90 degrees most probably indicating an opacity change — a precursor of an outburst in the VLBI core.
In summary, our single-dish and VLBI radio monitoring of PKS 1502+106 simultaneous to the Fermi LAT observations has revealed (i) no significant radio 15 GHz variability during the strong LAT -ray flare seen in August 2008, and (ii) a strong radio flare which becomes clearly visible at GHz during October/November 2008 (Figure 6) with a rise phase lasting for at least 20 days. If this flaring behavior is associated with the bright -ray flare of August 2008, a delay of more than three months ( days if the lag between the starting days of the -ray outburst, DoY 218.2, and the 15 GHz outburst, DoY 316.7, is considered) could be explained by opacity effects in the core region of the source (e.g., Aller et al., 1999). Although we cannot exclude the possibility of radio activity at 15 GHz during the OVRO 40-m observations outage (September 3 - Otober 23 2008) that might also be associated with the gamma-ray flare of August 2008, OVRO data before and after the outage as well as September and October Effelsberg 100-m data are consistent with very little change in the 15 GHz flux over this time period. The three flux measures at 37 GHz obtained at the Metsähovi radio observatory during the OVRO outage, confirms this trend with very little variability during this period. However, the observed radio flare could also be associated with, e.g., the more recent, prominent variability seen in the LAT -ray data during November/December (Figure 2, DoY 320–333). A more detailed analysis of such possible correlations and the source’s overall radio/-ray behavior seen with LAT and simultaneous radio observations over a longer period of time will be the subject of a subsequent work.
4. Archival multiwaveband data
A full multiwavelength analysis dedicated on PKS 1502+106 is available only from George et al. (1994), where old archival and broadband radio to X-ray data obtained in 1993-94 were presented. Data and analysis on PKS 1502+106 reported in other papers are mostly limited to the radio regime. In order to compare our multifrequency findings with the past, and to form a more complete characterization of this blazar, we briefly present here, for the first time, results from unpublished past observations by INTEGRAL, XMM-Newton, Swift, and Spitzer space telescopes performed in 2001, 2005 and 2006.
4.1. INTEGRAL observations in 2006
The sky region containing PKS 1502+106 was observed in 2006 by IBIS (83ksec, MJDs 53760.4 to 53762.4, Jan.25-27, 2006), and a new soft -ray source (IGR J15039+1022) was detected with a flux density of 1.6 mCrab in the 18-60 keV energy range (corresponding to erg cm-2 s-1, see ATel #1652). This IBIS source was identified with Mkn 841, a Seyfert galaxy known to display a well detected high energy cut-off around 100 keV (Petrucci et al., 2002), making it unlikely to emit in the -ray domain. The angular distance of PKS 1502+106 from IGR J15039+1022, , points to a clear non-detection during this Jan. 2006 INTEGRAL observation, while a 2 upper limit for PKS 1502+106 of 0.7 mCrab in the range 18-60 keV ( erg cm-2 s-1) is inferred.
4.2. XMM-Newton and Swift
Four serendipitous, unpublished XMM-Newton X-ray observations of PKS 1502+106 by the EPIC (MOS detector only) camera are available as the source was in the frame of the target Seyfert galaxy Mkn 841. PKS 1502+106 was always on the border of the MOS chips and out of the PN frame, and therefore subject to low X-ray statistics, regardless of its intrinsic brightness. The four X-ray EPIC-MOS observations (three in 2001 and one performed in Jul.17, 2005, see Table 3 for an analysis summary) do not show variations in the 0.2-10 keV photon index, while the 0.2-10 keV flux intensity varied by a factor of a few (in the range erg cm-2 s-1in 2001, comparable to the lower states observed by ASCA, and a mildly active state with erg cm-2 s-1in July 2005, Table 3).
| Obs. id. (date) | Best-fit Model and Parameters |
|---|---|
| ObsID 0070740101 | Power Law |
| (Jan 13, 2001, 09:20 UTC) | = 1.6 0.2 |
| =1.69/11 | |
| F erg cm-2 s-1 | |
| ObsID 0070740301 | Power Law |
| (Jan 14, 2001, 00:30 UTC) | = 1.7 0.2 |
| =1.27/17 | |
| F erg cm-2 s-1 | |
| ObsID 0112910201 | Power Law |
| (Jan 13, 2001, 04:58 UTC) | = 1.6 0.2 |
| =1.05/8 | |
| F erg cm-2 s-1 | |
| ObsID 0205340401 | Power Law |
| (Jul 17, 2005, 06:32 UTC) | = 1.69 0.08 |
| =0.99/58 | |
| F erg cm-2 s-1 |
PKS 1502+106 was also observed twice in the past with the Swift-XRT as a fill-in target (TargetID: 36388), showing a fainter X-ray flux (0.02 counts/sec) than the flux recorded in the August 2008 campaign observations (0.05 counts/sec).
4.3. Spitzer observations and the multifrequency behavior on Jul-Aug.2005
In the past, only upper limits in the far-/near-infrared bands by IRAS were available for PKS 1502+106 (Neugebauer et al., 1986, and Figures 9 and 11). PKS 1502+106 was observed serendipitously in the mid-infrared band for the first and only time by Spitzer on August 13, 2005, 09:10-09:18 UT (PID 117, AOR Request Key 5011456). The Infrared Spectrograph (IRS, Houck et al., 2004), low resolution (R=60-130) module, recorded the mid-IR spectrum from 5-14 m (shown in Fig.9 with the optical SDSS spectrum and near-IR photometric data point). High resolution IRS module spectra were also taken, but could not be used since there were no accompanying background observations. The Short-Low (SL) coadded 2D spectra were reduced using the standard Spitzer IRS pipeline (ver. S17.2).
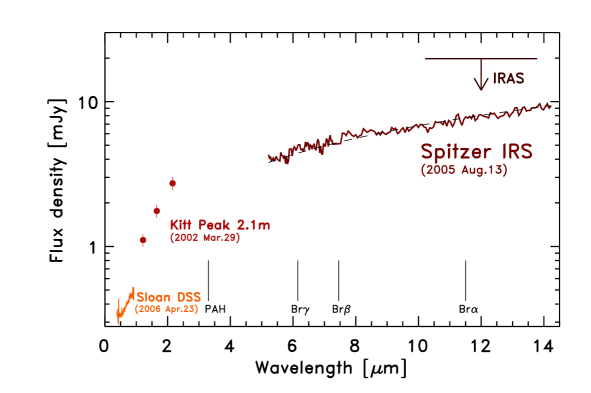
Background was subtracted using the two nod positions along the slit. The spectra were extracted and flux-calibrated with SPICE ver. 2.1.2, in a standard, expanding point-source aperture. The two spectral orders match well at 7 m, indicating a well-pointed observation. The mid-IR continuum of PKS 1502+106 rises to the near infrared and appears to be rather featureless, consistent with pure synchrotron emission (a power law in the 5-14 m range, Fig.9). The wave-like deviation of the data can be simply explained as wavelength-dependent spectrograph slit losses, while the red-shifted Brackett emission line series (like the 3.3 m PAH feature) falling in this wavelength range are indicated, but they are not well detected in the spectrum. This IRS spectrum is similar to other blazars which have been observed by Spitzer, including BL Lac and 3C 454.3 (Leipski et al., 2008; Ogle et al. et al., 2009), while the near IR (J,H,K) flux data from the Kitt Peak National Observatory (KPNO) 2.1m telescope Watanabe et al. (2004) reported in the same figure indicate a lower flux state and steeper H-KS (1.65-2.15 m), spectral index .
The July-August 2005 SED assembled with these XMM-Newton (July 17, 2005) and Spitzer (August 13, 2005) observations (joined with a couple of radio-optical observations in these two months by the Metsähovi, RATAN and Catalina observatories) is consistent with a low or mildly active stage that can be explained by a simple SSC model (inset plot in Fig.11). Based on these data there are therefore no hints for a deviation from a SSC scenario in this flat spectrum radio quasar. In any case, this SED cannot provide significant constraints, because it contains observations obtained over about two months and does not include any -ray data, aside from the older (1992) EGRET upper limit (calculated with the prescriptions in Thompson et al., 1996).
XMM-Newton observations pointed out an (0.2-10 keV) photon index that shown almost no variations, with values () in agreement with the previous X-ray observations performed by ROSAT and ASCA (George et al., 1994; Watanabe et al., 2004). The integrated X-ray flux F suggests a mildly active state during this observation, comparable to the Swift XRT spectrum observed in the days soon after the LAT outburst (red filled symbols, data points on Fig.11). More complicated and possibly more accurate emission models, beyond the SSC, can be therefore investigated for the first time only thanks to the Fermi multifrequency campaign of August 2008, whose SED is described in the next section. The Swift XRT simultaneous spectrum of Aug.2008 has a slightly harder spectrum with respect to these archival XMM-Newton observations while the XRT flux was about one order of magnitude greater than the flux observed in the past by XMM-Newton, ASCA and ROSAT.
5. Discussion
5.1. Gamma-ray outburst and longer-term variability
During the first several months of the LAT survey, PKS 1502+106 was one of the brightest, as well as the most luminous, blazar in the MeV–GeV band. The threefold flux increase in hours between Aug. 05 and Aug. 06, 2008 (DoY 218-219, Fig. 2) constrains the rest-frame size () of the flaring region: cm (where is the macroscopic Doppler factor, the bulk Lorentz factor and the angle of sight). The value is assumed from MOJAVE VLBA measurements (Lister et al., 2009b), where is the kinematic apparent jet speed in units of c. In this high speed regime an upper limit on the viewing angle can be also estimated: . This is consistent with an independent estimation of the Doppler factor based on the 37 GHz flux variability, made in Hovatta et al. (2009): a factor and , with brightness temperature ∘K, and angle of sight .
Assuming the “concordance” cosmology (Sect. 1 and ), the luminosity distance of PKS 1502+106 is Gpc, and the inferred, apparent and isotropic, monochromatic luminosity at MeV of PKS 1502+106 during the outburst phase is erg s-1,, where the average flux ph cm-2 s-1 in the outburst interval (DoY 2008: 218.95 - 224.0) is used. The bolometric luminosity is expected to be even higher than this value, since the measured LAT spectrum appears to be beyond the peak of the high energy component, and therefore this LAT blazar has probably one of the highest ratios ( erg s-2) known in the MeV-GeV regime.
Relativistic motion provides a solution for the problem of intrinsic excess absorption by pair-production in powerful -ray sources like PKS 1502+106 (see, e.g. Mattox et al., 1993; Madejski et al., 1996) which have a significant . Adopting the flux tripling time scale of the outburst rise (i.e. hours), and the outburst state averaged X-ray flux (F, Table 2) at the observed photon frequency Hz, the minimum Doppler factor required for the photon-photon annihilation optical depth to be can be estimated. Using the derived relation and taking the region size , the source-frame photon energy and the intrinsic X-ray luminosity we obtain (omitting the requirement of co-spatiality of the X-ray and -ray emission regions relaxes this limit). This is in agreement with the values found from radio flux-structure observations and with the SED modeling parameters found.
The asymmetry of the August 5–6 -ray outburst can suggest a more complex emission geometry than a simple one-zone model. The temporal structure — day rise, followed by a day decay where a day intermediate-level plateau is likely observed — implies particle acceleration and cooling times that are greater than the light crossing time, i.e., , where these quantities are evaluated in the jet comoving frame. A synchrotron self-Compton (SSC) emitting blob in the jet should be relatively confined ( pc), although relativistic beaming would permit the region to be as much as an order of magnitude larger. The hinted intermediate plateau could mark a twofold active region, and two SSC emitting components. Descriptions making use of a multi-zone SSC or multi-emission component SSC (second order, superquadratic components) are reported, for example, in Sokolov & Marscher (2005); Georganopoulos et al. (2006); Graff et al. (2008). On the other hand, if the injection of relativistic electrons is impulsive and repeated, some single-zone SSC models already predict plateaus during an outburst (see e.g., Chiaberge & Ghisellini, 1999; Böttcher & Chiang, 2002; Sokolov et al., 2004). At lower frequencies (IR-optical-UV), where cooling times are longer, the electron distributions corresponding to different injections can build up, and the memory of the individual injection phases can be lost, providing a smoother decay without intermediate plateaus (as shown in X-ray, optical-UV light curves by Swift, Fig. 4). Apparent delays (like the 4-day lag hinted by UVOT data) can also be explained within this scenario.
On the other hand this asymmetric (fast rise, slower decay) shape of the -ray outburst can be also an evidence for a dominant contribution by Comptonization of photons produced outside the jet (Sect. 5.3 and 5.4) during this event, as predicted for example in Sikora et al. (2001). Gamma-ray flares produced by short-lasting energetic electron injections and at larger jet opening angles are predicted to be more asymmetric showing much faster increase than decay, the latter determined by the light travel time effects.
The “harder when brighter” trend of the gamma-ray photon index during the outburst (right inset panel of Fig. 2), hints a narrow hysteresis evolution of the spectral index against the flux, a signature produced by non-thermal cooling and high to low energy propagation of the electron injection rate (Kirk et al., 1998; Georganopoulos & Marscher, 1998; Böttcher & Chiang, 2002). The photon index extracted with a power-law model over the daily bins, was found quite scattered irrespective of the flux level in the remain part of the light curve following the outburst.
The outburst of Aug. 2008 appeared to have ignited an enduring relaxing state of -ray brightness and activity, during the following four months (Sections 2.3 and 5.1). The (with ) PSD points out a general fluctuation mode placed between a pink-noise (flickering) and a random-walk, (Brownian motion or brown noise), staggered by some rapid flares, similar to the long-term variability of blazars observed in radio and optical wavebands (for example, Hughes et al., 1992; Ciaramella et al., 2004; Teräsranta et al., 2005; Ciprini et al., 2007b; Hovatta et al., 2007). In contrast, this variability mode is rather different than the full Brownian regime shown by the short-term (intra-hour resolution) light curve of the large TeV outburst of PKS 2155-304 (Aharonian et al., 2007). This PSD indicates the occurrence frequency of a specific variation is inversely proportional to its strength, as found in processes driven by stochastic relaxation, and rapid flares/outbursts (phenomenologically called intermittence), are not occasional events produced by physical processes of different nature with respect to the mechanism responsible for the long-term flickering, but can be considered as statistical tails of the same dynamic process, possibly connected to disk or jet instabilities, to viscosity and magnetic turbulence, or to inhomogeneities and shocks (for example Begelman et al., 1984). Even in the case of quite nonhomogeneous structures, the jet is seen under a small viewing angle ( here), therefore flaring events and variability trends are the result of emission components originating from different regions, excluding, in most cases, causality.
5.2. Gamma-ray and radio connection
The absence of significant radio 15 GHz and 37 GHz variability before, during and immediately after the LAT outburst (Fig. 6), and strictly correlated to the near-IR to -ray outburst, has consequences for opacity at lower radio frequencies. However, the beginning of the strong radio flare seen in the Oct.-Dec. 2008 data of Fig. 6 and Fig. 7, could be associated with the period of increased -ray activity seen after DoY 330 (Nov. 25, 2008, Fig. 2). If the beginning of the radio outburst in Fig. 6 is associated with the LAT outburst, this would imply a delay of more than about 98 days (Sect. 3.3), meaning that the radio emission region becomes transparent at the cm and longer wavelengths significantly after the outburst seen at wavelengths where the source is truly optically thin (mm, IR, optical bands).
The rotation direction of the electric vector position angle (EVPA) in the milliarcsecond-scale core of PKS 1502+106 between 2007 and 2008 was a possible precursor signature of an outburst that occurred in the core (Fig.8). The electric polarization vectors appear well aligned to jet axis in the June 25, 2008 map and even more in the Aug. 06, 2008 map. This latter map represents an unprecedented example of radio-structure snapshot truly simultaneous to the peak of a MeV-GeV outburst (Fig.8). About 3 months after the outburst, on Nov. 11, 2008, the alignment is again decreasing. These interesting findings are in agreement with the scenario that assumes very bright -ray flares occurring after the ejections of superluminal radio knots, with accompanying increases in polarized radio flux, and a field ordering and alignment with respect to the jet axis. A correspondence between variations in polarization direction and intensity in different bands at parsec scales can help localize the primary site of the high energy emission. We found that the prominent -ray outburst and the possible 3-month delayed radio-outburst are likely produced in the core of the parsec-scale jet of PKS 1502+106. More details on connections between VLBI radio structures and high energy emission, and their interpretation are reported recently in Jorstad et al. (2007); d’Arcangelo et al. (2007); Marscher et al. (2008); Kovalev et al. (2009). To test if this is indeed the case for the discussed gamma-ray flare, VLBA monitoring of 1502+106 is continued at 15 and 43 GHz.
5.3. Gamma-ray, X-ray and UV-optical cross correlations
During the EGRET era a similar degree of simultaneous X-ray and -ray monitoring was achieved, for instance, for the blazar 3C 279 (Wehrle et al., 1998; Hartman et al., 2001), a typical -ray powerful FSRQ resembling PKS 1502+106. The correlation found in PKS 1502+106 between the -ray flux and the X-ray and UV-optical emission during the 16-days of Swift follow up, is evidenced by the multi-panel and multifrequency light curves in Fig. 4. The apparent linear correlation between the emission in the LAT band and the X-rays (Fig. 10, left panel) suggests that the observed X-ray and MeV-GeV photons may be part of a single SSC component (continuous line, labeled “SSC2”, on Fig.11). This could also explain the nearly constant X-ray (0.3-10 keV) spectral index observed during the outburst with respect to the post-flare phase.
The -ray peak power observed during the outburst was erg s-1 , and decreased to less than about erg s-1 in the post-flare period, meaning a difference of at least a factor of (Fig. 11). The difference between these two emission states in X-ray output was instead a factor of , and a factor of in the optical-UV band (frequencies above the synchrotron peak). These sub-quadratic differences between the outburst and the subsequent state could be still described by SSC descriptions. The strict correlation between the X-ray flare and the -ray outburst supports, at least, the dominance in the SED (Fig.11) of the SSC, in-jet, emission from radio to X-ray bands in agreement with results detailed in Sikora et al. (2001). A simple single-zone SSC model has nevertheless problems explaining and reproducing the large -ray dominance observed during the outburst, and could require very sub-equipartition magnetic fields.
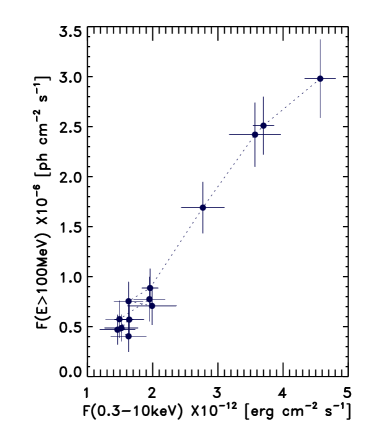
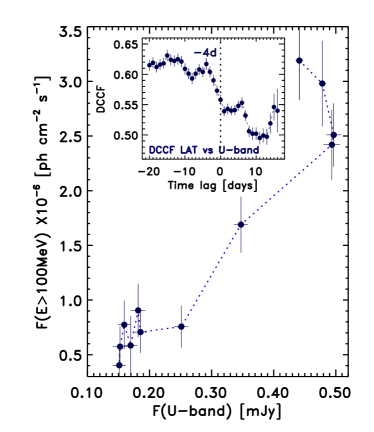
Fig. 4 and the right panel of Fig. 10 show the flux monitored by UVOT (U-band reported there, but similar results are found in the other 5 filters), indicating the same strong correlation with respect to -rays, but with a possible time lag of about 4 days (also hinted at by the peak on the discrete cross-correlation function, DCCF, inset plot). This possible time lag can be reasonable only by assuming that the optical-UV brightness during the start and rise of the gamma-ray outburst (i.e. during DoY 216-219) was comparable or lower than the flux observed during the first UVOT observation (performed on DoY 220.8). Relative delays between the synchrotron (our Swift UVOT data) and the inverse Compton (our Swift XRT and Fermi LAT data) counterparts, are dominated by energy stratification and geometry of the emitting region. In SSC-dominated zones the synchrotron emission is co-located with the inverse-Compton production site, and such 4-day optical-UV to -ray lag would depend on light-travel time effects in the the emitting region (characterized by size and viewing angle ), and by the particle cooling time and decay time of the synchrotron and inverse Compton (IC) emissions. When the region is not so compact, both decay times can be comparable to the apparent light crossing time , and significant shifts between light curves at these different energy bands are expected. Synchrotron flares (our optical-UV data) can be delayed with respect to the IC -ray flares (e.g. Chiaberge & Ghisellini, 1999; Sokolov et al., 2004). Rather long time lags such as this could also be explained by a prolonged disturbance traveling down the jet. The disturbance, being radially inhomogeneous in both density and velocity, could induce shocks and collisions leading to the formation of two adjacent emission zones with similar properties (multi-zone SSC), thus explaining the flare shape asymmetry and the intermediate-level plateau during the decay (Section 5.1).
Unlike SSC emission, outbursts dominated by inverse Compton external radiation involve a constant field of seed photons, and are not delayed by light-travel time of photons. The resulting frequency stratification behind the shock front could extinguish an outburst first at the highest energies, then progressing to lower frequencies as time advances (Sokolov & Marscher, 2005), and energy-dependent radiative losses induce delays in the declining part of the emission produced by the lower energy particles. The variability patterns shown by our data could rule out radiative cooling as the only mechanism for causing the delay, since the rising part of the optical emission follows the rising part of the -rays. In addition, the decay time scale in the UVOT data seems comparable to that seen in the LAT, and not longer as required by energy-dependent dominated cooling. A reasonable mixture of SSC and an extra-contribution by Comptonization of the BLR photon field (external jet origin) by the same population of energetic electrons (ERC, e.g. Sikora et al., 1994, 2001; Dermer & Schlickeiser, 2002; Ghisellini & Tavecchio, 2009a) could be more adequate to explain also the SED, and such SSC+ERC scenario is still compatible with the X-ray to -ray correlation found in PKS 1502+106.
As seen in Section 3.2, the first of the fast, minor -ray flares occurring in Sept. 2008 (DoY 248-251) after the big outburst, was well observed by the Kanata-TRISPEC telescope in both and bands, with no significant time lag. The lower intensity and duration of the flare, the limited temporal resolution of the data, and a possible dominance of the SSC process during this episode can explain this difference with respect to August’s big outburst. The match between the MeV-GeV and optical-near-IR flare, was also crucial for the firm identification with PKS 1502+106 (Sect. 2.2), and was a reasonable confirmation of the source-intrinsic nature of this variation seen in the LAT light curve (Fig. 2 and Fig. 4). These and flux measurements, obtained after the conclusion of the outburst phase but on a period longer than the Swift monitoring (Fig. 4), appear well correlated, though the color was less pronounced than the multi-band near-IR colors reported in Watanabe et al. (2004) and Fig. 9, while the degree of optical polarization remained almost constant.
5.4. Spectral energy distribution
Variability is a powerful diagnostic to investigate blazar physics, but represents also a supplementary problem for the analysis of broad band spectral energy distributions (SED), where model constraints are provided by simultaneous and well time-resolved multifrequency data. In the previous section we indicated that dominant synchrotron and SSC (in-jet) mechanisms can explain the radio-to-X-ray emission and correlations, whereas the origin of the high-power MeV-GeV bolometric emission could be better constrained by external Comptonization of the radiation from the broad line region (BLR), as invoked by (Ghisellini et al., 2009b), and found already in similar FSRQs of the EGRET era (e.g., Sokolov & Marscher, 2005; Sikora et al., 2008, 2009). The featureless mid-IR continuum observed by Spitzer-IRS in 2005 (Fig. 9), supports the hypothesis of a prominent synchrotron emission by the jet, controlling the lower energy component. It could also reflect the lack of detectable ambient dust radiation, thereby supporting the idea that the ERC dissipation occurred within the BLR for this LAT outburst, in agreement with prescriptions of (Sikora et al., 2002).
PKS 1502+106 might be considered a blazar peaked at the border of the MeV and GeV bands (a peak around 0.4-0.5 GeV is suggested by the curved model fit of the 4-month spectrum, Section 2.4). In other words, PKS 1502+106 is likely at the border of the family of BLR-dissipated FSRQs and circum-nuclear ambient/torus dust-dissipated FSRQs, with an important SSC power output from radio-to-X-ray bands (Section 5.3), as depicted by the multiband correlations, the absence of hints for a bulk Compton feature produced by cold, adiabatically cooling electrons (as observed in PKS 1510-089, Kataoka et al., 2008; Abdo et al., 2009f), the lack of evidence for a blue bump.
The medium or high black hole mass of this blazar (likely in the range M☉, as calculated by D’Elia et al., 2003; Liu et al., 2006, respectively) could connote a BLR radiation field and inverse Compton dissipation moderately stronger than the magnetic energy density and the SSC luminosity in the gamma-rays, as reported in Fig. 11. The estimated accretion rate is 2 M☉ yr-1 (D’Elia et al., 2003). In this case we have where and are the electromagnetic energy density in the BLR and the magnetic field energy density in the jet blob, respectively. With a M☉ mass the Schwarzschild radius of the supermassive black hole is cm. The bolometric luminosity of the BLR in PKS 1502+106, evinced by the MgII emission line profile, is erg s-1 (Liu et al., 2006), implying that the BLR is located at a radius cm. We can expect relatively smaller magnetic fields in the dissipation region and an ERC, external-jet process that is the dominant cooling mechanism when the source is in a high -ray state, as suggested in Section 5.1. In fact a SSC-only model would require a magnetic field in very sub-equipartition conditions, even if only the BLR fraction lying within the varying region’s beaming cone could contribute to gamma-rays. The simultaneous SED corresponding to the outburst state reported in Fig. 11 corroborates the possible needs for an ERC contribution, showing a large () gamma-ray dominance over the synchrotron component. The SSC+ERC model can be considered in some way in agreement with the redshift value of this blazar, if we assume the FSRQs BL Lacs cosmological evolutionary scenario with dimming jet power, possibly related to star formation rate or the the far-IR/submillimeter luminosity density (Dermer, 2007).
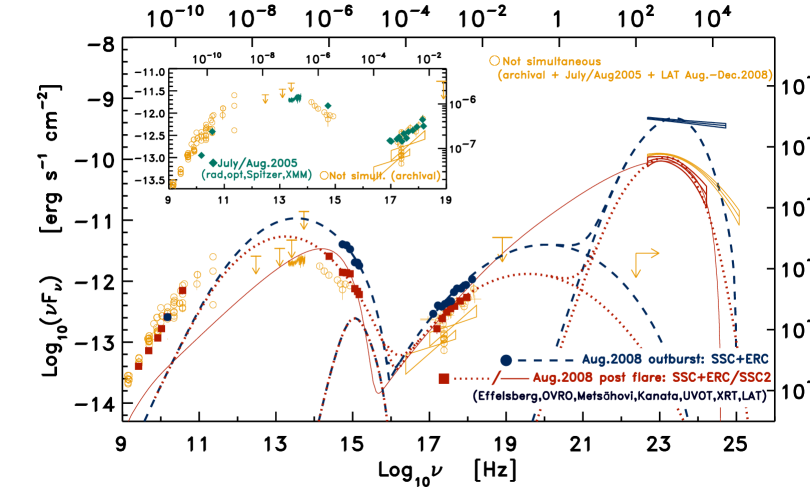
In Fig. 11 we report the data of the two SED states (the “outburst state” of Aug. 05-10, 2008 (blue points) and the “post-flare” state (red points), characterized by a intermediate luminosity, of Aug. 11-22, 2008 (both intervals are outlined in Fig. 2), in conjunction with the unpublished archival and literature data collected for comparison. Above the two simultaneous SEDs of Aug. 2008, SSC and ERC “strawman” models are reported for each state (SSC+ERC modeling, blue lines for the outburst period, and SSC+ERC plus a SSC-stand-alone modeling, red lines, both for the post-flare period).
The pure SSC stand-alone model for the post-flare state (indicated in Fig. 11 as a version 2 of the first order SSC modeling with the label “SSC2”, continuous red line, spanning from radio to gamma-ray bands) implements the temporal evolution of the synchrotron and SSC spectral components in a single flaring blob within the jet, where a population of accelerated electrons having a power-law with exponential cutoff distribution (), is instantly injected (for more details on the analytical and numerical model see, for example, Ciprini, 2008). This form for is plausible in presence of time-dependent acceleration or radiative-loss limits (Webb et al., 1984; Drury, 1991). The post-flare (lower) state is reproduced by setting the electron energy index , minimal and maximal electron Lorentz factors , , compactness injected , radius of the emitting region in the comoving frame cm, a bulk Doppler factor and magnetic field intensity G. If the X-ray spectrum is produced by electrons that cool on timescales longer than the light crossing time, , the X-ray spectral index would be , a value quite similar to the averaged value () measured by Swift XRT for the post-flare interval (bottom segment of Table 2). The rather large size of the emitting region (pc) and the very sub-equipartition magnetic field and reduced suggested by this “SSC2” (stand-alone and first order radio-to-gamma-ray SSC) model attempt indicate that even for this lower brightness state, an ERC contribution can be reasonable. Furthermore, the value of the optical-UV spectral index for this post-flare state () is softer than the averaged index (3/2) expected (Chiang & Böttcher, 2002), when a totally SSC-dominated loss is considered. The huge Compton dominance of the outburst state might preclude a first order SSC-stand-alone model attempt for such SED state. On the other hand for high-energy -ray loud blazars like PKS 1502+106 superquadratic variations produced by higher order scatters in SSC are predicted by other models (Georganopoulos et al., 2006; Perlman et al., 2008) and Section 5.1, in fact in luminous blazars, the optical depth to Compton scattering (related to particle density) increases and second and higher-order scatters become more important. In more Compton-dominated objects these scattering reactions can dominate the energy output from the SSC process, and can produce superquadratic behaviors during big flares.
As mentioned above a “SSC plus ERC” model description, joining a SSC radio-to-X-ray component and a ERC gamma-ray component, to both the post-flare and outburst states (Fig.11, dashed blue and red dotted lines) is plausible as well for these SEDs. The description of an initial version of this composite modeling, implementing the prescriptions of Sikora et al. (1994); Dermer & Schlickeiser (2002), can be found, for example, in Tramacere & Tosti (2003). The low state is described with the following “SSC+ERC” parameters G, blob size cm, , a log-parabola electron injection function between and , , , ∘K and distance from the disk of cm. The outburst state is described with the following “SSC+ERC” parameters G, blob size cm, , a log-parabola electron injection function between and , , , ∘K and distance from the disk of cm.
In Fig. 11, the LAT averaged spectrum (E200 MeV) of the entire Aug.-Dec. 2008 period considered (characterized by high statistics and consistent with an intrinsically curved shape described by a log-parabola model) is reported as well (the strip in the same orange color used for non-simultaneous data). Log-parabola curvature (Section 2.4) at high energy can be produced by several plausible models. For example by radiative particle cooling and stochastic acceleration processes driven by magnetic turbulence (rather than systematic particle acceleration) acting near the shock front (Stawarz & Petrosian, 2008). If the energy where losses balance the acceleration rate if the acceleration time decreases more slowly than the loss time. The probability of energetic gain is lower when particle energy increases, because particles are confined by a magnetic field with a confinement efficiency decreasing for an increasing gyration radius. The integral energy distribution of the accelerated particles results in a log-parabolic law: , where is a curvature term (Landau et al., 1986; Fossati et al., 2000; Massaro et al., 2004; Perlman et al., 2005; Tramacere et al., 2007). Non-power law radiation spectra could also originate in a non-linear regime, such as in the presence of shock modifications, precursors, and when diffusion coefficients vary with particle momentum (Amato et al., 2008). Another explanation takes into account episodic particle acceleration, that is applicable to high-energy flares with intrinsic spectral curvature (Perlman et al., 2005; Perlman & Wilson, 2005). The filling factor of the regions within which particles are accelerated is a function of both position and energy. If the light-crossing time of the emission region or the integration time of observations is greater than the characteristic particle acceleration time, we effectively observe an electron distribution which is the product of a power law multiplied by a logarithmic term producing a spectral curvature.
Another contribution to such deviations might also be the averaging over long periods of time, hence combining variability effects, resulting in a cumulation of photons from different activity “flavors” (different source brightness and spectral hardness) being included in the evaluation of the spectrum. In the case of PKS 1502+106, the same spectral curved shape was also preferred for the much shorter, post-flare, interval, while the whole period includes many photons and covers a wider energy range (photons observed from the source have energies up to 15.8 GeV). PKS 1502+106, and 3C 454.3 (Abdo et al., 2009a) for the first time show this departure from a simple power law, while EGRET observed only simple power laws, probably due to its lower high-energy observational limit. The maximum peak observed in the LP models of PKS 1502+106 (in the representation) are around energies of about 390 MeV for the whole period and 480 MeV for the post-flare period. These peaks are consistent with a sub-GeV FSRQ blazar class.
From Sect. 5.1 we remember that the inferred, apparent and isotropic, monochromatic luminosity at MeV during the outburst phase (DoY 2008: 218.95 - 224.0) is erg s-1, and the bolometric luminosity is expected to be even higher than this value, making PKS 1502+106 one of the most powerful and luminous high-energy blazars observed during the first year the Fermi LAT all-sky survey. On the other hand The highest energy of photons detected from the source during the first four months of survey (15.8 GeV, assuming a strict PSF size criterium), has marginal consequences for extragalactic background light (EBL) predictions. The optical depth for pair production of 16 GeV photons propagating through the EBL from a redshift source to Earth approaches unity for rather high-density EBL models (e.g, Stecker et al., 2006, ), while most low density EBL models predict rather small interaction probabilities at such energies. An in-depth exploration of this finding will be presented elsewhere (Abdo et al., 2009g).
6. Final remarks
This was the first time that PKS 1502+106, a distant radio- and X-ray-selected FSRQ, has been announced to have observable high-energy gamma-ray emission above 100 MeV. Fermi LAT as basically a sort of all-space, -time, and -energy monitor allowed an excellent spatial localization of this new -ray source (Section 2.2 and Fig.1, with a firm identification thanks to the optical--ray match of the outburst and, remarkably, also of a second flare). It allowed detailed analysis of the energy spectrum (Section 2.4 and Fig. 11, demonstrating the possibility for an intrinsic spectral curvature in -rays), and was able to provide regular, daily monitoring flux light curve (Section 2.3 2). This has made possible the discovery of consistent -ray brightness and activity ignited by the big outburst over the following 4 months (pointing out a variability behavior), the discovery of further minor and rapid flares, and the disclosure of the outburst’s temporal shape. This type of “PSD-SED” monitoring performed by the LAT yielded advantage in developing the first unplanned Fermi multifrequency campaign, with a strategic 16 days of simultaneous Fermi-Swift monitoring.
PKS 1502+106 is a powerful gamma-ray ( erg s-1 at MeV) FSRQ that showed, especially during the fast-rising outburst, a dominant MeV-GeV bolometric emission similar to other FSRQs of the EGRET era. Dissipation probably occurred within the BLR, and, assuming for a black hole mass of M☉, the -ray emission was likely dominated by the ERC process. The SSC, in-jet, emission appears to dominate the observed SED from radio to X-rays bands. PKS 1502+106 might be considered an example of a sub-GeV peaked blazar, placed at the border of the BLR dissipated and the dusty torus/ambient-radiation dissipated FSRQs classes. The level of correlation found among the -ray, X-ray and optical-UV outburst and post-flare relaxing phases, support this idea. Opacity effects at cm and longer radio wavelengths, possible links between field ordering, jet-axis alignment, superluminal radio knots, and MeV-GeV outburst, are also depicted by our results.
In conclusion, the Fermi LAT performance in blazar science (as a stand alone observatory, or leading instrument for multifrequency campaigns), and the synergy between Fermi and Swift in particular, is evidenced by this work on PKS 1502+106. By itself, this blazar is emerging as a major, luminous, energetic and -ray variable source, with promising diagnostic and discovery potential in emission modeling, in spectral and temporal variability studies, and in understanding the radio-gamma-ray connection.
7. Acknowledgments
This research is based on observations obtained with the Fermi Gamma-ray Space Telescope. The Fermi LAT Collaboration acknowledges generous ongoing support from a number of agencies and institutes that have supported both the development and the operation of the LAT as well as scientific data analysis. These include the National Aeronautics and Space Administration and the Department of Energy in the United States, the Commissariat à l’Energie Atomique and the Centre National de la Recherche Scientifique / Institut National de Physique Nucléaire et de Physique des Particules in France, the Agenzia Spaziale Italiana (ASI) and the Istituto Nazionale di Fisica Nucleare (INFN) in Italy, the Ministry of Education, Culture, Sports, Science and Technology (MEXT), High Energy Accelerator Research Organization (KEK) and Japan Aerospace Exploration Agency (JAXA) in Japan, and the K. A. Wallenberg Foundation, the Swedish Research Council and the Swedish National Space Board in Sweden.
Additional support for science analysis during the operations phase is gratefully acknowledged from the Istituto Nazionale di Astrofisica (INAF) in Italy and the Centre National d’Études Spatiales in France.
SC acknowledges funding by grant ASI-INAF n.I/047/8/0 related to Fermi on-orbit activities.
This research has made use of the NASA/IPAC NED database (JPL CalTech and NASA, USA), the HEASARC database (LHEA NASA/GSFC and SAO, USA), the Smithsonian/NASA’s ADS bibliographic databases, and the SIMBAD database (CDS, Strasbourg, France). This work includes observations obtained with the NASA Swift gamma-ray burst Explorer. This work includes observations obtained with the Spitzer Space Telescope (operated by the Jet Propulsion Laboratory, California Institute of Technology under a contract with NASA). This work includes observations obtained with XMM-Newton, an ESA science mission with instruments and contributions directly funded by ESA Member States and NASA. This work has made use of observations obtained with Owens Valley Radio Observatory. The monitoring program at the OVRO is supported by NASA award NNX08AW31G, and NSF award# AST-0808050. This research has made use of observations from the MOJAVE database that is maintained by the MOJAVE team. The MOJAVE project is supported under National Science Foundation grant 0807860-AST and NASA-Fermi grant NNX08AV67G. The National Radio Astronomy Observatory (NRAO VLBA) is a facility of the National Science Foundation operated under cooperative agreement by Associated Universities, Inc. This research has made use of observations obtained with the 100-m telescope of the MPIfR (Max-Planck-Institut für Radioastronomie) at Effelsberg, Germany. This research has made use of observations from the RATAN–600 that is partly supported by the Russian Foundation for Basic Research (projects 01-02-16812, 05-02-17377, 08-02-00545). This work has made use of observations obtained with the 14m Metsähovi Radio Observatory, a separate research institute of the Helsinki University of Technology. The Metsähovi team acknowledges the support from the Academy of Finland. This work has made use of observations obtained with the TRISPEC instrument on the Kanata telescope that is operated by Hiroshima University, Japan. YYK is a Research Fellow of the Alexander von Humboldt Foundation.
The LAT team and multifrequency collaboration extend thanks to the anonymous referee who
made very useful comments.
Facilities: Fermi LAT.
References
- Abdo et al. (2009a) Abdo, A. A., et al., 2009a, ApJ, 699, 817
- Abdo et al. (2009b) Abdo, A. A., et al., 2009b, ApJ, 700, 597
- Abdo et al. (2009c) Abdo, A. A., et al., 2009c, ApJS, 183, 46
- Abdo et al. (2009d) Abdo, A. A., et al., 2009d, ApJ, submitted, (AGN variability)
- Abdo et al. (2009e) Abdo, A. A., et al., 2009e, ApJ, 697, 934
- Abdo et al. (2009f) Abdo, A. A., et al., 2009f, ApJ, submitted, (PKS 1510-089)
- Abdo et al. (2009g) Abdo, A. A., et al., 2009g, ApJ, in prep. (EBL study)
- Abdo et al. (2009h) Abdo, A. A., et al., 2009h, Atropart. Physics, 32, 193
- Aharonian et al. (2007) Aharonian, F., et al. 2007, ApJ, 664, L71
- Akiyama et al. (2003) Akiyama, M., Ueda, Y., Ohta, K., Takahashi, T., & Yamada, T. 2003, ApJS, 148, 275
- Aller et al. (1999) Aller, M. F., Aller, H. D., Hughes, P. A., & Latimer, G. E. 1999, ApJ, 512, 601
- Amato et al. (2008) Amato, E., Blasi, P., & Gabici, S. 2008, MNRAS, 385, 1946
- An et al. (2004) An, T., Hong, X. Y., Venturi, T., Jiang, D. R., & Wang, W. H. 2004, A&A, 421, 839
- Angelakis et al. (2008) Angelakis, E., Fuhrmann, L., Marchili, N., Krichbaum, T. P., & Zensus, J. A. 2008, Memorie SAIt, 79, 1042
- Argue & Sullivan (1980) Argue, A. N., & Sullivan, C. 1980, The Observatory, 100, 152
- Atwood et al. (2009) Atwood, W. B., et al., 2009, ApJ, 697, 1071
- Atwood et al. (2007) Atwood, W. B., Bagagli, R., Baldini, L., et al. 2007, Astropart. Phys., 28, 422
- Baars al. (1977) Baars, J. W. M., Genzel, R. Pauliny-Toth, I. I. K., Witzel, A., 1977, A&A, 61, 99
- Begelman et al. (1984) Begelman, M. C., Blandford, R. D., & Rees, M. J. 1984, Reviews of Modern Physics, 56, 255
- Bellazzini et al. (2002) Bellazzini, R., et al. 2002, Nucl. Phys. B Proc. Sup. 113, 303
- Bertin & Arnouts (1996) Bertin, E., & Arnouts, S. 1996, A&AS, 117, 393
- Blake (1970) Blake, G. M. 1970, Astrophys. Lett., 6, 201
- Burbidge & Strittmatter (1972) Burbidge, E. M., & Strittmatter, P. A. 1972, ApJ, 174, L57
- Burnett (2007) Burnett, T. H. 2007, AIP Conf. Proc., 921, 530
- Böttcher & Chiang (2002) Böttcher, M., & Chiang, J. 2002, ApJ, 581, 127
- Camilo et al. (2009) Camilo, F., Ray, P. S., Ransom, S. M. et al. 2009, ApJ, 705, 1
- Casandjian & Grenier (2008) Casandjian, J.-M., & Grenier, I. A. 2008, A&A, 489, 849
- Cecchi et al. (2007) Cecchi, C., Germani, S., Pepe, M., et al. 2007, AIP Conf. Proc., 921, 540
- Chiaberge & Ghisellini (1999) Chiaberge, M., & Ghisellini, G. 1999, MNRAS, 306, 551
- Chiang et al. (2007) Chiang, J., Carson, J., & Focke, W. 2007, AIP Conf. Proc., 921, 544
- Chiang et al. (2006) Chiang, J., Digel, S., Silva, E. D. C. E., & Reimer, O. 2006, Bull. American Astron. Soc., 38, 382
- Chiang & Böttcher (2002) Chiang, J., Böttcher, M. 2002, ApJ, 564, 92
- Ciaramella et al. (2004) Ciaramella, A., Bongardo, C., Aller, H.D. et al. 2004, A&A, 419, 485
- Ciprini (2008) Ciprini, S. 2008, in proc. of Blazar Variability across the Electromagnetic Spectrum, PoS(BLAZARS2008), n.073
- Ciprini et al. (2007a) Ciprini, S., Tosti, G., Marcucci, F. et al. 2007a, AIP Conf. Proc., 921, 546
- Ciprini et al. (2007b) Ciprini, S., Takalo, L. O., Tosti, G., et al. 2007b, A&A, 467, 465
- Cooper et al. (2007) Cooper, N. J., Lister, M. L., & Kochanczyk, M. D. 2007, ApJS, 171, 376
- Crowther & Clarke (1966) Crowther, J. H., & Clarke, R. W. 1966, MNRAS, 132, 405
- Damiani et al. (1997) Damiani, F., Maggio, A., Micela, G., & Sciortino, S. 1997, ApJ, 483, 350
- d’Arcangelo et al. (2007) d’Arcangelo, et al. 2007, ApJ, 659, L107
- Day et al. (1966) Day, G. A., Shimmins, A. J., Ekers, R. D., & Cole, D. J. 1966, Australian Journ. Phys., 19, 35
- D’Elia et al. (2003) D’Elia, V., Padovani, P., & Landt, H. 2003, MNRAS, 339, 1081
- Dermer & Schlickeiser (2002) Dermer, C. D., & Schlickeiser, R. 2002, ApJ, 575, 667
- Dermer (2007) Dermer, C. D. 2007, ApJ, 659, 958
- Drury (1991) Drury, L. O. 1991, MNRAS, 251, 340
- Fichtel et al. (1994) Fichtel, C. E., Bertsch, D. L., Chiang, J., et al. 1994, ApJS, 94, 551
- Fitch et al. (1969) Fitch, L. T., Dixon, R. S., & Kraus, J. D. 1969, AJ, 74, 612
- Foschini et al. (2006) Foschini L., Ghisellini G., Raiteri C.M., et al., 2006, A&A453, 829
- Fossati et al. (2000) Fossati, G., Celotti, A., Chiaberge, M., et al. 2000, ApJ, 541, 166
- Franceschini et al. (2008) Franceschini, A., Rodighiero, G., & Vaccari, M. 2008, A&A, 487, 837
- Fuhrmann et al. (2007) Fuhrmann, L., Zensus, J. A., Krichbaum, T. P., Angelakis, E., & Readhead, A. C. S. 2007, AIP Conf. Proc., 921, 249
- Fuhrmann et al. (2008) Fuhrmann, L., Krichbaum, T. P., Witzel, A. et al. 2008, A&A, 490, 1019
- Gehrels et al. (2004) Gehrels, N., et al. 2004, ApJ, 611, 1005
- George et al. (1994) George, I. M., Nandra, K., Turner, T. J., & Celotti, A. 1994, ApJ, 436, L59
- Georganopoulos et al. (2006) Georganopoulos, M., Perlman, E. S., Kazanas, D., & Wingert, B. 2006, AIP Conf. Proc., 350, 178
- Georganopoulos & Marscher (1998) Georganopoulos, M., & Marscher, A. P. 1998, ApJ, 506, L11
- Ghisellini & Tavecchio (2009a) Ghisellini, G., & Tavecchio, F. 2009a, MNRAS, 397, 985
- Ghisellini et al. (2009b) Ghisellini, G., Tavecchio, F., & Ghirlanda, G. 2009b, accepted, arXiv:0906.2195
- Graff et al. (2008) Graff, P. B., Georganopoulos, M., Perlman, E. S., & Kazanas, D. 2008, ApJ, 689, 68
- Hartman et al. (2001) Hartman, R. C., Böttcher, M., Aldering, G., et al. 2001, ApJ, 553, 683
- Hartman et al. (1999) Hartman, R. C., Bertsch, D. L., Bloom, S. D., et al. 1999, ApJS, 123, 79
- Healey et al. (2008) Healey, S. E., Romani, R. W., Cotter, G., Michelson, P. F., Schlafly, E. F., Readhead, A. C. S., Giommi, P., Chaty, S., Grenier, I. A.; & Weintraub, L. C. 2008, ApJS, 175, 97
- Houck et al. (2004) Houck, J. R., et al. 2004, ApJS, 154, 18
- Hovatta et al. (2009) Hovatta, T., Valtaoja, E., Tornikoski, M., Lähteenmäki, A. 2009, A&A, 494, 527
- Hovatta et al. (2007) Hovatta, T., Tornikoski, M., Lainela, M., Lehto, H. J., Valtaoja, E., Torniainen, I., Aller, M. F., & Aller, H. D. 2007, A&A, 469, 899
- Hughes et al. (1992) Hughes, P. A., Aller, H. D., & Aller, M. F. 1992, ApJ, 396, 469
- Inoue & Takahara (1996) Inoue, S., & Takahara, F. 1996, ApJ, 463, 555
- Jorstad et al. (2007) Jorstad, S. et al. 2007, AJ, 134,
- Kataoka et al. (2008) Kataoka, J., Madejski, G., Sikora, M., et al. 2008, ApJ, 672, 787
- Kellermann et al. (2004) Kellermann K. I., Lister M. L., Homan D. C., et al., 2004, ApJ, 609, 539
- Kirk et al. (1998) Kirk, J. G., Rieger, F. M., Mastichiadis, A. 1998, A&A, 333, 452
- Komatsu et al. (2009) Komatsu, E., Dunkley, J., Nolta, M. R., et al. 2009, ApJS, 180, 330
- Kovalev et al. (2009) Kovalev, Y. Y., Aller, H. D., Aller, M. F., et al. 2009, ApJ, 696, L17
- Kovalev et al. (2005) Kovalev, Y. Y., Kellermann, K. I., Lister, M. L., et al. 2005, AJ, 130, 2473
- Kovalev et al. (1999) Kovalev, Y. Y., Nizhelsky, N. A., Kovalev, Yu. A., Berlin, A. B., Zhekanis, G. V., Mingaliev, M. G., & Bogdantsov, A. V. 1999, A&AS, 139, 545
- Korolkov & Parijskij (1979) Korolkov, D. V., & Parijskij, Yu. N. 1979, Sky Telesc., 57, 324
- Landau et al. (1986) Landau, R., et al. 1986, ApJ, 308, 78
- Leipski et al. (2008) Leipski et al. 2009, ApJ, 701, 891
- Lister et al. (2009a) Lister M. L., Aller, H. D., Aller, M. F., 2009, AJ, 137, 3718
- Lister et al. (2009b) Lister, M. L., Homan, D. C., Kadler, M., Kellermann, K. I., Kovalev, Y. Y., Ros, E., Savolainen, T., & Zensus, J. A. 2009, ApJ, 696, L22
- Lister & Homan (2005) Lister M. L., & Homan D. C., 2005, AJ, 130, 1389
- Liu et al. (2006) Liu, Y., Jiang, D. R., & Gu, M. F. 2006, ApJ, 637, 669
- López-Caniego et al. (2007) López-Caniego, M., González-Nuevo, J., Herranz, D., et al. 2007, ApJS, 170, 108
- Lott et al. (2007) Lott, B., Carson, J., Ciprini, S., et al. 2007, AIP Conf. Proc., 921, 347
- Madejski et al. (1996) Madejski, G., Takahashi, T., Tashiro, M., et al. 1996, ApJ, 459, 156
- Marcucci et al. (2004) Marcucci, F., Cecchi, C., & Tosti, G., 2004, Frascati Physics Ser. XXXVII, 285
- Marscher et al. (2008) Marscher A. P.; Jorstad, S. G.; d’Arcangelo, F. D., et al. 2008, Nature, 452, 966
- Massaro et al. (2009) Massaro, E., Giommi, P., Leto, C., et al. 2009, A&A, 495, 691
- Massaro et al. (2004) Massaro, E., Perri, M., Giommi, P., & Nesci, R. 2004, A&A, 413, 489
- Mattox et al. (1996) Mattox, J. R., Bertsch, D. L., Chiang, J., et al. 1996, ApJ, 461, 396
- Mattox et al. (1993) Mattox, J. R., et al. 1993, ApJ, 410, 609
- McEnery (2006) McEnery, J. 2006, ASP Conf. Proc. 350, 229
- Michelson (2007) Michelson, P. F. 2007, AIP Conf. Proc., 921, 8
- Moskalenko et al. (2003) Moskalenko, I. V., Jones, F. C., Mashnik, S. G., Ptuskin, V. S., & Strong, A. W. 2003, Int. Cosmic Ray Conf., 4, 1925
- Neugebauer et al. (1986) Neugebauer, G., Miley, G. K., Soifer, B. T., & Clegg, P. E. 1986, ApJ, 308, 815
- Nolan et al. (2003) Nolan, P. L., Tompkins, W. F., Grenier, I. A., & Michelson, P. F. 2003, ApJ, 597, 615
- Ogle et al. et al. (2009) Ogle, P., et al. 2009, in prep.
- Pei (1992) Pei, Y. C. 1992, ApJ, 395, 130
- Perlman et al. (2008) Perlman, E., Addison, B., Georganopoulos, M., Wingert, B., & Graff, P. 2008, in proc. of Blazar Variability across the Electromagnetic Spectrum, PoS(BLAZARS2008), n.009
- Perlman et al. (2005) Perlman, E. S., Madejski, G., Georganopoulos, M. et al. 2005, ApJ, 625, 727
- Perlman & Wilson (2005) Perlman, E. S., & Wilson, A. S. 2005, ApJ, 627, 140
- Petrucci et al. (2002) Petrucci, P. O., Henri, G., Maraschi, L., et al. 2002, A&A, 388, L5
- Pian et al. (2009) Pian, E., et al., 2009, in prep.
- Poole et al. (2008) Poole, T. S., Breeveld, A. A., Page, M. J., et al. 2008, MNRAS, 383, 627
- Readhead et al. (1989) Readhead, A. C. S., Lawrence, C. R., Myers, S. T., Sargent, W. L. W., Hardebeck, H. E., & Moffet, A. T. 1989, ApJ, 346, 566
- Ritz (2007) Ritz, S. 2007, AIP Conf. Proc., 921, 3
- Schlegel et al. (1998) Schlegel, D. J., Finkbeiner, D. P., & Davis, M. 1998, ApJS, 500, 525
- Sikora et al. (2009) Sikora, M., Stawarz, Ł., Moderski, R., Nalewajko, K., & Madejski, G. M. 2009, ApJ, 704, 38
- Sikora et al. (2008) Sikora, M., Moderski, R., & Madejski, G. M. 2008, ApJ, 675, 71
- Sikora et al. (2002) Sikora, M., Błażejowski, M., Moderski, R., & Madejski, G. M. 2002, ApJ, 577, 78
- Sikora et al. (2001) Sikora, M., Błażejowski, M., Begelman, M. C., & Moderski, R. 2001, ApJ, 554, 1
- Sikora et al. (1994) Sikora, M., Begelman, M. C., & Rees, M. J. 1994, ApJ, 421, 153
- Smith et al. (1977) Smith, H. E., Burbidge, E. M., Baldwin, J. A., Tohline, J. E., Wampler, E. J., Hazard, C., & Murdoch, H. S. 1977, ApJ, 215, 427
- Sokolov & Marscher (2005) Sokolov, A., & Marscher, A. P. 2005, ApJ, 629, 52
- Sokolov et al. (2004) Sokolov, A., Marscher, A. P., & McHardy, I. M. 2004, ApJ, 613, 725
- Sowards-Emmerd et al. (2005) Sowards-Emmerd, D., Romani, R. W., Michelson, P. F., et al. 2005, ApJ, 626, 95
- Sowards-Emmerd et al. (2003) Sowards-Emmerd, D., Romani, R. W., & Michelson, P. F. 2003, ApJ, 590, 109
- Starck & Pierre (1998) Starck, J.-L., & Pierre, M., A&AS, 128, 397
- Stawarz & Petrosian (2008) Stawarz, Ł., & Petrosian, V. 2008, ApJ, 681, 1725
- Stecker et al. (2006) Stecker, F. W., Malkan, M. A., & Scully, S. T. 2006, ApJ, 648, 774
- Strüder L. et al. (2001) Strüder L., Briel U., Dennerl K., et al., 2001, A&A, 365, L18
- Thompson (2007) Thompson, D. J. 2007, AIP Conf. Proc., 921, 86
- Thompson (2006) Thompson, D.J., 2006, ASP Conf. Ser., 350, 113
- Thompson et al. (1996) Thompson, D. J., Bertsch, D. L., Dingus, B. L. et al. 1996, ApJS, 107, 227
- Teräsranta et al. (2005) Teräsranta, H., Wiren, S., Koivisto, P., Saarinen, V., & Hovatta, T. 2005, A&A, 440, 409
- Teräsranta et al. (1998) Teräsranta, H., Tornikoski, M., Mujunen, A., et al. 1998, A&AS, 132, 305
- Tosti (2007) Tosti, G. 2007, AIP Conf. Proc., 921, 255
- Tramacere et al. (2007) Tramacere, A., Massaro, F., & Cavaliere, A. 2007, A&A, 466, 521
- Tramacere & Tosti (2003) Tramacere, A., & Tosti, G. 2003, New Astron. Rev., 47, 697
- Uemura et al. (2008) Uemura, M., Sasada, M., Arai, A., et al. 2008, in proc. of Blazar Variability across the Electromagnetic Spectrum, PoS(BLAZARS2008), n.070
- Watanabe et al. (2005) Watanabe, M., Nakaya, H., Yamamuro, T., et al. 2005, PASP, 117, 870
- Watanabe et al. (2004) Watanabe, C., Ohta. K., Akiyama, M., & Ueda, Y., 2004, ApJ, 610, 128
- Webb et al. (1984) Webb, G. M., Drury, L. O., & Biermann, P. 1984, A&A, 137, 185
- Wehrle et al. (1998) Wehrle, A., et al. 1998, ApJ, 497, 178
- Wilkes et al. (1983) Wilkes, B. J., Wright, A. E., Jauncey, D. L., & Peterson, B. A. 1983, Proc. of Astronomical Society of Australia, 5, 2
- Williams et al. (1967) Williams, P. J. S., Kenderdine, S., & Baldwin, J. E. 1967, MmRAS, 70, 53
- Wright et al. (1979) Wright, A. E., Peterson, B. A., Jauncey, D. L., & Condon, J. J. 1979, ApJ, 229, 73