X-ray Constraints on the AGN Properties in Spitzer-IRS identified Ultraluminous Infrared Galaxies
Abstract
We report Chandra X-ray constraints for 20 of the 52 high-redshift ultraluminous infrared galaxies (ULIRGs) identified in the Spitzer Extragalactic First Look Survey with mJy, , and . Notably, decomposition of Spitzer mid-infrared IRS spectra for the entire sample indicates that they are comprised predominantly of weak-PAH ULIRGs dominated by hot-dust continua, characteristic of AGN activity. Given their redshifts, they have AGN bolometric luminosities of – erg s-1 comparable to powerful Quasi-Stellar Objects (QSOs). This, coupled with their high IR-to-optical ratios and often significant silicate absorption, strongly argues in favor of these mid-IR objects being heavily obscured QSOs. Here we use Chandra observations to further constrain their obscuration. At X-ray energies, we marginally detect two ULIRGs, while the rest have only upper limits. Using the IRS-derived 5.8 m AGN continuum luminosity as a proxy for the expected X-ray luminosities, we find that all of the observed sources must individually be highly obscured, while X-ray stacking limits on the undetected sources suggest that the majority, if not all, are likely to be at least mildly Compton-thick (1024 cm-2). With a space density of (1.4)10-7 Mpc-3 at z2, such objects imply an obscured AGN fraction (i.e., the ratio of AGN above and below 1022 cm-2) of :1 even among luminous QSOs. Given that we do not correct for mid-IR extinction effects and that our ULIRG selection is by no means complete for obscured AGN, we regard our constraints as a lower limit to the true obscured fraction among QSOs at this epoch. Our findings, which are based on extensive multi-wavelength constraints including Spitzer IRS spectra, should aid in the interpretation of similar objects from larger or deeper mid-IR surveys, where considerable uncertainty about the source properties remains and comparable follow-up is not yet feasible.
Subject headings:
galaxies: active galaxies: high-redshift infrared: galaxies X-rays: galaxies1. Introduction
One of the most fundamental discoveries borne out of the past two decades is that 1) local, massive galaxies almost universally host central, super-massive black holes (SMBH; 106 M⊙) and 2) there exists a tight, fundamental correlation between a galaxy’s SMBH mass, stellar velocity dispersion, and bulge luminosity (Kormendy & Richstone, 1995; Magorrian et al., 1998; Ferrarese & Merritt, 2000). This key result implies that the evolution of a galaxy and its SMBH are strongly coupled from a relatively early age. Indirect verification comes from the broad agreement between the local SMBH mass density, as inferred from the luminosity function of bulges (which itself should be intimately related to galaxy evolution), and the integrated Active Galactic Nuclei (AGN) emissivity estimated from measurements of the Cosmic X-ray Background (CXRB) and the X-ray luminosity function (e.g., Yu & Tremaine, 2002; Marconi et al., 2004; Merloni, 2004; La Franca et al., 2005; Shankar et al., 2007). However, direct observations of such symbiotic growth have been difficult to obtain. A vital step is to obtain an accurate census of all AGN activity at all epochs to truly trace the growth of SMBHs.
Locally, highly obscured (i.e., Compton-thick with 1024 cm-2) accretion appears to occur in 50% of identified AGN (e.g., Risaliti et al., 1999; Guainazzi et al., 2005; Malizia et al., 2009). Similarly strong constraints at high redshift, however, remain elusive. Notably, deep X-ray surveys have revealed an AGN sky density of deg-2, at least 2–10 times more than are found at other wavelengths (e.g., Bauer et al., 2004). The bulk of these faint AGN have redshifts of 0.5–2.0 and do indeed appear to be obscured by significant gas and dust e.g., Barger et al., 2003; Szokoly et al., 2004; see Brandt & Hasinger, 2005 for a review. Somewhat surprising, however, is the fact that such sensitive X-ray surveys (Alexander et al., 2003; Luo et al., 2008) have yet to uncover more than a handful of potential Compton-thick sources similar to the ones found locally (e.g., Bauer et al., 2004; Tozzi et al., 2006), despite several tentative lines of evidence which suggest that Compton-thick AGN could be at least as plentiful as found locally (e.g., Worsley et al., 2005; Treister & Urry, 2005; Alonso-Herrero et al., 2006; Donley et al., 2007; Gilli et al., 2007; Fiore et al., 2009). Thus constraints on this hidden population of high-z Compton-thick AGN must rely on other means.
| Object | z | References | ||||||
|---|---|---|---|---|---|---|---|---|
| Mrk 231 (catalog ) | 0.0422 | 45.10 | 46.14 | 42.46 | 42.46 | 24.3 | 43.65–44.30* | 1 |
| Mrk 273 (catalog ) | 0.0378 | 43.80 | 45.78 | 42.26 | 42.85 | 24.2 | 43.40* | 2, 3 |
| Mrk 463 (catalog ) | 0.0504 | 44.80 | 45.30 | 42.55 | 43.36 | 23.9 | 44.80 | 4 |
| UGC 5101 (catalog ) | 0.0394 | 44.10 | 45.59 | 42.34 | 42.84 | 24.1 | 44.30 | 5, 6 |
| NGC 6240 (catalog ) | 0.0245 | 43.50 | 45.44 | 42.09 | 42.54 | 24.3 | 44.20* | 7, 8, 9 |
| IRAS 00182-7112 (catalog ) | 0.3270 | 45.70 | 46.98 | 43.72 | 43.90 | 24.6 | 45.00 | 10 |
| IRAS 09104+4109 (catalog ) | 0.4420 | 46.10 | 46.82 | 44.15 | 44.15 | 24.5 | 46.10* | 11 |
| IRAS 12514+1027 (catalog ) | 0.3000 | 45.60 | 46.57 | 42.73 | 42.73 | 24.0 | 44.20 | 14 |
| IRAS F15307+3252 (catalog ) | 0.9257 | 46.00 | 47.26 | 43.78 | 43.78 | 24.0 | 45.30 | 12 |
| IRAS 19254-7245 (catalog ) | 0.0617 | 44.50 | 45.70 | 42.40 | 42.40 | 24.5 | 44.40* | 13 |
Note. — Col. (1) Object. Col. (2) Redshift. Col. (3) Logarithm of the rest-frame 5.8 m continuum luminosity, calculated following S07, in units of erg s-1. Col. (4) Logarithm of the rest-frame 3–1000,m continuum luminosity (), in units of erg s-1. Col. (5) Logarithm of the observed rest-frame 2–10 keV luminosity of the AGN component derived directly from 2–10 keV data alone, with no correction for absorption, in units of erg s-1. Since the X-ray spectra of every source is contaminated by some degree of vigorous circumnuclear star formation, the values quoted here should be considered approximate. Col. (6) Logarithm of the rest-frame 2–10 keV luminosity of the AGN derived directly from spectral fits to 2–10 keV data alone, corrected for obvious absorption detected only in the 2–10 keV band itself, in units of erg s-1. In some cases, contamination from vigorous circumnuclear star formation precluded any assessment of apparent obscuration, in which case the values here are identical to those in Col. (5). Col. (7) Logarithm of the absorption column density toward the AGN derived from spectral fitting to all available X-ray data, in units of cm-2. Col (8) Logarithm of the rest-frame intrinsic 2–10 keV luminosity of the AGN derived from spectral fits to all available X-ray data, assuming the 2–10 keV data is due entirely to scattering and/or reflection components, in units of erg s-1. Sources denoted by ’*’ have been detected in the 10–40 keV band, assumed to be largely direct continuum, and should therefore be considered more robust. Nonetheless, all absorption corrections are still model dependent and should be considered approximate. Details regarding the X-ray flux, measured column density, and absorption corrections can be found in the references provided in Col. (9). Col. (9) References. 1 — Braito et al., 2004; 2 — Balestra et al., 2005; 3 — Teng et al., 2009; 4 — Bianchi et al., 2008; 5 — Imanishi et al., 2003; 6 — Della Ceca et al., 2008; 7 — Vignati et al., 1999 8 — Komossa et al., 2003; 9 — Iwasawa et al., 2009; 10 — Nandra & Iwasawa, 2007; 11 — Iwasawa et al., 2001; 12 — Wilman et al., 2003; 13 — Iwasawa et al., 2005; 14 —Braito et al., 2009.
The mid-infrared (mid-IR) regime offers much potential for discovery, since any primary AGN continuum that is absorbed must ultimately come out at these wavelengths. Indeed, ultraluminous infrared galaxies (ULIRGs, 1012) and their low-luminosity brethren have long stood out as candidates for highly obscured accretion onto SMBHs (e.g., Sanders & Mirabel, 1996; Farrah et al., 2003, 2007; Nardini et al., 2008), and several of the closest and/or brightest members of this class have now been confirmed as Compton-thick AGN e.g., Comastri, 2004; Della Ceca et al., 2008; see also Table 1. As a class, ULIRGs are almost universally X-ray faint due to their obscured nature (e.g., Franceschini et al., 2003; Teng et al., 2005; Ruiz et al., 2007), and have relative AGN contributions which scale with increasing infrared (3–1000m) luminosity, often dominating the bolometric output in the most luminous objects. This population has comparable space densities to Quasi-stellar Objects (QSOs; e.g., Smail et al., 1997; Genzel & Cesarsky, 2000) and has been proposed as an important early evolutionary stage of these AGN (e.g., Page et al., 2004; Alexander et al., 2005b; Stevens et al., 2005). As such, ULIRGs could conceivably host a sizable fraction of the most highly obscured, powerful AGN ( erg s-1) that have evaded detection even in the deepest X-ray surveys. The combination of mid-IR color selection, which traces the hot dust that obscures AGN at most other wavelengths (e.g., Lacy et al., 2004; Stern et al., 2005), and sensitive Spitzer data, for instance, routinely offer efficient selection of bright obscured and unobscured AGN by the hundreds now. Likewise, simple 24m flux selection may preferentially single out AGN-dominated sources in the mid-IR, even when the bolometric emission from such objects may still be starburst-dominated (e.g., Brand et al., 2006; Watabe et al., 2009).
We focus here on the characterization of a sample of high-redshift, Spitzer-selected ULIRGs which appear to host very powerful obscured AGN based on their mid-IR spectra and UV-to-radio spectral energy distributions (SEDs). Our goal is to understand how these sources, which represent the extreme of the overall IR-emitting galaxy population, fit into the picture of AGN demography. This paper is organized as follows: 2 describes our high-redshift sample; 3 details our data and reduction methods; 4 compares our new X-ray constraints to existing properties of IR-Bright ULIRGs, examines other AGN and star formation indicators from provided by Sajina et al. (2007, 2008, hereafter S07 and S08, respectfully), and investigates how these sources relate to other selection techniques; and finally 5 summarizes our findings. We adopt a flat cosmology with (km s-1 Mpc-1), and a neutral hydrogen column density of cm-2 for the 3.7 deg-2 Spitzer Extragalactic First Look Survey (xFLS)111http://ssc.spitzer.caltech.edu/fls/ region (Lockman & Condon, 2005).
2. Sample
Our parent sample is comprised of 52 sources with mJy, , and (Yan et al., 2005), selected from the full m xFLS catalog. As noted in Yan et al. (2007, hereafter Y07), this technique selects 59 objects over the 3.7 deg-1 xFLS region from the final mid-IR catalogs, of which 52 were originally followed-up with Spitzer IRS using the initial mid-IR catalogs. Although some objects technically lie just below the ULIRG luminosity cutoff, for simplicity we hereafter refer to this sample as xFLS ULIRGs. The two color criteria are designed to target IR-luminous obscured objects. As demonstrated in Fig. 2 of Yan et al. (2004), typical starburst and obscured AGN spectral templates migrate into this general color-color region by –2, while unobscured AGNs, by contrast, remain consistently blue as a function of redshift, and hence are not selected. The adopted 24 m flux density cutoff additionally limits our sample to only the most luminous ULIRGs at .
The effectiveness of the color selection is confirmed by low resolution, mid-IR spectra (14–40m) taken with Spitzer InfraRed Spectrograph (IRS) and optical/near-IR spectra taken with Keck. A detailed description of the mid-IR spectra and analyses combining spectra with far-infrared and sub-millimeter photometry have been published in Yan et al. (2007, hereafter Y07), S07, and S08. Here we summarize the salient results for this sample.
The mid-IR low-resolution spectra provide redshift measurements for 47 of the 52 sources: the majority (35/47 = 74%) lie at 1.5 3 .2, while a small fraction (12/47 = 26%) lie at 0.65 1.5. One additional source, MIPS 279, has a Keck redshift of . The remaining four sources are all optically faint () and have smooth power-law mid-IR spectra: near-IR photometry allows us to estimate for MIPS 15929 based on a spectral energy distribution (SED) template fit, while the others are only detected in 1–2 bands and thus likely lie at (e.g., Alexander et al., 2001; Rigby et al., 2005).
| ID | Net Counts | Observed FX | z | Rest-frame Flux | Rest-frame Luminosity | PAH | Optical | |||||||
|---|---|---|---|---|---|---|---|---|---|---|---|---|---|---|
| SB | HB | FB | SB | HB | FB | 2–10 keV | 2–10 keV | 3–1000 | AGN | |||||
| Marginal X-ray Detections | ||||||||||||||
| 8268 | 0.6 | 5.8w | 6.4w | 1.60 | 6.82 | 3.76 | 0.80 | 7.24 | 43.34 | 44.40 | 45.0 | w | — | 0.80.4 |
| 8342 | 0.9 | 3.6 | 4.5w | 1.37 | 4.77 | 1.75 | 1.56 | 1.71 | 43.44 | 45.08 | 46.0 | w | yes | 0.20.4 |
| X-ray Upper Limits | ||||||||||||||
| 78 | 1.2 | 3.6 | 4.8 | 1.76 | 3.58 | 5.25 | 2.65 | 2.20 | 44.10 | 46.24 | 46.7 | w | — | 3.40.5 |
| 110 | 0.4 | 3.5 | 3.2 | 1.06 | 5.29 | 5.34 | 1.05 | 2.58 | 43.18 | 44.79 | 45.6 | w | yes | 0.50.5 |
| 133 | 1.2 | 4.2 | 5.5 | 3.12 | 18.30 | 5.49 | 0.90 | 4.52 | 43.26 | 44.55 | 45.3 | w | yes | 0.9 0.8 |
| 279 | 0.1 | 0.8 | 0.8 | 0.89 | 4.40 | 2.43 | 0.95∗ | 1.59 | 42.90 | 44.50 | 45.2 | w | no | 0.00.1 |
| 283 | 1.7 | 4.1 | 5.8 | 1.89 | 9.49 | 4.57 | 0.94 | 3.13 | 43.15 | 44.43 | 44.9 | s | no | 1.50.9 |
| 506 | 0.1 | 0.2 | 0.3 | 1.50 | 5.70 | 3.14 | 2.47 | 1.88 | 43.96 | 45.40 | 46.3 | s | no | 6.7 |
| 8135 | 1.0 | 0.1 | 0.9 | 2.10 | 4.90 | 2.70 | 1.50p | 3.76 | 43.73 | 45.25 | 46.0 | w | — | — |
| 8196 | 0.0 | 0.2 | 0.2 | 0.86 | 2.85 | 1.57 | 2.59 | 1.08 | 43.77 | 46.04 | 46.5 | w | yes | 1.30.4 |
| 8207 | 1.7 | 0.2 | 1.5 | 1.13 | 13.13 | 4.12 | 0.83 | 2.44 | 42.92 | 44.29 | 45.0 | s | no | 0.90.5 |
| 8242 | 1.5 | 1.5 | 3.0 | 1.86 | 7.14 | 3.93 | 2.45 | 3.15 | 44.17 | 45.65 | 46.3 | w | — | 0.90.5 |
| 8245 | 0.0 | 0.1 | 0.2 | 0.88 | 5.85 | 1.61 | 2.70 | 1.11 | 43.82 | 45.81 | 46.4 | w | — | 2.80.7 |
| 8493 | 0.7 | 0.4 | 1.1 | 1.16 | 4.80 | 3.17 | 1.80 | 3.24 | 43.86 | 44.96 | 45.4 | s | — | 4.7 |
| 15840 | 2.6 | 0.2 | 2.9 | 2.14 | 3.42 | 2.35 | 2.30 | 3.18 | 44.11 | 45.86 | 46.3 | w | — | 0.20.2 |
| 15929 | 0.0 | 0.9 | 0.8 | 0.97 | 4.80 | 2.64 | 1.50p | 2.46 | 43.54 | 45.22 | 45.9 | w | — | — |
| 15958 | 0.9 | 0.9 | 1.7 | 1.35 | 4.70 | 2.59 | 1.97 | 3.07 | 43.93 | 45.53 | 46.1 | w | — | 0.50.4 |
| 15977 | 3.9 | 3.4 | 0.5 | 2.36 | 2.53 | 3.48 | 1.85 | 3.33 | 43.90 | 45.40 | 46.2 | w | — | 0.10.1 |
| 16006 | 0.8 | 0.9 | 0.1 | 1.14 | 9.43 | 4.16 | 1.90p | 2.04 | 43.72 | 45.16 | 45.9 | w | — | — |
| 16080 | 0.2 | 0.1 | 0.3 | 0.89 | 5.91 | 1.63 | 2.01 | 1.60 | 43.69 | 45.51 | 46.2 | w | yes† | 2.10.5 |
| X-ray Stacking Results | ||||||||||||||
| 0.81.5 | -2.1 | 4.5 | 2.4 | 0.26 | 3.15 | 1.53 | 0.96 | 0.65 | 42.44 | 44.53 | 45.3 | — | — | — |
| 1.53.0 | 4.3 | 3.6 | 8.0 | 0.22 | 0.67 | 0.46 | 2.09 | 0.28 | 42.95 | 45.49 | 46.1 | — | — | — |
Note. — Col. (1) MIPS source number, from Yan et al. (2007). Last two entries denote stacking results (see 3). Cols. (2–4) Total background-subtracted counts in the 0.5–2 keV (SB), 2–8 keV (HB), and 0.5–8.0 keV (FB) bands, respectively, as measured by acis extract in 90% encircled energy region at 1.49 keV. ’w’ denotes a source detection with wavdetect at the significance threshold. Cols. (5–7) Flux in the 0.5–2 keV, 2–8 keV, and 0.5–8.0 keV bands, respectively, in units of 10-15 erg s-1 cm-2 assuming a power-law model with . If the source is undetected, we instead provide the 3 upper limit using the Bayesian determination of Kraft et al. (1991). Col. (8) Redshift, from S08. “” indicates a photometric redshift. Note that MIPS 279 (“*”) was quoted in early xFLS papers as having a redshift of 1.23; this as since been revised to the value adopted in the table. Col (9) Observed rest-frame 2–10 keV flux in units of 10-15 erg s-1 cm-2 assuming a power-law model with . Col (10) Logarithm of the observed rest-frame 2–10 keV luminosity in units of erg s-1. Col. (11) Logarithm of the rest-frame 5.8 m continuum luminosity, from S07, in units of erg s-1. Col (12) Logarithm of the rest-frame 3–1000 m continuum luminosity, from S08, in units of erg s-1. Col (13) Relative strength of PAH features in IRS spectrum, from S07. Strong (“s”) PAH sources have EW(7.7m)0.8m, while weak (“w”) PAH sources have lower EWs. Col. (14) Presence of AGN as assessed by optical spectroscopy, from S08. MIPS 16080 (“†”) has starburst-like line ratios, but an asymmetric [O III] profile typical of an AGN outflow; this is similar to brighter, radio-excess ULIRGs (e.g., Buchanan et al., 2006). Col. (15) Silicate absorption at 9.7m in dimensionless units.
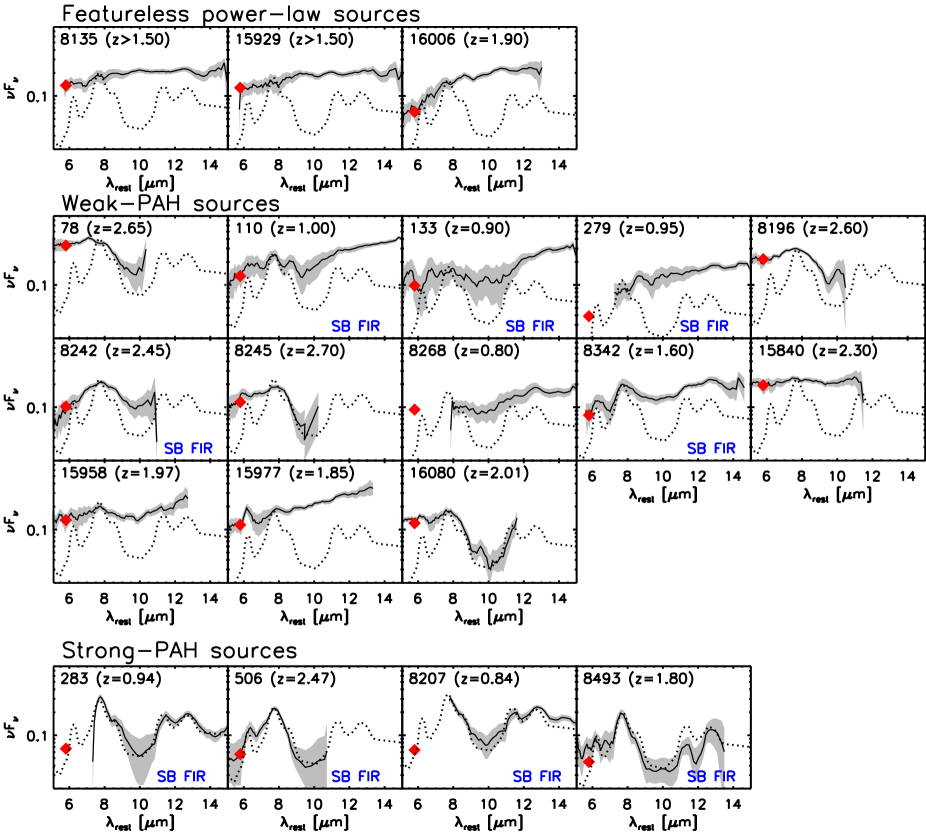
At such redshifts, most of the mid-IR spectra cover the rest-frame 5 – 15 m band, with a minimum signal-to-noise per pixel of 4; for convenience, Fig. 1 reproduces these spectra from Sajina et al. (2007) for all of the xFLS ULIRGs listed in Table 2. Locally, the PAH strength has been shown to be a robust tracer of star formation (e.g., Brandl et al., 2006; O’Dowd et al., 2009) and low-equivalent width sources are virtually all AGN-dominated (at least in the mid-IR; e.g., Genzel et al., 1998; Lutz et al., 1998; Tran et al., 2001; Farrah et al., 2007; Desai et al., 2007). Despite the modest signal-to-noise for some spectra, comparison to maximal contributions from an average starburst template of Brandl et al. (2006) in Fig. 1 clearly demonstrates that the vast majority of xFLS ULIRGs studied here are continuum-dominated. We highlight that aside from the four starburst-dominated objects, the best-fitted starburst contributions to the mid-IR are generally much lower than the maximal contribution shown.
When the entire xFLS sample are more rigorously decomposed into PAH, continuum, and obscuration spectral components, S07 find that 75% of the sample are weak-PAH sources with m, consistent with AGN-dominance in the mid-IR. Although the remaining 25% appear to be starburst-dominated, the S07 template deconvolution indicates that only 50% of the 5.8m continuum can reasonably be attributed to star formation, prompting the need for an additional hot-dust component from a dust-obscured AGN. These results are reinforced by the known correlation between starburst PAH strength and the host galaxy stellar bumps (e.g., Lacy et al., 2004; Stern et al., 2005; Weedman et al., 2006; Teplitz et al., 2007), wherein strong-PAH sources generally show clear stellar bumps in the IRAC bands while weak-PAH sources show no such bumps and usually are just power laws (S07). Subsequent analysis of the optical spectra, radio properties, and UV-to-radio SEDs by S08 further confirm the mid-IR spectral deconvolutions, concluding that strong-PAH sources typically have AGN contributions of 20–30% of the total , while weak-PAH sources generally have AGN contributions of 70%. Notably, weak-PAH sources are roughly twice as likely to lie at and have a substantially higher fraction of optically-identified AGN compared to strong-PAH sources (see Fig. 1 and S08). Thus the conclusions regarding 2 ULIRGs should be robust.
We additionally note that Sajina et al. (2010, in prep.) study the UV-to-radio SEDs of a large sample of 24um-selected sources including most of the objects discussed here. This work includes comparison with local galaxy templates as well as fits to composite quasarstarburst templates. They find that such fits are not sensitive to the details of the IRS spectra but rather to the overall 1–1000m SED shapes of these sources. They conclude that although weak-PAH sources can still have their total IR luminosities dominated by starburst activity, the 5.8m continuum of such sources is overwhelmingly dominated by obscured quasars (e.g., Fig. 1). This conclusion supports those of Polletta et al. (2008), whose sample also includes a few of the sources studied here, but where the fitting includes theoretical torus models rather than a quasar template. Both studies suggest that unless 2 starbursts and AGN have dramatically different SED shapes than has been hitherto observed, the conclusion that weak-PAH sources have 5.8m continua dominated by AGN is sound.
The total IR luminosities of the sample, derived from the mid-IR spectrum plus 70m, 160m, and 1.2mm photometry (S08), range from (0.04–2) , with a median of 5 . While of comparable bolometric luminosities to QSOs, these sources are typically much more obscured, as evidenced by their steeper mid-IR slopes and often significant 9.7 m silicate absorption (e.g., mean optical depth 1.4). This latter quantity, , appears to correlate strongly with X-ray derived (Shi et al., 2006). We note that the distribution of slope and absorption values are somewhat more extreme than those typical of type II AGN (e.g., Desai et al., 2007; Hao et al., 2007), suggesting that these objects may not merely be QSOs observed at unfavorable viewing angles (e.g., the AGN unification model; Antonucci, 1993), but might represent a particular obscured class or evolutionary phase of QSOs.
Clearly there could be variations in the individual starburst and AGN mid-IR SEDs, and thus the accuracy of the spectral decompositions is somewhat limited. However, this is unlikely to change the majority of 5.8m continuum measurements by more than 10–20% typically, and thus would have little effect on our results. We also caution that the quoted rest-frame mid-IR luminosities from S07 have not yet been corrected for intrinsic mid-IR absorption, which is difficult to determine on a source-by-source basis. In particular, some fraction of our sources have red continua indicative of strong mid-IR extinction but no obvious accompanying silicate absorption, and thus may have considerable variation in either their dust geometry or intrinsic extinction law. Although our quoted continuum at 5.8 m lies near a minimum in the mid-IR extinction curve (e.g., Chiar & Tielens, 2006), the impact of dust could still be considerable. With extinction typical of the Galactic Center (GC), for instance, our measurements could equate to a 5.8 m flux decrement of 1.6 on average and 10 in a few extreme cases. Additionally, the presence of molecular absorption features due to water ice and hydrocarbons often accompany strong silicate absorption and may result in additional intrinsic absorption (e.g., around 6.2m) in some weak-PAH sources (e.g., Spoon et al., 2002, 2004; Imanishi et al., 2006, 2008; Risaliti et al., 2006; Sani et al., 2008). Care has been taken to exclude affected spectral regions but such features may still impact the decomposition fitting. Sajina et al. (2009) explores in detail some instances of water ice and hydrocarbons within the xFLS sample, to which we refer interested readers. Both features could lead to significant underestimatates of the AGN continuum, which must thus be regarded as lower limits to their intrinsic values. Finally, objects with have somewhat larger uncertainties in because estimates can only be extrapolated based on IRS spectral decomposition above rest-frame 6–8m and broadband IRAC photometry below.
Thus to summarize the strong evidence for dominant AGN activity in the xFLS sample:
-
•
Based on spectral deconvolution of the IRS spectra, 75% of the sample are continuum-dominated, weak-PAH objects powered by AGN in the mid-IR, and even among strong-PAH objects, additional AGN continuum components are generally required. While there clearly could be some uncertainty in the deconvolution, the possible issues (e.g., templates, extinction from dust and ice) largely skew toward underestimating the true continuum of the xFLS ULIRGs.
-
•
Spectral decomposition of the rest-frame UV-to-radio SEDs confirm the modeling results of the mid-IR data alone, suggesting that strong-PAH sources typically have 20–30% AGN fractions of , while weak-PAH sources by contrast tend to have 70% AGN fractions, with a few outliers having comparable contributions from AGN and starbursts.
-
•
Radio and, where available, optical-line diagnostics support the presence of AGN in 60% of the 1.5, predominantly weak-PAH ULIRGs, independent of any IR-based diagnostics.
To explore the X-ray energetics and constrain the nature of any potential X-ray absorption in the above sources, we obtained X-ray observations for a random subset of the full sample.
3. Observational Data and Reduction Methods
We observed 20 of the 52 xFLS ULIRGs with five Chandra ACIS-I pointings of 30 ks each (PI: Yan; Obsids: 7824 (catalog ADS/Sa.CXO#obs/07824), 7825 (catalog ADS/Sa.CXO#obs/07825), 7826 (catalog ADS/Sa.CXO#obs/07826), 7827 (catalog ADS/Sa.CXO#obs/07827), and 7828 (catalog ADS/Sa.CXO#obs/07828)). The data were processed following standard procedures using ciao (v3.4) software.222http://asc.harvard.edu. We additionally removed the 05 pixel randomization, corrected for charge transfer inefficiency, performed standard ASCA grade selection, excluded bad pixels and columns, and screened for intervals of anomalous background using a threshold of 3 above or below the mean (this excluded at most 1–2 ks for each observation). Further analysis was performed on reprocessed Chandra data, using ciao, ftools (v6.3) and custom software including acis extract (v3.172)333 http://www.astro.psu.edu/xray/docs/TARA/ae_users_guide.html
Source detections were determined using the wavdetect source-searching algorithm with a significance threshold. While this threshold is typically considered ’lenient’ (i.e., 10–20 false sources over full Chandra ACIS-I field), the low xFLS ULIRG source density means we are only interested in detections at a handful of locations over the ACIS-I field-of-view, and thus it translates here into a very robust search significance. Since our sources are likely to be obscured, we searched in the standard full (0.5–8.0 kev), soft (0.5–2.0 keV), and hard (2–8 keV) bands separately. We additionally searched in the observed 1–4 keV band, which roughly equates to rest-frame 2–10 keV at , to determine the assignment of detections and upper limits at the rest-frame 2–10 keV fluxes assessed below. There are typically 90–100 X-ray sources detected per observation, which we matched to optical counterparts from the xFLS optical survey catalog (Fadda et al., 2004), providing 30 highly solid matches within 05 per observation. The matches allowed registration of the X-ray astrometric frame to the optical, with typical linear shifts of 01–02 to the original X-ray frame. The resulting 1 registration residuals are 03, ensuring spatially robust X-ray identifications and upper limits. Among the 20 objects observed, only two were formally detected in any of the above bands (see Table 2).
Aperture-corrected photometry was performed using acis extract with a 90% encircled-energy region derived from the Chandra PSF library, with 3 upper limits calculated following Kraft et al. (1991). Fluxes were derived assuming a power-law model with consistent with the spectrum of the CXRB. We also performed photometry on specific sub-bands to allow more accurate constraints on rest-frame fluxes at the redshifts of our sources. To this end, we use the observed 0.5–2.0 keV and 1–4 keV bands to estimate the rest-frame 2–10 keV fluxes (or upper limits) and subsequent luminosities for objects with and , respectively. An additional K-correction of order 15–20% is applied to account for individual redshifts.
Regarding the two detected sources, we find that one is detected in the full and hard bands, while the other only in the full band. Although the photon statistics here are poor (both sources are formally consistent with zero net counts at 1–2 confidence following Gehrels, 1986), the photon energy distributions lean toward both being heavily obscured. An unabsorbed AGN with a power-law spectrum, for instance, would have three times as many 0.5–2.0 keV counts as 2–8 keV counts, easily detectable in our Chandra observations. Given the effective area of Chandra, a large neutral hydrogen column of – cm-2 would be required to arrive at the observed count distributions of both sources. Neither source is formally detected in the rest-frame 2–10 keV bands described above, however, so we quote their 3 upper limits for this flux. Assuming again ( would change these values by only 10%), the observed full-band luminosities of MIPS 8268 and MIPS 8342 are erg s-1 and erg s-1, respectively, and extrapolate to rest-frame 2–10 keV luminosities of erg s-1 and erg s-1 for the two objects.
To place stronger average constraints on our sample, we also performed X-ray stacking analyses on the undetected sources, which has been successfully employed on numerous source populations in both wide and deep field X-ray surveys (e.g., Brandt et al., 2001; Brand et al., 2005; Daddi et al., 2007; Lehmer et al., 2008). We divided the 20 ULIRGs into two subsets based on redshift (0.81.5 and 1.5z3.0), taking care to exclude both the two detected sources and the three sources which lie on ACIS chip S7, since the extended PSFs from the latter include too much background to improve the signal-to-noise. For consistent aperture corrections, we again used the 90% encircled-energy aperture region measured at 1.49 keV from acis extract. For rest-frame luminosity estimates, we stacked counts only from the 2–10 keV rest-frame bandpasses of the sources (i.e., in the observed 0.5–2.0 keV and 1.0–4.0 keV bands for z¿1.5 and z¡1.5, respectively). Aside from the use of individual geometric source apertures instead of circular apertures, our method largely follows that of Lehmer et al. (2008, and references therein). To properly account for spatial variations in pixel sensitivity due to chip gaps, bad pixels, and vignetting, the total number of background counts within our stacked aperture was determined by scaling the cumulative background counts found within local annuli by the ratio of the summed exposure times in the source and background regions, respectively. No significant detection was found in either redshift subsample,444The most significant detection was only 1.7 in the full-band for the 1.5z3.0 subsample. so we calculated 3 upper limits following Kraft et al. (1991). These count limits were converted to 2–10 keV rest-frame fluxes using the previously adopted spectral model for photometry above.
4. Discussion
We would like to use the above constraints to understand the nature of the xFLS ULIRGs and their context with respect to the rest of the high-z AGN population. Continuum emission at hard X-ray and mid-infrared wavelengths, as well as emission from the narrow-line region, are widely considered to provide the most robust constraints on AGN bolometric luminosities (e.g., Bassani et al., 1999; Xu et al., 1999; Lutz et al., 2004; Heckman et al., 2005; Imanishi, 2006; Meléndez et al., 2008; Nardini et al., 2008; Vega et al., 2008; McKernan et al., 2009), as each offers a unique measure of the primary AGN energy output over large dynamic range (4–5 dex) before contamination from host star formation sets in. The dependence of AGN properties on orientation and intrinsic obscuration is a long-standing problem when trying to assess the true power of AGNs (e.g., Antonucci, 1993) and none of these tracers are without its faults. However, because these tracers are affected differently by orientation and obscuration, we can assess the nature of obscuration present in our xFLS ULIRGs by comparing their X-ray upper limits to other less obscured tracers such as rest-frame 5.8m continuum and (in a few cases) [O III] flux. This is essentially the same approach adopted by Alexander et al. (2008, hereafter A08) to constrain Compton-thick AGN in the GOODS-N region. First, however, we would like to assess the applicability of these relationships to ULIRGs using several bright, well-characterized objects from the literature.
4.1. Guidance from IR-Bright ULIRGs
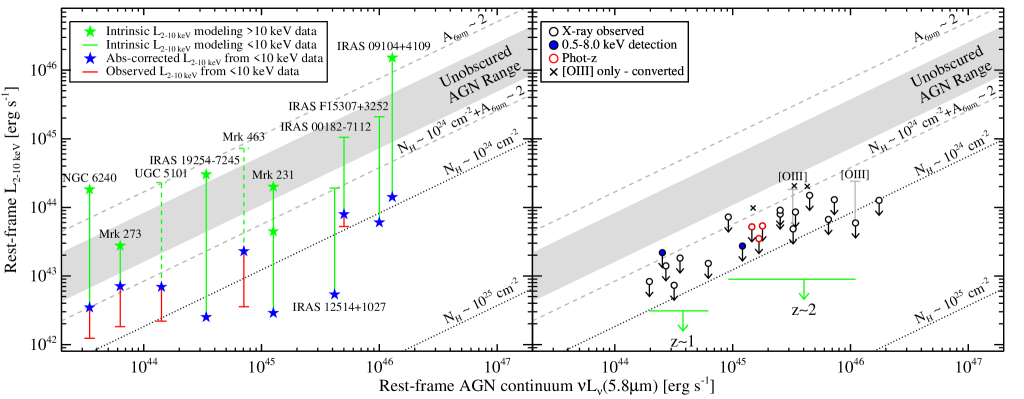
A correlation between 2–10 keV and 5.8m luminosity has now been well-established for both type 1 and absorption-corrected type 2 AGN (e.g., Lutz et al., 2004; Sturm et al., 2006). While it is not yet clear why this correlation is as tight as observed (e.g., the apparent absorption-corrected 2–10 keV luminosities of type 2 AGN can often be substantially lower than extrapolations based on 10 keV luminosities; Heckman et al., 2005; Meléndez et al., 2008), or what functional form best describes the correlation is (e.g., Lutz et al., 2004; Fiore et al., 2008; Lanzuisi et al., 2009), empirically this correlation implies that AGN are relatively robust, immutable, and scalable physical systems. In both panels of Fig. 2 we show the intrinsic rest-frame 2–10 keV-to-5.8 m range for type 1 AGNs (i.e., only continuum-dominated mid-IR sources with little or no PAH emission), where the correlation is given as , with both luminosities in units of erg s-1, and the grey shaded region denotes 1 luminosity range (Bauer et al., in preparation); we note that this fit is consistent with the original correlation found by Lutz et al. (2004) at low luminosities and lies intermediate between the extrapolations of Lutz et al. (2004) and Lanzuisi et al. (2009) at high mid-IR luminosities.
To demonstrate how X-ray absorption and mid-IR extinction affect the intrinsic AGN output, we also show in Fig. 2 the expected ratios for a typical AGN (taken as the center of the unobscured AGN range) assuming (1) the 5.8m continuum is intrinsic but the X-ray emission is absorbed by a column densities of cm-2 and cm-2,555The value of cm-2 is roughly where obscuration is expected to start becoming Compton-thick, and has been calculated using a model similar to that presented in Alexander et al. (2005a) and Gilli et al. (2007), wherein the primary radiation is obscured and we only detect reflection and scattering components that typically comprise 5% of the intrinsic 2–10 keV emission. By cm-2, the source is expected to be ’fully’ Compton-thick such that no primary continuum escapes, and has been calculated assuming the best-fitted X-ray spectrum of NGC 1068 from Bassani et al. (1999). and (2) the X-ray emission is intrinsic but the 5.8m continuum is extincted by mag,666If we combine the Cardelli et al., 1989 optical/near-IR and Chiar & Tielens, 2006 mid-IR extinction curves, mag is equivalent to mag assuming appropriate for dense starbursts/H II regions or mag assuming appropriate for Milky Way interstellar material, respectively. as might be the case in many ULIRGs. Both decrements and their associated errors contribute to the observed scatter of this relation, and thus it is natural to wonder how ULIRGs, which are some of the most dusty and obscured objects in the Universe, fit into the above picture.
To this end, we assembled a sample of IR-bright ULIRGs from the literature, all of which have high quality Spitzer IRS and 2–10 keV spectra and are widely considered to host Compton-thick AGN. This list is regrettably small because such objects are typically X-ray faint and difficult to constrain. Importantly, half of the sample have published X-ray detections above 10 keV with Suzaku or BeppoSAX, allowing the best assessment of the apparent direct X-ray continuum to date. Basic properties of this sample are listed in Table 1.
The observed and intrinsic X-ray luminosities of these IR-bright ULIRGs were taken directly from the references in Table 1; the X-ray data reduction and spectral fitting rely on the assumptions detailed therein. For Mrk 231, we list both of the intrinsic X-ray luminosities provided by Braito et al. (2004), depending on whether the X-ray spectrum is dominated by scattering (low value) or reflection (high value). For both Mrk 463 and UGC 5101, it has been argued that the low observed Fe K equivalent widths (200–400 eV) demonstrate that the direct AGN continuum is being observed. If scattering dominates over reflection, however, such equivalent widths can still be fully consistent with Compton-thick AGN (e.g., Murphy & Yaqoob, 2009), as in fact appears to be the case for Mrk 231. Thus for these two sources, we compute intrinsic X-ray luminosities assuming the observed continua are reflection/scatter dominated and comprise 5% of their intrinsic values e.g., Alexander et al., 2005a; Gilli et al., 2007, hereafter G07; Molina et al., 2009; these corrections are denoted with dashed green upper limits in the left panel of Fig. 2 since they are more tentative and open to interpretation.
The 5.8m AGN continuum luminosities for this bright ULIRG sample were derived following the procedure used in S07. Specifically, IRS low-resolution spectra in the form of pipeline-processed, Basic Calibrated Data (BCDs) were downloaded from the Spitzer archive. Sky backgrounds were generated by subtracting BCD images at two different node positions. Flux- and wavelength-calibrated 1-D spectra were then extracted from the sky-subtracted 2-D, BCD images using the SSC spectral extraction software, SPICE (v2.2).777http://ssc.spitzer.caltech.edu/postbcd/spice.html Finally, four segment spectra covering 7–35m were are fit together to eliminate bad pixels at the edge of each order. The resulting spectra were corrected for Galactic extinction and fit with a power-law continuum and PAH template of M 82. Given that M 82 has one of the strongest observed mid-IR dust continua, our constraints on AGN hot-dust components should be considered relatively conservative. In cases where prominent 6m ice absorption is present, we masked it out and fit only the continua on either side. The values are the monochromatic rest-frame luminosities read off from the best-fit models. In all cases except NGC 6240, the continua are dominated by a power-law component. This is also the case for our high-z xFLS sample, which is largely composed of weak-PAH sources. As discussed in 2, determining the starburst contribution to in the few strong-PAH sources where it may be significant is complicated by the highly uncertain levels of hot dust emission that can be associated with pure starbursts. Using M 82 as a template, for instance, we estimate that up to half of in NGC 6240 could be due to its starburst. A starburst contribution of 30% can also be seen in Mrk 273 and UGC 5101, but is negligible in the rest of the IR-bright ULIRG sample.
The observed 2–10 keV luminosities of the IR-Bright Compton-thick ULIRGs in the left panel of Fig. 2 all lie around the cm-2 track, confirming our expectation that they are highly obscured. Once the effects of known X-ray absorption are accounted for (green limits), however, these Compton-thick ULIRGs generally lie on or above the type 1 AGN correlation. Importantly, the case for large X-ray corrections is strongest for the sources with solid 10 keV X-ray detections (green stars), which have the least amount of ambiguity regarding their intrinsic X-ray luminosities.
Considerable uncertainties in the mid-IR also remain from the poorly constrained gas-to-dust ratios and dust geometries in ULIRGs. Theoretical arguments suggest that the mid-IR emission can perhaps vary by up to an order of magnitude depending on the distribution and composition of the obscuring dust (e.g., Pier & Krolik, 1992; Nenkova et al., 2002, 2008). If the gas-to-dust ratios were substantially lower for ULIRG AGN, for instance, then the mid-IR luminosity constraints could overestimate the true bolometric power of the AGN. Such a correction might move some ULIRGs into better alignment with the typical type 1 range, but would make current discrepancies with others even more extreme. Particular dust geometries/orientations, on the other hand, could lead to a few magnitudes of extinction even at mid-IR wavelengths and cause us to underestimate the true mid-IR luminosities from these objects. The mag track demonstrates the potential degree of such an effect.
The left panel of Fig. 2 illustrates that the known correlation between intrinsic rest-frame 5.8m and 2–10 keV emission in AGN does effectively extend to ULIRGs and that observed 2–10 keV decrements should provide realistic diagnostics of obscuration in all objects containing AGN. Settling on a sensible criteria for selecting Compton-thick AGN, however, is not clearcut. A conservative approach is to adopt the cm-2 track as our Compton-thick criteria. While this neglects the potential mid-IR extinction that is likely to accompany the X-ray absorption, it ensures that the selected sample of candidates will have negligible contamination from less obscured sources. Under this scheme, only six of the above 10 widely-regarded Compton-thick IR-bright ULIRGs would be selected, demonstrating that we might miss a considerable fraction of likely Compton-thick AGN with such an approach. On the other hand, adopting the more inclusive cm mag track as our Compton-thick criteria would select all of the IR-bright ULIRGs, but may potentially select AGN which are somewhat less heavily-obscured as well. Clearly there are merits and drawbacks to each criteria, so we will employ both in the next section to gauge the nature of the xFLS ULIRGs.
4.2. Constraints on the Nature of xFLS ULIRGs
In the right panel of Fig. 2, we compare rest-frame 5.8 m AGN continuum and 2–10 keV luminosity constraints for xFLS ULIRGs. For a given mid-IR luminosity, we typically find a large decrement between our individual X-ray upper limits and the expected 2–10 keV emission, as estimated from the intrinsic X-ray–to–mid-IR correlation, demonstrating that all of the xFLS ULIRGs should be heavily obscured AGN. Only two of the individual 3 upper limits lie below the conservative cm-2 track, while all but two lie below the inclusive cm mag track. Thus some fraction of xFLS ULIRGs are likely to be at least mildly Compton-thick, but many individual upper limits leave ambiguous constraints.
The locations of the two marginally full-band detected xFLS ULIRGs, MIPS 8268 and MIPS 8342, can provide some initial guidance. As noted in 3, neither are formally detected in the rest-frame 2–10 keV sub-band, and thus appear in Fig. 2 as upper limits. The rest-frame 2–10 keV luminosities extrapolated from their observed full-band counts lie below their upper limits by factors of 2.8 and 1.1, respectively, but still roughly a factor of 2 above the conservative cm-2 track. Both extrapolations are at least broadly consistent with our crude band ratio analysis in 3. If these two objects represent the least obscured xFLS ULIRGs, then we would expect the rest to lie near or below the conservative track accordingly.
We can improve upon these constraints by stacking the X-ray counts of the undetected sources in two subsamples, split into crudely matching redshift ranges (see 3). Importantly, we find that neither sample is statistically detected, with stacked 3 upper limits lying factors of 1.6 and 5.2 below the conservative cm-2 track for the and samples, respectively. Assuming all sources contribute roughly equally to the stacked signal, these low limits imply that 70% of the and 90% of the Chandra-observed xFLS ULIRGs should be at least mildly Compton-thick at 99% confidence, and perhaps some fraction even fully Compton-thick ( cm-2). Assuming the Chandra-observed objects are representative and follow a normal distribution, then we can calculate ’margin of error’ constraints888 When only a subset of the total population is sampled, the associated error (often termed ’margin of error’) on the fraction of the total population with a particular property can be calculated using , where is the ’critical value’ related to the form of the underlying distribution, the degrees of freedom, and the confidence interval of interest (in this case a 1-sided -distribution), is the fraction of a particular property found from the subset population, and is the finite population correction factor , is the subset number, and is the total population number (e.g., Peck et al., 2008). on the potential Compton-thick fraction for the entire sample. For , we only stack 3 of 15 total xFLS ULIRGs, resulting in a candidate Compton-thick fraction of 25% at 90% confidence, but no meaningful constraint at higher confidences. For , we stack 11 of 37 total xFLS ULIRGs, resulting in candidate Compton-thick fractions of 80% and 70% for confidences of 90% and 99%, respectively. Our general conclusion that a majority, if not all, xFLS ULIRGs are likely to host luminous Compton-thick AGN is supported by the fact that the individual xFLS upper limits lie in the same range as some observed X-ray luminosities from our IR-bright Compton-thick ULIRG sample (4.1), implying that the xFLS objects could be even more extreme.
This result is predicated on the fact that the X-ray decrement provides a reliable estimate of the obscuration, when compared to the AGN continuum luminosity at 5.8 m. While we argued in 4.1 that this procedure is robust, emission-line luminosities from AGN can provide an independent check on the AGN power estimated from our 5.8 m measurements. Only five xFLS ULIRGs have robust [O III] detections among nine observed (S08), which we plot in the right panel of Fig. 2. These emission-line luminosities have not been corrected for contamination by star formation or extinction, primarily because neither is well quantified. The expected contribution to the observed from star formation should be minimal (1–10%), as long as the well-established star-formation correlations between [O III], [O II], and (e.g., Hopkins et al., 2003; Moustakas et al., 2006) hold for the xFLS ULIRGs. As discussed in S08, the effects of internal extinction are more problematic, since the few sources with direct rest-frame optical constraints exhibit a wide range of apparent extinctions.
For instance, among the five [O III]-detected xFLS ULIRGs in Fig. 2, direct assessment of the optical extinction via the Balmer decrement is available for four. Assuming no systematic errors exist between near-IR spectral segments, two sources show no evidence for extinction, while the other two have and , respectively. Among comparable IR-bright, optically-faint sources, Brand et al. (2008) also report extinctions in the range –1.9. Thus the amount of optical extinction can vary dramatically from source to source and potentially be quite severe. There also remains some possibility that the [O III] emission does not see the same extinction as the Balmer lines. We can alternatively estimate based on the silicate absorption in the mid-IR, which lies in the range –2.7 for the five sources and provides constraints on extinction from the nuclear region itself. The ratio is principally dependent on the relative abundances of silicate and graphite grains: 18 for diffuse interstellar material (ISM), 18–40 for denser clouds, and 9 near the GC (e.g., Roche & Aitken, 1985; Whittet, 2003; Chiar et al., 2007). If we conservatively adopt the low GC conversion and , then we would expect –24 or –4.9, which is substantially higher than the direct estimates. Even adopting a somewhat conservative , the correction to [O III] is already 1–2 dex.
The five [O III]-detected xFLS ULIRGs have ratios of -3.0 to -3.5, which systematically lie 1–2 dex lower than the average type 1 and type 2 AGN/ULIRGs, respectively e.g., Haas et al., 2007; Bauer et al., in preparation. The discrepancy is consistent with our expectation that the [O III] luminosities are highly extincted. Thus our uncorrected values should be considered very conservative lower limits to the true AGN power.
To compare against our X-ray limits in the right panel of Fig. 2, we convert the [O III] constraints to X-ray ones using the [O III]-to-X-ray correlation for type 1 AGN (), where the emission-line luminosities have not been corrected for extinction (Bauer et al., in preparation); both luminosities are in units of erg s-1.999We note that this correlation differs significantly from those found by, e.g., Netzer et al. (2006), Panessa et al. (2006) and Meléndez et al. (2008), which primarily appears to be due to the limited luminosity ranges of the aforementioned samples. For a given [O III] luminosity in the high-luminosity, radio-quiet AGN sample of Maiolino et al. (2007), for instance, these relations all overestimate the detected X-ray luminosities by 1–2 dex. Importantly, applying any of these other correlations would result in a significantly larger intrinsic X-ray luminosity estimate, thus favoring even more X-ray absorption. A08, for instance, have recently shown that several optically-identified Compton-thick AGN also follow the AGN correlation shown in Fig. 2, when one converts uncorrected-[O III] luminosity into X-ray luminosity. We find that the predicted rest-frame 2–10 keV luminosities lie a factor of 5–6 above the current X-ray limits, supporting the presence of significant X-ray obscuration. Since the optical extinction in the xFLS ULIRGs should be much larger than for the type 1 AGN used to derive the correlation, these converted X-ray luminosity constraints should be considered very conservative.
An alternative scenario sometimes invoked is that the hot dust component is somehow associated with massive, deeply embedded star formation. Wolf-Rayet and early-type O stars, for instance, are certainly capable of producing the hard radiation necessary to power the continua in theory. Strong continuum-dominated sources like the weak-PAH xFLS ULIRGs, however, lie 1–2 dex above the the - correlation for star-forming galaxies. This effectively rules out star-formation for all but the most contrived scenarios, but is fully consistent with known AGN (e.g., S07; Desai et al., 2007). Further indirect evidence against star formation comes from high-spatial resolution mid-IR imaging of the most powerful local infrared luminous AGN, including a few from Table 1. Such observations constrain a large fraction of the mid-IR continuum light within a region 100 pc in size (03) around the nucleus, with mid-IR surface brightnesses in excess of 1014 kpc-2 (e.g., Soifer et al., 2000, 2003). While the most extreme ’super’ star-clusters known locally can still generate comparable mid-IR surface brightnesses (e.g., Gorjian et al., 2001), the largest sizes of such star-clusters are only 1–10 pc, which are much smaller than the current spatial limits on local ULIRG nuclei. Coupling this 1–2 dex size deficit with the facts that the xFLS ULIRGs have (1) mid-IR luminosities 1–2 dex higher than the above local AGN and (2) relatively weak PAH features, and it seems highly unlikely that super star-clusters (even exotic ones at high redshift) are capable of producing the required mid-IR luminosities of order 1012– . As such, AGN appear to be the most plausible option for powering the bulk of the mid-IR emission in ULIRGs.
In summary, the strong 5.8 m continuum and [O III] luminosities (once corrected for extinction), coupled with the weak X-ray emission even in stacked X-ray images, argues for at least mild Compton-thick obscuration in a large fraction of, if not all, xFLS ULIRGs.
4.3. Comparison to Other Selection Techniques
There are several different techniques to find mid-IR AGN, and the common goal of these methods is to identify heavily-obscured, and potentially Compton-thick AGN that might be missed by X-ray, UV, or radio selection. These techniques generally fall into a few overlapping categories: (1) those like Y07 that look for strong hot dust components relative to stellar continua (“mid-IR excess”), (2) those that look for hot dust components directly in the IRAC 3.6–8.0m bands alone (“mid-IR spectral slope”), and (3) those that look for strong radio emission above that expected from star formation (“radio excess”). A recent study by Donley et al. (2008) has investigated the reliabilities of these methods. Given the degree of high quality follow-up data on our sample, particularly spectroscopic redshifts, and the likelihood that xFLS ULIRGs host Compton-thick AGN, a lower limit to the number of potential Compton-thick AGN discovered by other methods can be assessed by investigating the relative frequency with which xFLS-like ULIRGs are selected via these other methods. Such comparisons also allow us to place the xFLS ULIRGs within the context of these other surveys, particularly in regard to their relative space densities presented in 4.4. Table 3 provides an overview of our findings, which we discuss in detail below. We automatically exclude xFLS ULIRGs with unconstrained IRAC colors from affected comparisons. Also, since sources with direct X-ray detections are likely to be relatively unobscured, we only make comparisons between X-ray undetected subsets of the samples.
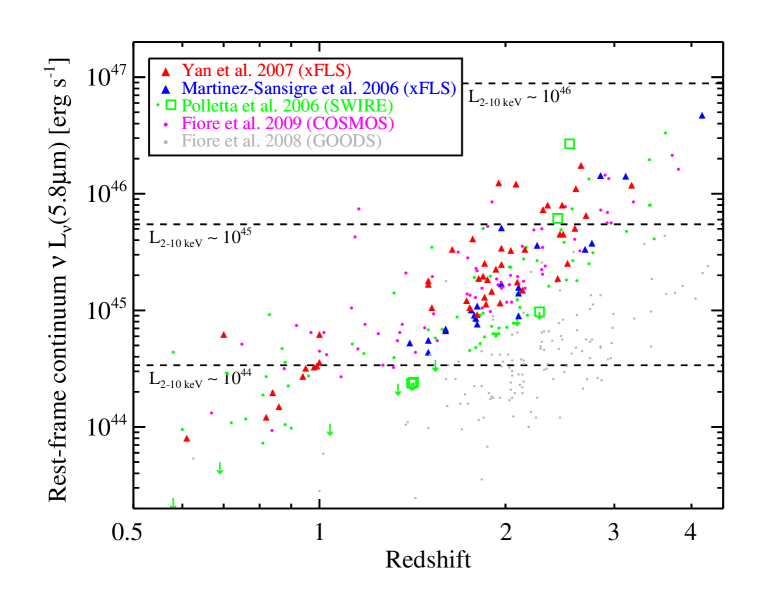
We begin comparisons with the closely related studies of Martínez-Sansigre et al. (2006, 2007, collectively hereafter MS06) and Polletta et al. (2006, hereafter P06), both of whom also focus on similarly powerful obscured AGNs (see Fig. 3). The “radio-excess” technique of MS06 selects only high-redshift ULIRGs (also within the xFLS footprint) which lie above the radio-to-far-infrared correlation for star-forming galaxies (e.g., Condon, 1992). This technique targets the radio-intermediate to radio-loud portion of the obscured QSOs population, from which the remaining radio-quiet subset can, in theory, be loosely extrapolated. Within a given redshift bin, the average 5.8 m luminosity of the MS06 sample is roughly a factor of two lower, indicating that MS06 samples less powerful AGN. Importantly, nearly all of the MS06 sample has also been observed with the Spitzer IRS (Martínez-Sansigre et al., 2008), and display properties very similar to the xFLS ULIRGs, such as strong silicate absorption ( 1–2) and spectra dominated by strong hot dust continua. Under their criteria, five of the xFLS ULIRGs sources should nominally have been selected, although three of these appear to have been rejected from that sample due to source-blending issues in the IRAC 3.6m band. The fraction of xFLS ULIRGs selected by this method thus lies somewhere between 5–10%. While this seems low, extrapolating from the fraction of radio-intermediate AGN to the full population yields a more substantial overlap.
| Study | Selection Criteria | xFLS Recovery |
|---|---|---|
| Yan et al. (2007) | , , | — |
| Lacy et al. (2004) | or , , , | 65%* |
| Stern et al. (2005) | , , , | 30%* |
| , | ||
| Cool et al. (2006) | , , , | 100%* |
| Donley et al. (2007) | , , where , | 70% |
| Polletta et al. (2006) | monotonic flux increase in 3 mid-IR bands, | 70% |
| , where , , | ||
| , , , SED fitting | ||
| Martínez-Sansigre et al. (2006) | , , | 5–10% |
| Fiore et al. (2009) | (COSMOS) or (GOODS), , | 40% |
| Dey et al. (2008) | , | 50% |
Note. — Col. (1) Selection technique. Col. (2) Flux/magnitude cutoffs and color selection criteria. Here and . Brackets “” denote AB magnitudes. itself denotes the Spitzer IRAC and MIPS band (given as central wavelength in units of m) or the standard optical/near-IR band. Col. (3) Fraction of sources selected by the xFLS ULIRGs criteria which would also be selected by another technique. The fractions denoted with a ’*’ have been assessed without the stated selection criteria, since these would typically reject the bulk of xFLS ULIRGs outright.
P06, on the other hand, use a number of criteria (both “mid-IR excess” and “mid-IR spectral slope”) to remove sources with non-power-law SEDs from their IR-selected sample (see Table 3), selecting sources with a wide range of SED-types, luminosities, and obscuration levels. They find that 35% of their sample are X-ray detected, with only two X-ray-detected sources showing evidence for cm-2 absorption. The absorption for the X-ray undetected subset of their sample should typically be comparable to or larger than the X-ray detected sources, but this absorption distribution has yet to be firmly established. The 5.8 m luminosity and redshift range of the xFLS sources matches the upper end of the P06 sample, and 70% of xFLS ULIRGs should be selected by the P06 criteria. The large overlap suggests that a sizable number of Compton-thick AGN likely exist within the P06 sample. How this extends to the lower luminosity sources, however, and particularly to the unusually large number that lie near the flux limit of their survey, is unclear.
Applying the most commonly used IRAC AGN color-selection cuts from Lacy et al. (2004) and Stern et al. (2005), we find that 70% and 30% of the xFLS ULIRGs are selected, respectively. The low percentage for the latter stems from the fact that the majority of xFLS ULIRGs lie immediately to the right of the Stern et al. (2005) region. Extending the Stern et al. (2005) region for objects as Cool et al. (2006) have done, for example, recovers an impressive 100% of our sample. A major limitation in all of the above studies, however, is the adoption of either shallow optical and/or mid-IR flux cutoffs, which effectively remove all xFLS ULIRGs regardless of color-selection criteria. In the case of Lacy et al. (2004), the factor of 5 higher 24m cutoff, coupled with the expected strongly declining space density evolution for ULIRGs, is likely to severely limit the number of comparably luminous but more nearby xFLS-like ULIRGs detected. For Stern et al. (2005) and Cool et al. (2006), the bright optical selection will effectively remove a large fraction of highly-obscured ULIRGs like those studied here. While extending the above techniques to deeper samples would help select ULIRGs like those in the xFLS, doing so could be counterproductive since it could also introduce many new star-forming contaminants (see Donley et al., 2008). Adding an additional color selection to remove galaxies, such as an criteria, could effectively address this apparent limitation.
The other main “mid-IR spectral slope” technique used extensively is the power-law galaxy (PLG) criteria of Alonso-Herrero et al. (2006) and Donley et al. (2007), which Donley et al. (2008) contend recovers the majority of high-quality AGN candidates. All of the xFLS ULIRGs would qualify as PLGs based on their underlying mid-IR AGN continuum slopes as found from spectral decomposition. However, using only the observed IRAC data alone as stipulated in Donley et al. (2007), only 70% of the xFLS ULIRGs are recovered as PLGs. While not in direct contrast with Donley et al. (2008), our result implies that there exists a rather substantial population of legitimate mid-IR excess AGN which are currently missed by the PLG technique. These non-PLG objects typically either had poor IRAC constraints (and subsequently large uncertainties in their spectral slopes) or were dominated by stellar continua well into the IRAC bands but had strong hot-dust components at longer wavelengths (see S07). Intriguingly, several of the PLG-selected xFLS ULIRGs also had relatively strong host stellar continuum components, demonstrating that the PLG method does select some composite AGN.
Among the “mid-IR excess” techniques, the Fiore et al. (2008, 2009, hereafter F08 and F09) and Dey et al. (2008) selection criteria are the most closely related to Y07, although both employ much lower 24m flux cutoffs, have no 24m-to-8m flux selection, and require a factor of 3 larger 24m to R-band excess. F08/F09 additionally implement an cut to remove low-redshift contamination from star-forming galaxies. The lower flux cutoff there probes deeper into the overall 24m source population to select both lower luminosity and higher redshift objects (see Fig. 3), while the larger mid-IR excess picks only the reddest ULIRGs. The lack of 24m-to-8m selection, however, should lead to the inclusion of many sources with either less obscuration and/or hotter dust continua. We find that only 40% and 50% of xFLS ULIRGs lie at the extremes selected by the F08/F09 and Dey et al. (2008) techniques, respectively. There is a mild tendency for these techniques to predominantly select higher redshift sources as expected, although several high-z xFLS ULIRGs are still notably excluded. If all of the 5.8m luminosity in F08/F09-selected objects stems from obscured AGN activity, then the X-ray stacking detection performed by these authors equates to an average mid-IR/X-ray decrement of , which is an order of magnitude below our xFLS X-ray luminosity stacking upper limits, and hence fully consistent with our results. Another mid-IR excess selection method is that of Daddi et al. (2007, hereafter D07), which selects a large number of high-redshift, moderate-luminosity, obscured AGN candidates comparable to the GOODS sources in F08. This selection technique is too complex to employ here, since it relies on assumption-dependent excesses between the dust-corrected UV and IR star formation rates in each object. Nonetheless we note that the D07 sample has an average 5.8m excess luminosity of 3 erg s-1, which is comparable to those of our 1 objects, and an X-ray stacking detection an order of magnitude below our X-ray luminosity upper limits, which again is fully compatible with our results.
While it is rare to find full consistency between Y07 and other selection methods, there appears to be enough overlap (if we neglect shallow flux criteria) to demonstrate that many of these methods select a substantial subset of powerful, potentially Compton-thick ULIRGs like the ones characterized here. Aside from MS06, however, a fundamental limitation of these other studies is their reliance on broad-band photometry and, in several cases, photometric redshifts. This critical lack of precise redshifts and spectrally-deconvolved SEDs makes it impossible to distinguish unambiguously between mid-IR excesses due to hot dust from AGN and those from strong PAH features due to vigorous star formation. While this may be a relatively small concern at high mid-IR luminosities where AGN are thought to dominate (e.g., erg s-1), it is likely to cause severe problems at lower mid-IR luminosities where star formation is expected to be ubiquitous (e.g., S07; Lacy et al., 2007; Martínez-Sansigre et al., 2008).
4.4. The Space Density of Heavily-Obscured Accretion
We now investigate the space densities of the candidate Compton-thick AGN samples discussed in 4.3 in several redshift and predicted intrinsic X-ray luminosity bins. Approximate values of intrinsic rest-frame were predicted from rest-frame assuming the conversion above.101010The choice of correlation slope and intercept do not have a strong effect on the estimated luminosities (and there space densities), and lead to variations of perhaps 2 in either direction. Additionally, correcting rest-frame for extinction could raise it a factor of 2 on average, implying a similar increase to intrinsic rest-frame . A key concern is that although these samples all span a wide range of luminosities and redshifts (see Fig. 3), their selection is often potentially biased or incomplete within a particular bin due to limited solid angle coverage, restrictive selection criteria, or survey flux limits. Table 4 provides space density estimates for the full range of parameter space probed, while Fig. 4 highlights the best constraints for each of the samples. For bins which are obviously incomplete, we assume the derived values are lower limits. We again strongly caution over interpretation of sources in the comparison samples which often lack both complete optical/near-IR spectroscopic identification and well-sampled SEDs with IRS spectroscopy to decouple possible emission mechanisms. Contamination from star formation, particularly at lower mid-IR luminosities (as discussed in 4.3), could be substantial. Since this contamination is not yet well-constrained, we liberally place these comparison samples at their highest space densities using all candidate objects.
| Sample | Area | –1045 erg s-1 | –1046 erg s-1 | |
|---|---|---|---|---|
| Yan et al., 2007 (xFLS) | 3.26* | 0.5–1.0 | 1.44E07 ( 0) | 1.44E07 (0) |
| 1.0–2.0 | 1.32E07 (18) | 1.64E07 (0) | ||
| 2.0–3.0 | 1.85E07 ( 9) | 1.44E07 (7) | ||
| 3.0–4.0 | — | 2.16E08 (1) | ||
| Yan et al., 2007 (xFLS) | 3.26* | 0.5–1.0 | 1.44E07 ( 0) | 1.44E07 (0) |
| w/o strong PAH sources | 1.0–2.0 | 9.53E08 (13) | 1.64E07 (0) | |
| 2.0–3.0 | 1.44E07 ( 7) | 1.03E07 (5) | ||
| 3.0–4.0 | — | 2.16E08 (1) | ||
| Martínez-Sansigre et al., 2006 (xFLS) | 3.70 | 0.5–1.0 | 5.08E07 ( 0) | 5.08E07 (0) |
| 1.0–2.0 | 3.10E07 (12) | 1.45E07 (0) | ||
| 2.0–3.0 | 1.36E07 ( 6) | 2.26E08 (1) | ||
| 3.0–4.0 | — | 2.38E08 (1) | ||
| Polletta et al., 2006 (SWIRE) | 0.60 | 0.5–1.0 | 2.24E06 ( 4) | 3.13E06 (0) |
| 1.0–2.0 | 4.15E06 (26) | 8.93E07 (0) | ||
| 2.0–3.0 | 2.93E06 (21) | 5.58E07 (4) | ||
| 3.0–4.0 | 2.93E07 ( 2) | 5.87E07 (4) | ||
| Fiore et al., 2009 (COSMOS) | 0.90 | 0.5–1.0 | 1.12E06 ( 3) | 2.09E06 (0) |
| 1.0–2.0 | 3.62E06 (34) | 2.13E07 (2) | ||
| 2.0–3.0 | 1.49E06 (16) | 6.50E07 (7) | ||
| 3.0–4.0 | — | 2.93E07 (3) | ||
| Fiore et al., 2008 (GOODS-S) | 0.04 | 0.5–1.0 | 4.73E05 ( 0) | 4.73E05 (0) |
| 1.0–2.0 | 2.65E05 (11) | 1.35E05 (0) | ||
| 2.0–3.0 | 1.01E04 (48) | 1.18E05 (0) | ||
| 3.0–4.0 | 1.99E05 ( 9) | 1.24E05 (0) | ||
| Alexander et al., 2008 (GOODS-N) | 0.04 | 2.0–2.5 | 1.50E05 ( 4) | — |
Note. — Col. (1) Sample. Col. (2) Area of sample, in units of deg-1. ’*’ — Note for our sample, the original area (3.7 deg-1) has been reduced by the fraction of original sources selected by the Y07 criteria (59) but not followed-up with Spitzer IRS; see Y07 for further details. Col. (3) Redshift range. Cols. (4–5) Space densities derived from number of sources (in parenthesis) in the rest-frame 2–10 keV luminosity ranges of - erg s-1 and - erg s-1, respectively, as shown in Fig. 3. Errors quoted are based on counting statistics only assuming Gehrels (1986), and are quoted at 1 confidence when a source exists within a bin and 3 for upper limits. Bins shown as lower limits suffer from incompleteness due to flux limits of the various surveys, as can be seen in Fig. 3.
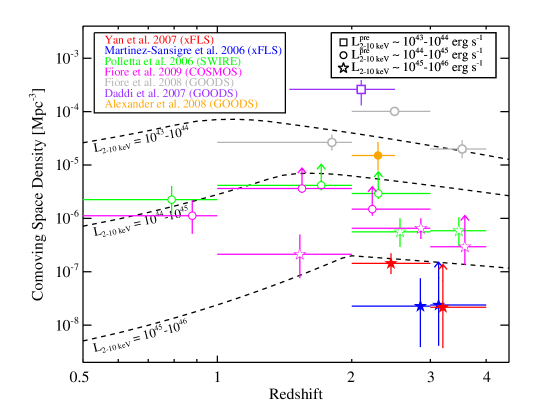
For comparison, we also show in Fig. 4 the CXRB synthesis predictions from G07 for three different luminosity ranges of Compton-thick AGN. These curves should be regarded as approximate, since considerable uncertainty remains in the redshift, luminosity, and column density distributions of the sources that comprise the full CXRB. In particular, high-luminosity AGN such as these considered here are predicted to contribute relatively little power to the overall CXRB, and conversely cannot be strongly constrained by such models. We note that G07 adopts a model for intrinsic rest-frame AGN with 1044 ergs s-1 consisting of equal parts unobscured ( cm-2), obscured Compton-thin (– cm-2), and Compton-thick AGN. They consider all AGN with cm-2 (both Compton-thin and Compton-thick) as obscured and cm-2 as unobscured, such that their model implies an expected obscured-to-unobscured ratio (hereafter simply “obscured fraction”) of 2:1 among luminous AGN with the G07 model. We stress that the space densities of unobscured QSOs (e.g., Hasinger et al., 2005; Hopkins et al., 2007) and Compton-thin QSOs (e.g., Ueda et al., 2003; La Franca et al., 2005; Silverman et al., 2008) are well-constrained by observations, while the number of Compton-thick AGN have only been inferred from modeling. We investigate here how many Compton-thick AGN might be expected from several mid-IR selected surveys. Because these three classes of AGN are equal in the G07 model, the lowest two dashed Compton-thick AGN curves also represent the expected space densities of unobscured and obscured Compton-thin QSOs; as such, the lines serve as useful visual benchmarks to assess the potential obscured fractions among various samples.
Considering first the AGN between predicted 1045–1046 ergs s-1, we find that the xFLS ULIRG sample yields a space density of (1.44) Mpc-3 at –3, where the xFLS selection technique was designed to be most sensitive. This value is already 90% of that predicted by the G07 model. However, as determined in 4.2 under the “conservative” cm-2 selection criteria, assuming the IRS-derived 5.8 m AGN continuum luminosities provide a good proxy for the expected X-ray luminosity, our subset sampling statistics only allow us to cautiously assume that 25% of the and 80% of xFLS ULIRGs here are Compton-thick at 90% confidence. Assuming equal parts unobscured and Compton-thin AGN, the above constraint on the Compton-thick space density becomes 70% that of G07, or equivalently an obscured fraction of :1 among powerful 1045–1046 ergs s-1 QSOs. Our other high-luminosity redshift bin is a factor of a few lower, but remains consistent with the –3 prediction due to potential incompleteness. In the lower range of 1044–1045 ergs s-1, however, the xFLS detects only 10% of the objects predicted by G07, illustrating that the 24m flux limit is far too shallow to detect the majority of these potential faint, high-z ULIRGs; note that the 1044–1045 ergs s-1 values from the xFLS and MS06 samples have not been plotted in Fig. 4 to reduce visual clutter, but are listed in Table 4 for completeness.
As shown in Table 4, excluding strong-PAH ULIRGs where the continuum measurements are not as well-constrained does not strongly affect our results. For instance, even if we pessimistically neglect the two strong-PAH sources in the –3 bin, the obscured fraction is still :1. We caution that these estimates reflect counting and sampling statistics for the xFLS sample only, and do not account for systematic errors such as the slope or dispersion in the - conversion, the unknown mid-IR extinction corrections, or sample selection completeness for Compton-thick AGN. As we have argued in previous sections, these effects largely skew toward substantially underestimating the true number of Compton-thick AGN and the values of such AGN, ensuring that our derived obscured fraction limits should be relatively robust. As such, our results imply that the simple mid-IR selection criterion laid out in Y07 can be highly efficient for finding large numbers of powerful Compton-thick QSOs candidates. To pick up more modest (and typical) Compton-thick QSOs, however, we must move to deeper mid-IR surveys.
Looking at the estimates from the P06 and F09 techniques, both appear to find exceptionally high numbers of obscured QSO candidates in several redshift and predicted luminosity ranges. At 1045–1046 ergs s-1, these estimates lie a factor of 3 above the G07 curve, implying a huge population of heavily-obscured AGN and an obscured fraction of perhaps 4:1. Even in the 1044–1045 ergs s-1 regime, where these surveys become incomplete, these studies still find space density lower limits at roughly comparable levels to the G07 predictions. Intriguingly, these constraints for both luminosity ranges are consistently high across several adjacent redshift bins, indirectly arguing against strong contamination by wide PAH features, which we might expect to dominate primarily around when rest-frame PAH lines pass through the 24m bandpass.
Among the deeper pencil-beam surveys, we show the results of A08 and F08 in the GOODS regions for 1044–1045 ergs s-1 AGN. The A08 sample consists of four relatively secure Compton-thick AGN candidates in the GOODS-N region at –2.5, all of which have robust optical/mid-IR spectroscopy and deep X-ray constraints. The space density of such sources is a factor of 2 higher than the G07 model curve and implies an obscured fraction of perhaps 3:1 overall. The F08 sample, on the other hand, employs the same method as F09 but to substantially fainter 24m fluxes. As such, they find Compton-thick AGN candidate space densities as high as a factor of 4–20 above the G07 predictions, implying an fraction well in excess of 5:1. In contrast to the consistency across redshift bins for the 1045–1046 ergs s-1 sources selected by this method, however, the –3 bin here is a factor of 5 higher than adjacent bins. While this could be a legitimate evolutionary trend, such a high outlier arouses suspicion and may perhaps best be explained by contamination from star-forming PAH features (e.g., Murphy et al., 2009).111111 This many heavily-obscured AGN could also be difficult to reconcile with limits imposed by the local black hole mass density (e.g., Yu & Tremaine, 2002; Marconi et al., 2004; Merloni, 2004; La Franca et al., 2005; Shankar et al., 2007). For comparison we also show the constraints of D07, who probe slightly lower AGN luminosities than F08, in the range 1043–1044 ergs s-1 over the redshift range 1.4–2.5. Their space density constraint is similarly high, with no data to compare against at higher or lower redshifts. Like F08, this dataset also presumably suffers from uncertainties both in AGN luminosity determinations and in the fraction of the sample which contribute to the AGN signal. The disparity of the F08 and D07 results in the regime highlights the need for deep mid-IR spectroscopy to dispel the current ambiguity among the fainter candidate Compton-thick AGN population.
In general, it appears that the relatively conservative xFLS criteria selects a substantial number of strong Compton-thick AGN candidates which are consistent with current predictions, but should be considered by no means exhaustive. Other techniques such as those adopted by F09 or P06 could present immensely effective methods for identifying obscured AGN population, at least for high-luminosity samples. Clearly substantial caution must be exercised until individual AGN and star formation contributions can be effectively pinned down in these samples. Nonetheless, even if only a minority of the candidates are eventually confirmed, the sheer number of luminous Compton-thick AGN candidates found by all of the various selection techniques, which only partially overlap, argues in favor of much higher obscured fractions at these extreme AGN luminosities than have been determined from X-ray-detected studies alone. Such fractions could be well in excess of 4:1 if these various techniques indeed select a high percentage of secure Compton-thick AGN. Where this leaves recent claims about the luminosity-dependence of obscuration (e.g., Hasinger, 2008) is unclear.
5. Conclusion
The Chandra X-ray upper limits we report here indicate that the substantial obscured AGN accretion found among mid-IR selected, high-redshift ULIRGs in the xFLS is likely to be Compton-thick in nature. The number density of these candidate Compton-thick AGN already nearly equals that of unobscured QSOs and obscured Compton-thin AGN e.g., such as the comparably numerous AGN studied by Weedman et al., 2006 and Brand et al., 2008, suggesting an obscured fraction of at least :1. We regard this constraint as a robust lower limit, since the assumptions made to achieve this result tend to substantially underestimate 1) the true number of Compton-thick AGN since our mid-IR selection only partially overlaps with candidate Compton-thick AGN selected by other techniques, and 2) the values of the AGN we do select. This fraction could easily exceed 4:1 among QSO-luminosity AGN if even a fraction of the candidates from various selection methods are confirmed by mid-IR spectroscopy.
We stress that the uniqueness of our sample, with its relatively simple selection criteria, complete Spitzer-IRS spectroscopy, and UV-to-radio SEDs, provides several independent lines of evidences for powerful AGN activity, and should be regarded as far more reliable than similar photometric-based samples. This is a major concern particularly for fainter mid-IR samples (e.g., D07; F08) which attempt to tease out small AGN contributions from large samples of objects with dominant starburst components. Unfortunately, the necessary mid-IR spectroscopic identification and deconvolution required to confirm these controversial faint sample results must await the launch of the James Webb Space Telescope.
Such large obscured AGN fractions at high luminosities have a few important implications. First, this result adds uncertainty to recent optical and X-ray constraints that call for some luminosity-dependence in obscuration and/or the opening angle of the putative AGN torus (so-called “receding torus” models, e.g., Lawrence, 1991; Hasinger et al., 2005; Maiolino et al., 2007; Hasinger, 2008). Whether this apparent discrepancy in number density ultimately stems from a short (but obviously ubiquitous) evolutionary stage of obscured growth or a more fundamental, long-standing property of the immediate AGN environment remains to be seen. If similar obscured fractions can be confirmed over a larger range of redshifts and luminosities, it would certainly place significantly stronger constraints on the form and nature of SMBH evolution, particularly in relation to satisfying both the local bulge luminosity and CXRB constraints. Second, the implied number of such powerful, dust-laden AGN may provide a plentiful driver for AGN feedback scenarios (e.g., Silk & Rees, 1998; Haehnelt et al., 1998; Fabian, 1999; Murray et al., 2005; Fabian et al., 2008) and may ultimately lead to considerable enrichment of intergalactic material (e.g., Davé et al., 2001; Adelberger et al., 2003; Ménard et al., 2009).
References
- Adelberger et al. (2003) Adelberger, K. L., Steidel, C. C., Shapley, A. E., & Pettini, M. 2003, ApJ, 584, 45
- Alexander et al. (2001) Alexander, D. M., et al. 2001, AJ, 122, 2156
- Alexander et al. (2003) Alexander, D. M., et al. 2003, AJ, 125, 383
- Alexander et al. (2005a) Alexander, D. M., et al. 2005a, ApJ, 632, 736
- Alexander et al. (2005b) Alexander, D. M., et al. 2005b, Nature, 434, 738
- Alexander et al. (2008) Alexander, D. M., et al. 2008, ApJ, 687, 835 (A08)
- Alonso-Herrero et al. (2006) Alonso-Herrero, A., et al. 2006, ApJ, 640, 167
- Antonucci (1993) Antonucci, R. 1993, ARA&A, 31, 473
- Balestra et al. (2005) Balestra, I., Boller, T., Gallo, L., Lutz, D., & Hess, S. 2005, A&A, 442, 469
- Barger et al. (2003) Barger, A. J., et al. 2003, AJ, 126, 632
- Bassani et al. (1999) Bassani, L., et al. 1999, ApJS, 121, 473
- Bauer et al. (2004) Bauer, F. E., et al. 2004, AJ, 128, 2048
- Bianchi et al. (2008) Bianchi, S., Chiaberge, M., Piconcelli, E., Guainazzi, M., & Matt, G. 2008, MNRAS, 386, 105
- Braito et al. (2009) Braito, V., et al. 2009, A&A, 504, 53
- Braito et al. (2004) Braito, V., et al. 2004, A&A, 420, 79
- Brand et al. (2005) Brand, K., et al. 2005, ApJ, 626, 723
- Brand et al. (2006) Brand, K., et al. 2006, ApJ, 644, 143
- Brand et al. (2008) Brand, K., et al. 2008, ApJ, 680, 119
- Brandl et al. (2006) Brandl, B. R., et al. 2006, ApJ, 653, 1129
- Brandt et al. (2001) Brandt, W. N., et al. 2001, ApJ, 558, L5
- Brandt & Hasinger (2005) Brandt, W. N. & Hasinger, G. 2005, ARA&A, 43, 827
- Buchanan et al. (2006) Buchanan, C. L., McGregor, P. J., Bicknell, G. V., & Dopita, M. A. 2006, AJ, 132, 27
- Cardelli et al. (1989) Cardelli, J. A., Clayton, G. C., & Mathis, J. S. 1989, ApJ, 345, 245
- Chiar & Tielens (2006) Chiar, J. E. & Tielens, A. G. G. M. 2006, ApJ, 637, 774
- Chiar et al. (2007) Chiar, J. E., et al. 2007, ApJ, 666, L73
- Comastri (2004) Comastri, A. 2004, in Supermassive Black Holes in the Distant Universe, ed. A. J. Barger, vol. 308 of Astrophysics and Space Science Library, 245
- Condon (1992) Condon, J. J. 1992, ARA&A, 30, 575
- Cool et al. (2006) Cool, R. J., et al. 2006, AJ, 132, 823
- Daddi et al. (2007) Daddi, E., et al. 2007, ApJ, 670, 173
- Davé et al. (2001) Davé, R., et al. 2001, ApJ, 552, 473
- Della Ceca et al. (2008) Della Ceca, R., et al. 2008, Memorie della Societa Astronomica Italiana, 79, 65, ArXiv:0709.3060
- Desai et al. (2007) Desai, V., et al. 2007, ApJ, 669, 810
- Dey et al. (2008) Dey, A., et al. 2008, ApJ, 677, 943
- Donley et al. (2008) Donley, J. L., Rieke, G. H., Pérez-González, P. G., & Barro, G. 2008, ApJ, 687, 111
- Donley et al. (2007) Donley, J. L., Rieke, G. H., Pérez-González, P. G., Rigby, J. R., & Alonso-Herrero, A. 2007, ApJ, 660, 167
- Fabian (1999) Fabian, A. C. 1999, MNRAS, 308, L39
- Fabian et al. (2008) Fabian, A. C., Vasudevan, R. V., & Gandhi, P. 2008, MNRAS, 385, L43
- Fadda et al. (2004) Fadda, D., Jannuzi, B., Ford, A., & Storrie-Lombardi, L. J. 2004, AJ, 128, 1
- Farrah et al. (2003) Farrah, D., Afonso, J., Efstathiou, A., Rowan-Robinson, M., Fox, M., & Clements, D. 2003, MNRAS, 343, 585
- Farrah et al. (2007) Farrah, D., et al. 2007, ApJ, 667, 149
- Ferrarese & Merritt (2000) Ferrarese, L. & Merritt, D. 2000, ApJ, 539, L9
- Fiore et al. (2008) Fiore, F., et al. 2008, ApJ, 672, 94 (F08)
- Fiore et al. (2009) Fiore, F., et al. 2009, ApJ, 693, 447 (F09)
- Franceschini et al. (2003) Franceschini, A., et al. 2003, MNRAS, 343, 1181
- Gehrels (1986) Gehrels, N. 1986, ApJ, 303, 336
- Genzel et al. (1998) Genzel, R., et al. 1998, ApJ, 498, 579
- Genzel & Cesarsky (2000) Genzel, R. & Cesarsky, C. J. 2000, ARA&A, 38, 761
- Gilli et al. (2007) Gilli, R., Comastri, A., & Hasinger, G. 2007, A&A, 463, 79 (G07)
- Gorjian et al. (2001) Gorjian, V., Turner, J. L., & Beck, S. C. 2001, ApJ, 554, L29
- Guainazzi et al. (2005) Guainazzi, M., Matt, G., & Perola, G. C. 2005, A&A, 444, 119
- Haas et al. (2007) Haas, M., et al. 2007, A&A, 473, 369
- Haehnelt et al. (1998) Haehnelt, M. G., Natarajan, P., & Rees, M. J. 1998, MNRAS, 300, 817
- Hao et al. (2007) Hao, L., et al. 2007, ApJ, 655, L77
- Hasinger (2008) Hasinger, G. 2008, A&A, 490, 905
- Hasinger et al. (2005) Hasinger, G., Miyaji, T., & Schmidt, M. 2005, A&A, 441, 417
- Heckman et al. (2005) Heckman, T. M., Ptak, A., Hornschemeier, A., & Kauffmann, G. 2005, ApJ, 634, 161
- Hopkins et al. (2003) Hopkins, A. M., et al. 2003, ApJ, 599, 971
- Hopkins et al. (2007) Hopkins, P. F., Richards, G. T., & Hernquist, L. 2007, ApJ, 654, 731
- Imanishi (2006) Imanishi, M. 2006, AJ, 131, 2406
- Imanishi et al. (2006) Imanishi, M., Dudley, C. C., & Maloney, P. R. 2006, ApJ, 637, 114
- Imanishi et al. (2008) Imanishi, M., et al. 2008, PASJ, 60, 489
- Imanishi et al. (2003) Imanishi, M., Terashima, Y., Anabuki, N., & Nakagawa, T. 2003, ApJ, 596, L167
- Iwasawa et al. (2005) Iwasawa, K., Crawford, C. S., Fabian, A. C., & Wilman, R. J. 2005, MNRAS, 362, L20
- Iwasawa et al. (2001) Iwasawa, K., Fabian, A. C., & Ettori, S. 2001, MNRAS, 321, L15
- Iwasawa et al. (2009) Iwasawa, K., et al. 2009, ApJ, 695, L103
- Komossa et al. (2003) Komossa, S., et al. 2003, ApJ, 582, L15
- Kormendy & Richstone (1995) Kormendy, J. & Richstone, D. 1995, ARA&A, 33, 581
- Kraft et al. (1991) Kraft, R. P., Burrows, D. N., & Nousek, J. A. 1991, ApJ, 374, 344
- La Franca et al. (2005) La Franca, F., et al. 2005, ApJ, 635, 864
- Lacy et al. (2007) Lacy, M., et al. 2007, ApJ, 669, L61
- Lacy et al. (2004) Lacy, M., et al. 2004, ApJS, 154, 166
- Lanzuisi et al. (2009) Lanzuisi, G., et al. 2009, A&A, 498, 67
- Lawrence (1991) Lawrence, A. 1991, MNRAS, 252, 586
- Lehmer et al. (2008) Lehmer, B. D., et al. 2008, ApJ, 681, 1163
- Lockman & Condon (2005) Lockman, F. J. & Condon, J. J. 2005, AJ, 129, 1968
- Luo et al. (2008) Luo, B., et al. 2008, ApJS, 179, 19
- Lutz et al. (1998) Lutz, D., Spoon, H. W. W., Rigopoulou, D., Moorwood, A. F. M., & Genzel, R. 1998, ApJ, 505, L103
- Lutz et al. (2004) Lutz, D., Maiolino, R., Spoon, H. W. W., & Moorwood, A. F. M. 2004, A&A, 418, 465
- Magorrian et al. (1998) Magorrian, J., et al. 1998, AJ, 115, 2285
- Maiolino et al. (2007) Maiolino, R., et al. 2007, A&A, 468, 979
- Malizia et al. (2009) Malizia, A., et al. 2009, MNRAS, 399, 944
- Marconi et al. (2004) Marconi, A., et al. 2004, MNRAS, 351, 169
- Martínez-Sansigre et al. (2006) Martínez-Sansigre, A., et al. 2006, MNRAS, 370, 1479 (M06)
- Martínez-Sansigre et al. (2007) Martínez-Sansigre, A., et al. 2007, MNRAS, 379, L6
- Martínez-Sansigre et al. (2008) Martínez-Sansigre, A., Lacy, M., Sajina, A., & Rawlings, S. 2008, ApJ, 674, 676
- McKernan et al. (2009) McKernan, B., Ford, K. E. S., Chang, N., & Reynolds, C. S. 2009, MNRAS, 394, 491
- Meléndez et al. (2008) Meléndez, M., et al. 2008, ApJ, 682, 94
- Ménard et al. (2009) Ménard, B., Scranton, R., Fukugita, M., & Richards, G. 2009, ArXiv:0902.4240
- Merloni (2004) Merloni, A. 2004, MNRAS, 353, 1035
- Molina et al. (2009) Molina, M., et al. 2009, MNRAS, 399, 1293
- Moustakas et al. (2006) Moustakas, J., Kennicutt, R. C., Jr., & Tremonti, C. A. 2006, ApJ, 642, 775
- Murphy et al. (2009) Murphy, E. J., et al. 2009, ApJ, 698, 1380
- Murphy & Yaqoob (2009) Murphy, K. D. & Yaqoob, T. 2009, MNRAS, 297, 1549
- Murray et al. (2005) Murray, N., Quataert, E., & Thompson, T. A. 2005, ApJ, 618, 569
- Nandra & Iwasawa (2007) Nandra, K. & Iwasawa, K. 2007, MNRAS, 382, L1
- Nardini et al. (2008) Nardini, E., et al. 2008, MNRAS, 385, L130
- Nenkova et al. (2002) Nenkova, M., Ivezić, Ž., & Elitzur, M. 2002, ApJ, 570, L9
- Nenkova et al. (2008) Nenkova, M., Sirocky, M. M., Nikutta, R., Ivezić, Ž., & Elitzur, M. 2008, ApJ, 685, 160
- Netzer et al. (2006) Netzer, H., Mainieri, V., Rosati, P., & Trakhtenbrot, B. 2006, A&A, 453, 525
- O’Dowd et al. (2009) O’Dowd, M. J., et al. 2009, ApJ, 705, 885
- Page et al. (2004) Page, M. J., Stevens, J. A., Ivison, R. J., & Carrera, F. J. 2004, ApJ, 611, L85
- Panessa et al. (2006) Panessa, F., et al. 2006, A&A, 455, 173
- Peck et al. (2008) Peck, R., Olsen, C., & Devore, J. L. 2008, Introduction to Statistics and Data Analysis, 3rd ed. (Stamford, CT: Cengage Learning)
- Pier & Krolik (1992) Pier, E. A. & Krolik, J. H. 1992, ApJ, 401, 99
- Polletta et al. (2006) Polletta, M. d. C., et al. 2006, ApJ, 642, 673
- Polletta et al. (2008) Polletta, M., et al. 2008, A&A, 492, 81
- Rigby et al. (2005) Rigby, J. R., et al. 2005, ApJ, 627, 134
- Risaliti et al. (1999) Risaliti, G., Maiolino, R., & Salvati, M. 1999, ApJ, 522, 157
- Risaliti et al. (2006) Risaliti, G., et al. 2006, MNRAS, 365, 303
- Roche & Aitken (1985) Roche, P. F. & Aitken, D. K. 1985, MNRAS, 215, 425
- Ruiz et al. (2007) Ruiz, A., Carrera, F. J., & Panessa, F. 2007, A&A, 471, 775
- Sajina et al. (2007) Sajina, A., et al. 2007, ApJ, 664, 713 (S07)
- Sajina et al. (2008) Sajina, A., et al. 2008, ApJ, 683, 659 (S08)
- Sajina et al. (2009) Sajina, A., et al. 2009, ApJ, 703, 370
- Sanders & Mirabel (1996) Sanders, D. B. & Mirabel, I. F. 1996, ARA&A, 34, 749
- Sani et al. (2008) Sani, E., et al. 2008, ApJ, 675, 96
- Shankar et al. (2007) Shankar, F., Weinberg, D. H., & Miralda-Escude’, J. 2007, ArXiv:0710.4488
- Shi et al. (2006) Shi, Y., et al. 2006, ApJ, 653, 127
- Silk & Rees (1998) Silk, J. & Rees, M. J. 1998, A&A, 331, L1
- Silverman et al. (2008) Silverman, J. D., et al. 2008, ApJ, 679, 118
- Smail et al. (1997) Smail, I., Ivison, R. J., & Blain, A. W. 1997, ApJ, 490, L5
- Soifer et al. (2003) Soifer, B. T., et al. 2003, AJ, 126, 143
- Soifer et al. (2000) Soifer, B. T., et al. 2000, AJ, 119, 509
- Spoon et al. (2002) Spoon, H. W. W., et al. 2002, A&A, 385, 1022
- Spoon et al. (2004) Spoon, H. W. W., et al. 2004, ApJS, 154, 184
- Stern et al. (2005) Stern, D., et al. 2005, ApJ, 631, 163
- Stevens et al. (2005) Stevens, J. A., et al. 2005, MNRAS, 360, 610
- Sturm et al. (2006) Sturm, E., et al. 2006, ApJ, 642, 81
- Szokoly et al. (2004) Szokoly, G. P., et al. 2004, ApJS, 155, 271
- Teng et al. (2005) Teng, S. H., et al. 2005, ApJ, 633, 664
- Teng et al. (2009) Teng, S. H., et al. 2009, ApJ, 691, 261
- Teplitz et al. (2007) Teplitz, H. I., et al. 2007, ApJ, 659, 941
- Tozzi et al. (2006) Tozzi, P., et al. 2006, A&A, 451, 457
- Tran et al. (2001) Tran, Q. D., et al. 2001, ApJ, 552, 527
- Treister & Urry (2005) Treister, E. & Urry, C. M. 2005, ApJ, 630, 115
- Ueda et al. (2003) Ueda, Y., Akiyama, M., Ohta, K., & Miyaji, T. 2003, ApJ, 598, 886
- Vega et al. (2008) Vega, O., et al. 2008, A&A, 484, 631
- Vignati et al. (1999) Vignati, P., et al. 1999, A&A, 349, L57
- Watabe et al. (2009) Watabe, Y., et al. 2009, MNRAS, 396, L1
- Weedman et al. (2006) Weedman, D. W., et al. 2006, ApJ, 651, 101
- Whittet (2003) Whittet, D. C. B. 2003, Dust in the galactic environment, ed. D.C.B. Whittet, Bristol: Institute of Physics (IOP) Publishing, 2003 Series in Astronomy and Astrophysics
- Wilman et al. (2003) Wilman, R. J., Fabian, A. C., Crawford, C. S., & Cutri, R. M. 2003, MNRAS, 338, L19
- Worsley et al. (2005) Worsley, M. A., et al. 2005, MNRAS, 357, 1281
- Xu et al. (1999) Xu, C., Livio, M., & Baum, S. 1999, AJ, 118, 1169
- Yan et al. (2004) Yan, L., et al. 2004, ApJS, 154, 75
- Yan et al. (2005) Yan, L., et al. 2005, ApJ, 628, 604
- Yan et al. (2007) Yan, L., et al. 2007, ApJ, 658, 778 (Y07)
- Yu & Tremaine (2002) Yu, Q. & Tremaine, S. 2002, MNRAS, 335, 965