Growth Dynamics of Photoinduced Domains in Two-Dimensional Charge-Ordered Conductors Depending on Stabilization Mechanisms
Abstract
Photoinduced melting of horizontal-stripe charge orders in quasi-two-dimensional organic conductors -(BEDT-TTF)2RbZn(SCN)4 [BEDT-TTF=bis(ethylenedithio)tetrathiafulvalene] and -(BEDT-TTF)2I3 is investigated theoretically. By numerically solving the time-dependent Schrdinger equation, we study the photoinduced dynamics in extended Peierls-Hubbard models on anisotropic triangular lattices within the Hartree-Fock approximation. The melting of the charge order needs more energy for -(BEDT-TTF)2RbZn(SCN)4 than for -(BEDT-TTF)2I3, which is a consequence of the larger stabilization energy in -(BEDT-TTF)2RbZn(SCN)4. After local photoexcitation in the charge ordered states, the growth of a photoinduced domain shows anisotropy. In -(BEDT-TTF)2RbZn(SCN)4, the domain hardly expands to the direction perpendicular to the horizontal-stripes. This is because all the molecules on the hole-rich stripe are rotated in one direction and those on the hole-poor stripe in the other direction. They modulate horizontally connected transfer integrals homogeneously, stabilizing the charge order stripe by stripe. In -(BEDT-TTF)2I3, lattice distortions locally stabilize the charge order so that it is easily weakened by local photoexcitation. The photoinduced domain indeed expands in the plane. These results are consistent with recent observation by femtosecond reflection spectroscopy.
1 Introduction
Low-dimensional organic conductors are known to offer a playground for studying strongly correlated electron systems in which various interesting ground states emerge[1, 2]. The typical examples are Mott and charge-ordered insulating states, where electron-electron as well as electron-phonon (e-ph) interactions have important roles. In such systems, photoirradiation may induce a phase transition, which has been extensively studied recently[3, 4, 5, 6] since it will lead to novel transient phenomena and possible control of various functions of materials.
The quasi-two-dimensional organic conductors -(BEDT-TTF)2RbZn(SCN)4 (abbreviated as -RbZn hereafter) and -(BEDT-TTF)2I3 (as -I3) are typical compounds that exhibit a charge order (CO)[7, 8, 9, 10]. They consist of stacking layers of monovalent anions and donor BEDT-TTF molecules whose -band is 3/4-filled. The photoinduced melting of the COs in these systems has recently been observed by using femtosecond reflection spectroscopy[6, 11]. It shows a marked difference between their photoinduced dynamics. For -I3, a semimacroscopic metallic domain is generated, whereas the CO only locally melts for -RbZn. In particular, the dynamics in -I3 shows critical slowing down and strong dependence on the excitation intensity and temperature[6].
This clear difference is considered to originate from different roles of lattice distortions in stabilizing the COs. In fact, the CO transition in -RbZn is a first-order metal-insulator transition with large structural distortion at K[12, 13]. On the other hand, -I3 undergoes small lattice distortion at the CO transition with K[14, 15]. In both salts, a horizontal-stripe CO is formed, as confirmed by several experiments such as X-ray scattering[13, 15] and Raman spectroscopy[16, 17].
Theoretically, CO phenomena have been investigated by using extended Hubbard models including on-site () and intersite () Coulomb interactions[18, 19, 20, 21, 22, 23, 24, 25, 26, 27, 28, 29, 30, 31, 32, 33, 34, 35]. The stability of various CO patterns in some members of (BEDT-TTF)2X has been discussed first within the Hartree approximation by considering realistic band structures of (BEDT-TTF)2X[1, 18]. The horizontal-stripe CO is shown to be stabilized in -RbZn and also in -I3[18] if the transfer integrals are based on the low-temperature crystal structures with lattice distortions implicitly included. The effects of e-ph interactions on the horizontal COs have been investigated by the Hartree-Fock approximation and exact diagonalization[30, 32, 33, 31, 34]. Here the transfer integrals are based on the high-temperature crystal structures if the lattice is undistorted. The results show that charge frustration due to the Coulomb interactions on a triangular lattice and lattice distortion relieving the frustration are essential for -RbZn, while the low-symmetry configuration of transfer integrals is important for -I3. These theoretical studies consistently interpret the experimental findings including the large discontinuity at the CO transition in -RbZn and the difference between the behaviors of the spin degrees of freedom in the two salts below [12, 36]. Therefore, it is of great importance to investigate the photoinduced melting of the COs and to compare their dynamics.
In this paper, we investigate the photoinduced melting dynamics in -RbZn and in -I3 using the time-dependent Schrdinger equation for extended Hubbard models with Peierls-type e-ph couplings within the Hartree-Fock approximation. It is found that the CO in -RbZn is more stable against photoexcitation than that in -I3, which is consistent with the experimental results[6]. Their dynamics show different behaviors owing to different roles of e-ph couplings for the COs and different underlying crystal structures. In particular, a photoinduced domain with suppressed CO grows anisotropically in -RbZn, whereas it grows isotropically in -I3. This suggests that a macroscopic domain is more easily created in -I3 than in -RbZn. In §2, the extended Peierls-Hubbard model is defined. The numerical method for solving the time-dependent Schrdinger equation is also given. After presenting linear absorption spectra in §3, we show photoinduced dynamics during and after a spatially uniform, oscillating electric field is introduced in §4. The growth of a photoinduced domain after local melting of the CO is discussed in §5. Section 6 is devoted to a summary.
2 Extended Peierls-Hubbard Model on Triangular Lattice
In order to describe the horizontal CO with lattice distortion in -RbZn and -I3, we consider the following extended Peierls-Hubbard model[30, 32, 33, 31, 34]
| (1) |
with
| (2) | |||||
| (3) |
where represents the summation over pairs of neighboring sites, denotes the creation (annihilation) operator for an electron with spin at the th site, , and . The electron density is fixed at 3/4 filling. The on-site repulsion is denoted by . For the intersite Coulomb interactions , we consider nearest-neighbor interactions in the vertical direction and in the diagonal direction, as shown in Fig. 1(a). The e-ph coupling constant, lattice displacement, elastic constant and bare phonon frequency are denoted by , , and , respectively. We introduce new variables by and . The notations of the transfer integrals , and are the same as those in refs. 32 and 33 for both compounds.
The structures of -RbZn and -I3 in the high- and low-temperature phases are schematically shown in Fig. 1. In the metallic phase of -RbZn, there are two kinds of transfer integrals and for the diagonal and vertical bonds, respectively, while the CO transition doubles the unit cell in the -direction and six transfer integrals appear at low temperatures. On the other hand, the unit cell of -I3 contains four molecules in both phases. According to the X-ray structural analysis[15], sites A and A′ are equivalent in the metallic phase owing to inversion symmetry, while the symmetry breaks below the CO transition temperature.
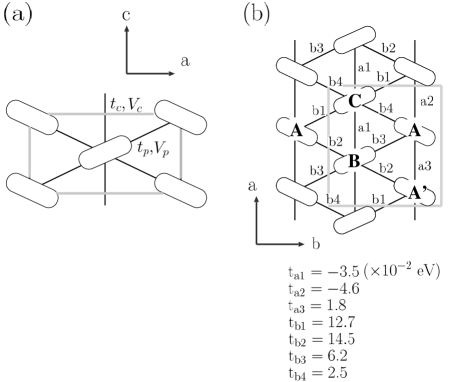
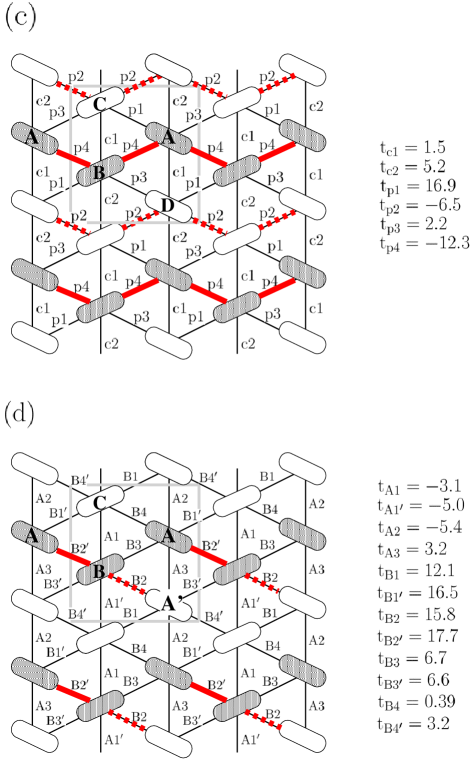
In the previous studies[30, 32, 33], we consider three types of e-ph couplings , , and for -RbZn, and two types of e-ph couplings and for -I3 in order to investigate the roles of all the lattice distortions on the stability of the COs. For -RbZn, the high-temperature structure has high symmetry, where several patterns of COs are nearly degenerate because of the charge frustration. The lattice distortions relieve the frustration. We found that , which comes from molecular rotation[30, 31], is the most important for realizing the horizontal CO. As shown in Fig. 1(c), this distortion homogeneously modulates the horizontally connected transfer integrals[30, 31], and , by which the CO is globally stabilized. For -I3, on the other hand, lattice effects are relatively small and the low-symmetry configuration of transfer integrals stabilizes the horizontal CO[32, 34], as explained below. Charge disproportionation between sites B and C exists even in the metallic phase[38, 39, 40, 41] because the large and nonequivalent transfer integrals and form a zigzag chain[15], as seen in Fig. 1(b). Since is larger than in the chain, site B (C) becomes hole-rich (hole-poor) so as to gain the kinetic energy. The appearance of the horizontal CO breaks the equivalence of sites A and A′. The e-ph couplings and stabilize this CO. However, the configuration of large transfer integrals is not along the hole-rich stripes in contrast to the case of -RbZn. In other words, the CO is locally stabilized in -I3: the distortion causing () in Fig. 1(d) locally strengthens the bond B (B), which is regarded as the formation of a local singlet on the bond B. As a consequence, site A (A′) becomes hole-rich (hole-poor). With these facts in mind, in the present paper we consider only and as the e-ph coupling in -RbZn and -I3, for simplicity. Because only one phonon mode is taken into account, we set the bare phonon frequency at .
The photoexcitation is introduced by the Peierls phase factors of the transfer integrals in eq. (2). Here i,j denotes the position vector from the th site to the th site. The vector potential is given by,
| (4) |
| (5) |
where ext and is the amplitude and frequency, respectively, of the time-dependent electric field . In eq. (5), we define the pulse width with being an integer. is the Heaviside step function, for and for . We use , , and the intermolecular distance along the -axis of -RbZn and that along the -axis of -I3 as the unit of length. Furthermore, the intermolecular distance along the -axis of -RbZn and that along the -axis of -I3 are set at twice the unit length. By these definitions, parameters are given in units of eV unless otherwise noted.
The time evolution of the system is calculated as follows. For the electronic part, we use the time-dependent Schrdinger equation,
| (6) |
where denotes the time-ordering operator, the -th one-particle state with spin at time , and the electronic part in the Hartree-Fock approximation.
For the lattice part, we solve the classical equation of motion by the leapfrog method[42]. In the case of -RbZn, we assume that for the th unit cell the transfer integrals on the two -bonds connected to site B and those on the two -bonds connected to site C are given by and , respectively. The equation of motion for is then written as,
| (7) |
where we write the force for -RbZn as,
| (8) |
Here is the phonon mass, and is the Slater-determinant composed of the one-particle states . In the case of -I3, we set and . The equation of motion for thus reads,
| (9) |
where and is defined as in eq. (8). We note that for both compounds the initial state is the horizontal CO state where the lattice displacements do not depend on [30, 31, 32, 33, 34]. When the uniform time-dependent electric field is applied, their response is still uniform. However, they become nonuniform when the electric field is applied locally as in §5.
In the actual calculations, we first obtain or by using the wave function . Then, or at is calculated, which is accurate to the order of . The wave function is obtained from eq. (6) by,
| (10) |
whose error is of the order of . In the above equation, we use where is constructed so that it is accurate to the first order of . The exponential operator is expanded with time slice until the norm of the wave function becomes unity with sufficient accuracy. The obtained has an error of the order of .
In this paper, the phonon frequency is used for both compounds. We set and for -RbZn. For the transfer integrals in -I3, we use the values shown in Fig. 1(b). The system size is fixed at sites and the periodic boundary condition is imposed. The interaction strengths and the e-ph coupling constants are chosen at , , , , and throughout the study. These parameters give the horizontal CO ground states for both compounds[30, 32].
3 Linear Absorption Spectra
First, we discuss linear absorption spectra, which correspond to optical conductivity spectra. For this purpose, we replace the electric field in eq. (5) by the one with a damping factor,
| (11) |
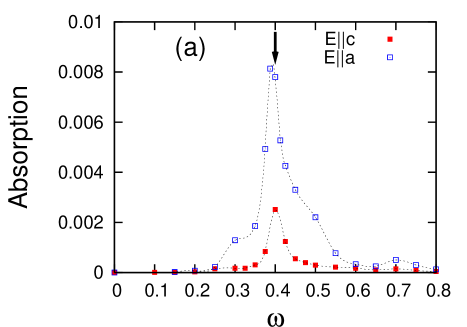
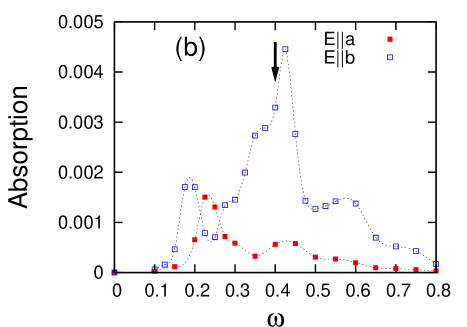
and calculate the increment in the total energy due to with small at sufficiently large so that the total energy converges. We use =0.002 and =0.02 to obtain results shown in Fig. 2. In both cases of -RbZn and -I3, the absorption is larger for the polarization parallel to the stripes, i.e., along the a- and b-axes, respectively, than for the polarization perpendicular to them, i.e., along the c- and a-axes, respectively. This is because the transfer integrals on the diagonal bonds are larger than those on the vertical bonds. The absorption spectra with polarization parallel to the stripes have similar structures with resonance peaks located at around for both compounds. Therefore, in the following we show results obtained by the electric field with and polarization parallel to the stripes.
4 Photoinduced Melting Dynamics
Next, we discuss photoinduced melting dynamics. Figure 3 shows the time evolution of the hole densities and the lattice distortions during and after the photoexcitation with ( corresponding to 155 fs) which is comparable to the experimental pulse width[6].
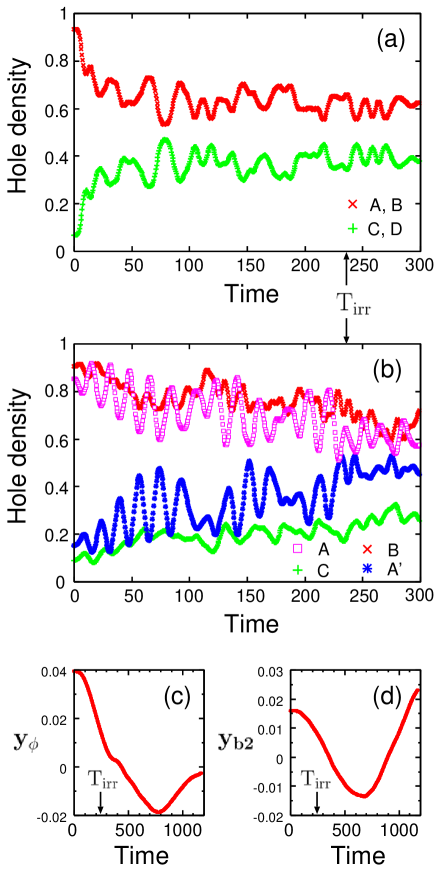
The unit of time is , so that corresponds to 1 ps. For both salts, the COs are weakened by photoexcitation, as seen in Figs. 3(a) and 3(b). The amplitude of the electric field is chosen at for -RbZn and for -I3, which is near the critical value for melting the CO. The increment in the total energy per site is 0.098 and 0.042, respectively.
For -RbZn, there are two distinct hole densities at since each stripe consists of sites with equal hole densities. This is also true at if the polarization of is parallel to the stripes as in Fig. 3(a), whereas the hole densities on the four sites in the unit cell become different when the polarization is perpendicular to the stripes. For -I3, on the other hand, the four sites are already distinct at because of the low symmetry of the crystal structure.
As for the time dependence of the hole densities, resonantly excited dynamics is clearly seen for -I3 especially in the oscillation of the hole densities on sites A and A′, the periods of which are nearly equal to that of the electric field being 15.7. For -RbZn, the charge dynamics is more complex than that for -I3 although is near the resonance peak of the linear absorption spectrum. Such a difference is also visible in results obtained by the exact many-electron wave functions on small clusters of 12 sites[43], where the origin of the different behaviors is interpreted with the distribution of energy levels above the ground state, which is denser in -RbZn than in -I3. This is because the high symmetry of the undistorted structure in -RbZn causes charge frustration. Therefore, a larger number of excited states are nearly degenerate and involved in the photoinduced dynamics in -RbZn, which results in complex charge dynamics.
The time dependence of the lattice distortions and is shown in Figs. 3(c) and 3(d), respectively. Since the COs are almost completely destroyed in the present parameters, the displacements become zero at some although they oscillate with periods longer than by phonon softening, which are much longer than the timescales of charge-transfer excitations. For , the oscillation period is about 1 ps for both compounds, which is comparable to the experimentally observed value of 0.7 ps (48 cm-1) in the time evolutions of reflectivity spectra[6].
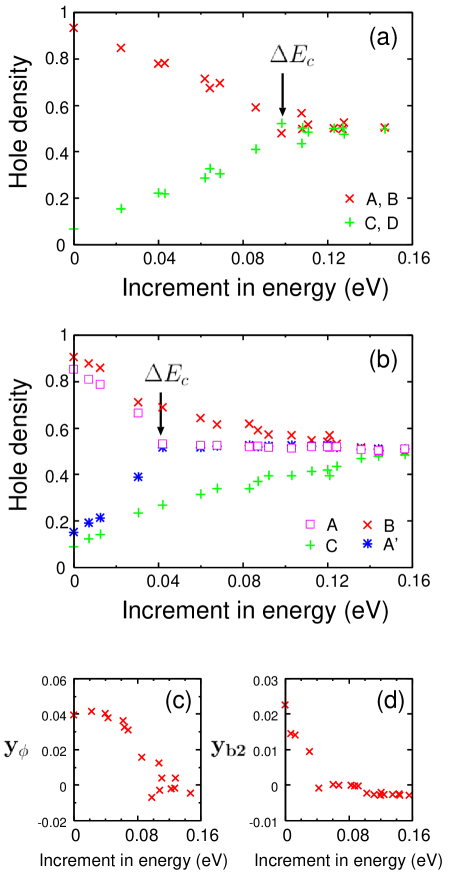
In order to compare the efficiency of photoinduced melting for -RbZn and that for -I3, we show time-averaged hole densities as a function of in Figs. 4(a) and 4(b). Here the averages are taken after over the period of . There is a critical value above which the horizontal CO disappears. The value for -RbZn, , is larger than that for -I3, . This is a consequence of the larger lattice stabilization energy for the horizontal CO in -RbZn than that in -I3[30, 32, 33, 31, 34]. We notice that this inequality generally holds for any excitation frequency and for any polarization (not shown). The robustness of the CO in -RbZn compared to that in -I3 against the photoirradiation has been observed in the femtosecond spectroscopy[6]. The efficiency of the photoinduced metallic state by eV is evaluated as 100 (-RbZn) and 250 (-I3) molecules/photon. The values of in our calculations are, however, one order of magnitude larger than the experimentally estimated ones. This may be due to the Hartree-Fock approximation, since becomes smaller in our recent study based on the exact many-electron wave functions[43]. Effects of thermal fluctuations and the experimental estimation itself, which generally contains an error depending on the estimation of the penetration depth, are also possible reasons for the discrepancy.
For -RbZn, the time-averaged hole distribution becomes uniform above . For -I3, on the other hand, the averaged hole densities on sites A and A′ become equal above while the charge disproportionation on sites B and C remains for larger values of . This is reminiscent of the fact that the charge disproportionation exists even in the high-temperature metallic phase of -I3 because of low-symmetry configuration of transfer integrals[38, 39, 40, 41]. If we increase further, the hole densities on the four sites finally merge into .
In Figs. 4(c) and 4(d), we show the averaged lattice displacements which indicate that both and vanish at around . This is reasonable because the distortion is essential for stabilizing the horizontal CO in -RbZn, while the distortion breaks the inversion symmetry that guarantees the equivalence of hole densities on sites A and A′ in -I3.
5 Domain Growth after Local Photoexcitation
Recall that the mechanisms for stabilizing the COs by lattice distortions are different in the two salts. In -RbZn, the whole hole-rich (hole-poor) stripe is stabilized by strengthening (weakening) the horizontally connected p4 (p2) bonds. In -I3, the metallic phase without lattice distortion already possesses a hole-rich site B and a hole-poor site C by the relation . The hole-rich site A and the hole-poor site bridged by the site B are locally stabilized by strengthening the bond B2′ and weakening the bond B2. Thus, local photoexcitations would easily weaken the CO in -I3, but the CO in -RbZn would be robust.
Then, we investigate the growth of photoinduced domains with weakened CO after local photoexcitation, by modifying the model in eq. (2) through the introduction of the Peierls phase factors only on the bonds that connect four sites within a unit cell of the -site system. The phase factor is set at unity on all the other bonds. The time evolution is calculated by the method explained in §2. In Fig. 5, we show snapshots of the hole densities at , and , from which those at are subtracted, , during and after the local photoexcitation with and . The polarization is parallel to the stripes. In the figures, the bonds on which the photoexcitation is applied are located at (7.5,7), (7.5,7.5), and (7.5,8). Here, the location of the bond between the sites at and is denoted by . For -RbZn (-I3), these bonds correspond to B-D (B-A′), B-A, and C-A or p3 (B2), p4 (b3), and p1 (b4), respectively, in Fig. 1. In order to compare the growth dynamics, we set for -RbZn and for -I3, which lead to the ratio for both compounds. Here is the value obtained in §4 by the uniform photoexcitation, whereas is the increment in the total energy per site after the local photoexcitation.
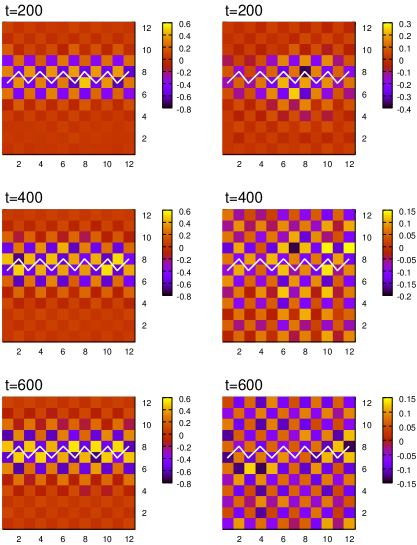
In Fig. 5, the growth of the domain shows anisotropy, which is pronounced in -RbZn. Namely, the growth of the domain is faster to the direction parallel to the stripes than to that perpendicular to the stripes for both compounds. This is caused by the anisotropy in the transfer integrals which are larger for the - and -bonds than for the - and -bonds in -RbZn and -I3, respectively.
For -RbZn, the hole densities largely deviate from those at only on the horizontal rows near the four photoexcited sites. The amount of change reaching 0.5 means that the CO is completely destroyed in this region. In the vertical direction, however, the growth is strongly suppressed. For -I3, the photoinduced domain expands over the whole system at although the largest amount of change in the hole densities is smaller than that in -RbZn.
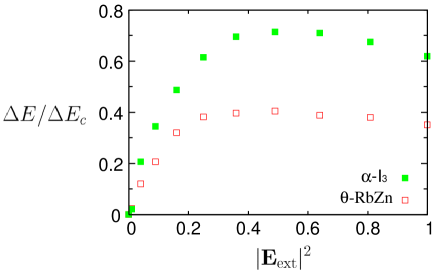
In order to analyze the domain growth more quantitatively, we show as a function of in Fig. 6. For both compounds, has a maximum value as explained in Appendix, which is below unity. Thus, the CO is not globally destroyed by the local photoexcitation with small pulse width. The maximum value is larger for -I3 than for -RbZn, which means that it is more difficult to weaken the CO in -RbZn by the local photoexcitation with this pulse width.
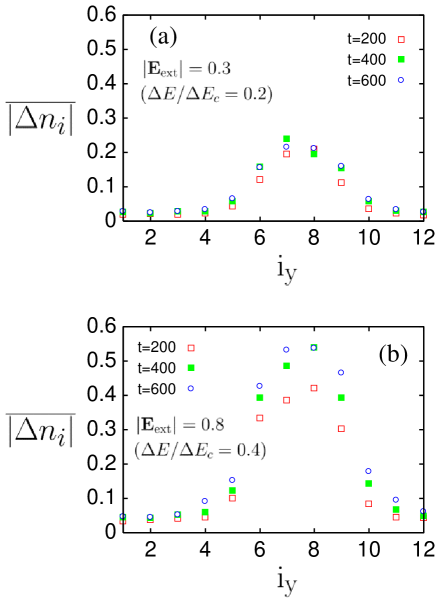
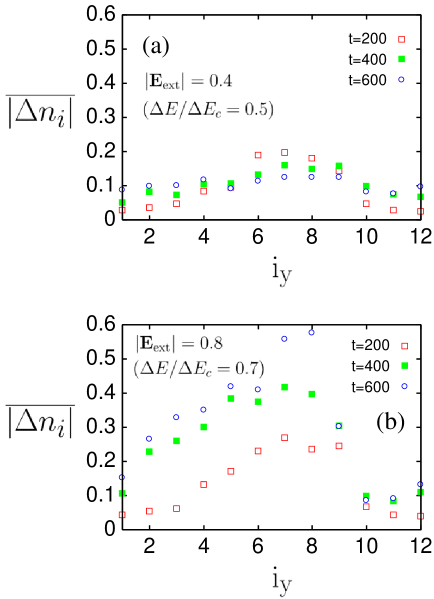
The absolute values of the differences between the hole densities at and those at and 600 are averaged over the direction parallel to the stripes and denoted by :
| (12) |
where is the number of sites along the - and -axes for -RbZn and -I3, respectively. Thus, we can measure the growth of the photoinduced domain to the direction perpendicular to the stripes. The values are plotted as a function of in Fig. 7 for -RbZn and in Fig. 8 for -I3, where is the coordinate along the - and -axes (which are perpendicular to the stripes) for -RbZn and -I3, respectively, as used in Fig. 5. Although the charge order on the stripes containing the photoexcited bonds (7.5,7), (7.5,7.5), and (7.5,8) is weakened and the quantities at and 8 are increased by increasing from 0.3 to 0.8 for -RbZn, the photoinduced domain remains localized near and 8. In other words, the photoinduced domain hardly grows to the direction perpendicular to the stripes. The influence of the local photoexcitation is confined in a region near the photoexcited bonds. This property prevents from becoming large beyond the maximum value, as shown in Fig. 6. For -I3, the domain growth is qualitatively different from that in -RbZn. The photoinduced domain expands to the vertical direction as shown in Fig. 8(a) for , although the values of are relatively small. When we increase , a large region of suppressed CO (i.e., large ) is created as shown in Fig. 8(b). It is noted that the -dependence of is asymmetric for -I3. The photoinduced domain expands to the direction of decreasing more easily than to the direction of increasing . This feature is generally observed irrespective of the choice of photoexcited bonds because it reflects the asymmetry of the charge distribution that allows the ferroelectricity[44]. Let us focus a region near the bond connecting sites A and B that has the largest transfer integral (see Fig. 1). The transfer integrals and connecting sites A and C are different from and connecting sites B and . When the local distortion at site B making is weakened by photoexcitation, the hole is locally transferred from site A through site B to site A′. This corresponds to the direction that weakens the ferroelectric polarization. This results in the asymmetry of . It is in contrast to for -RbZn, where the transfer integrals connecting sites A and C are the same as connecting sites B and D.
These numerical results suggest that a macroscopic domain is much more easily created in -I3 than in -RbZn. They are consistent with the experimental observations by the time evolutions of reflectivity spectra[6], which indicate the growth of a metallic domain only for -I3, although spatial inhomogeneity is not directly observed. The critical slowing down observed in -I3[6] is beyond the scope of the present study. If we consider it theoretically, we would need to treat larger system and domain sizes. Effects of relaxation, which are not taken into account here, may also be important for the dynamics on longer timescales.
The different growth dynamics is caused by the different mechanisms of stabilizing the COs: the CO in -RbZn is stabilized stripe by stripe through the homogeneous modulation of transfer integrals along the stripes, while the CO in -I3 is stabilized locally, as explained in §2. The growth dynamics is thus qualitatively unchanged even if we use different excitation frequencies and polarizations in the calculations.
6 Summary
We have investigated the photoinduced melting dynamics of COs in quasi-two-dimensional organic conductors -RbZn and -I3. Although they show COs with similar horizontal-stripe patterns, relative importance of e-ph couplings and their configurations of transfer integrals in stabilizing the COs are quite different [30, 32, 33, 31, 34]. By numerically solving the time-dependent Schdinger equation within the Hartree-Fock approximation, charge and lattice dynamics are obtained in the extended Peierls-Hubbard models during and after the oscillating electric field is introduced with and without spatial dependence. We find different photoinduced dynamics in these salts, which originate from different mechanisms of stabilizing the COs by lattice distortions.
In the case of a spatially uniform time-dependent electric field, we calculated time-averaged hole densities as a function of the increment in the total energy per site . We find a critical value above which the horizontal CO and the lattice distortion simultaneously disappear. The value in -RbZn is larger than that in -I3, as a consequence of the larger stabilization energy for the CO in -RbZn. When the COs are destroyed, the hole distribution reflects the symmetry of the underlying crystal structure without lattice distortions. It becomes uniform for -RbZn whereas the charge disproportionation between sites B and C remains for -I3.
When the applied electric field is local, the time evolution of the hole densities shows anisotropy. The influences of the local photoexcitation propagate more rapidly to the direction parallel to the stripes than to that perpendicular to the stripes. In particular, for -RbZn a photoinduced domain hardly expands to the perpendicular direction. The increase of is limited to a small value when the pulse width is small, indicating that it is difficult to melt the CO in -RbZn by the local photoexcitation. This is because the -distortion homogeneously modulates the transfer integrals on the horizontally connected bonds, so that the charge correlation in each stripe (between stripes) is strong (weak). For -I3, on the other hand, the photoinduced domain expands in the plane. This comes from the fact that each hole-rich bond B2′ between sites A and B in -I3 is locally stabilized by the -distortion.
The obtained results are qualitatively consistent with the experimental observations, which indicate that the CO in -RbZn is more stable against photoexcitation than in -I3: a macroscopic metallic domain is generated in -I3 whereas the CO only locally melts in -RbZn.
Acknowlegements
The authors are grateful to S. Iwai and S. Miyashita for enlightening discussions. This work was supported by Grants-in-Aid and “Grand Challenges in Next-Generation Integrated Nanoscience” from the Ministry of Education, Culture, Sports, Science and Technology of Japan.
Appendix A Maximum of Increment in Total Energy
Figure 6 shows that begins to decrease at around . This behavior comes as a consequence of the periodicity of the energy band in momentum space. The electric field shifts the momenta of electrons. For simplicity, let us consider the noninteracting electrons in one-dimension, where the shift is estimated by the equation of motion,
| (13) |
Here is the wave number and we set with being the lattice constant. By integrating the above equation from to that is one half of the period of the oscillating electric field, we obtain the momentum shift as,
| (14) |
As increases, and increase. When , however, some electrons accelerated by the electric field cross the boundary of the Brillouin zone so that is no longer proportional to . If we increase further, it is expected that the total energy is not efficiently increased any more and even decreases because more electrons cross the zone boundary. This results in the decrease of as shown in Fig. 6. For , corresponds to , which is consistent with the above value, .
References
- [1] H. Seo, C. Hotta, and H. Fukuyama: Chem. Rev. 104 (2004) 5005.
- [2] H. Seo, J. Merino, H. Yoshioka, and M. Ogata: J. Phys. Soc. Jpn. 75 (2006) 051009.
- [3] K. Nasu: Photoinduced Phase Transitions (World Scientific, New Jersey, 2004).
- [4] K. Yonemitsu and K. Nasu: Phys. Rep. 465 (2008) 1.
- [5] H. Okamoto, K. Ikegami, T. Wakabayashi, Y. Ishige, J. Togo, H. Kishida and H. Matsuzaki: Phys. Rev. Lett. 96 (2006) 037405.
- [6] S. Iwai, K. Yamamoto, A. Kashiwazaki, F. Hiramatsu, H. Nakaya, Y. Kawakami, K. Yakushi, H. Okamoto, H. Mori, and Y. Nishio: Phys. Rev. Lett. 98 (2007) 097402.
- [7] K. Miyagawa, A. Kawamoto, and K. Kanoda: Phys. Rev. B 62 (2000) R7679.
- [8] R. Chiba, H. Yamamoto, K. Hiraki, T. Takahashi, and T. Nakamura: J. Phys. Chem. Solids 62 (2001) 389.
- [9] Y. Takano, K. Hiraki, H. M. Yamamoto, T. Nakamura, and T. Takahashi: J. Phys. Chem. Solids 62 (2001) 393.
- [10] Y. Takano, K. Hiraki, H. M. Yamamoto, T. Nakamura, and T. Takahashi: Syn. Met. 120 (2001) 1081.
- [11] S. Iwai, K. Yamamoto, F. Hiramatsu, H. Nakaya, Y. Kawakami, and K. Yakushi: Phys. Rev. B 77 (2008) 125131.
- [12] H. Mori, S. Tanaka, and T. Mori: Phys. Rev. B 57 (1998) 12023.
- [13] M. Watanabe, Y. Noda, Y. Nogami, and H. Mori: J. Phys. Soc. Jpn. 73 (2004) 116.
- [14] K. Bender, K. Dietz, H. Endres, H. W. Helberg, I. Hennig, H. J. Keller, H. W. Schafer, and D. Schweitzer: Mol. Cryst. Liq. Cryst. 107 (1984) 45.
- [15] T. Kakiuchi, Y. Wakabayashi, H. Sawa, T. Takahashi, and T. Nakamura: J. Phys. Soc. Jpn. 76 (2007) 113702.
- [16] K. Yamamoto, K. Yakushi, K. Miyagawa, K. Kanoda, and A. Kawamoto: Phys. Rev. B 65 (2002) 085110.
- [17] R. Wojciechowski, K. Yamamoto, K. Yakushi, M. Inokuchi, and A. Kawamoto: Phys. Rev. B 67 (2003) 224105.
- [18] H. Seo: J. Phys. Soc. Jpn. 69 (2000) 805.
- [19] R. H. McKenzie, J. Merino, J. B. Marston, and O. P. Sushkov: Phys. Rev. B 64 (2001) 085109.
- [20] R. T. Clay, S. Mazumdar, and D. K. Campbell: J. Phys. Soc. Jpn. 71 (2002) 1816.
- [21] T. Mori: J. Phys. Soc. Jpn. 72 (2003) 1469.
- [22] J. Merino, H. Seo, and M. Ogata: Phys. Rev. B 71 (2005) 125111.
- [23] M. Kaneko and M. Ogata: J. Phys. Soc. Jpn. 75 (2006) 014710.
- [24] H. Watanabe and M. Ogata: J. Phys. Soc. Jpn. 75 (2006) 063702.
- [25] K. Kuroki: J. Phys. Soc. Jpn. 75 (2006) 114716.
- [26] C. Hotta and N. Furukawa: Phys. Rev. B 74 (2006) 193107.
- [27] C. Hotta, N. Furukawa, A. Nakagawa, and K. Kubo: J. Phys. Soc. Jpn. 75 (2006) 123704.
- [28] H. Seo, K. Tsutsui, M. Ogata, and J. Merino: J. Phys. Soc. Jpn. 75 (2006) 114707.
- [29] M. Udagawa and Y. Motome: Phys. Rev. Lett. 98 (2007) 206405.
- [30] Y. Tanaka and K. Yonemitsu: J. Phys. Soc. Jpn. 76 (2007) 053708.
- [31] S. Miyashita and K. Yonemitsu: Phys. Rev. B 75 (2007) 245112.
- [32] Y. Tanaka and K. Yonemitsu: J. Phys. Soc. Jpn. 77 (2008) 034708.
- [33] Y. Tanaka and K. Yonemitsu: J. Phys. Soc. Jpn. 78 (2009) 018002.
- [34] S. Miyashita and K. Yonemitsu: J. Phys. Soc. Jpn. 77 (2008) 094712.
- [35] S. Nishimoto, M. Shingai, and Y. Ohta: Phys. Rev. B 78 (2008) 035113.
- [36] B. Rothaemel, L. Forr, J. R. Cooper, J. S. Schilling, M. Weger, P. Bele, H. Brunner, D. Schweitzer, and H. J. Keller: Phys. Rev. B 34 (1986) 704.
- [37] For -I3, we use the symbol A′ in stead of D which is used in ref. 32.
- [38] A. Kobayashi, S. Katayama, K. Noguchi, and Y. Suzumura: J. Phys. Soc. Jpn. 73 (2004) 3135.
- [39] A. Kobayashi, S. Katayama, and Y. Suzumura: J. Phys. Soc. Jpn. 74 (2005) 2897.
- [40] S. Katayama, A. Kobayashi, and Y. Suzumura: J. Phys. Soc. Jpn. 75 (2006) 054705.
- [41] A. Kobayashi, S. Katayama, Y. Suzumura, and H. Fukuyama: J. Phys. Soc. Jpn. 76 (2007) 034711.
- [42] N. Miyashita, M. Kuwabara, and K. Yonemitsu: J. Phys. Soc. Jpn. 72 (2003) 2282.
- [43] S. Miyashita, Y. Tanaka, S. Iwai, and K. Yonemitsu: submitted to J. Phys. Soc. Jpn.
- [44] K. Yamamoto, S. Iwai, S. Boyko, A. Kashiwazaki, F. Hiramatsu, C. Okabe, N. Nishi, and K. Yakushi: J. Phys. Soc. Jpn. 77 (2008) 074709.