The Suzaku Cassiopeia AteamPossible keV-TeV correlation in the reverse shock \Received2008/11/21 \Accepted2009/07/15
ISM: individual (Cassiopeia A) - ISM:supernova remnants
Suzaku X-ray imaging and spectroscopy of Cassiopeia A
Abstract
Suzaku X-ray observations of a young supernova remnant, Cassiopeia A, were carried out. K-shell transition lines from highly ionized ions of various elements were detected, including Chromium (Cr-K at 5.61 keV). The X-ray continuum spectra were modeled in the 3.4–40 keV band, summed over the entire remnant, and were fitted with a simplest combination of the thermal bremsstrahlung and the non-thermal cut-off power-law models. The spectral fits with this assumption indicate that the continuum emission is likely to be dominated by the non-thermal emission with a cut-off energy at 1 keV. The thermal-to-nonthermal fraction of the continuum flux in the 4–10 keV band is best estimated as 0.1. Non-thermal-dominated continuum images in the 4–14 keV band were made. The peak of the non-thermal X-rays appears at the western part. The peak position of the TeV -rays measured with HEGRA and MAGIC is also shifted at the western part with the 1-sigma confidence. Since the location of the X-ray continuum emission was known to be presumably identified with the reverse shock region, the possible keV-TeV correlations give a hint that the accelerated multi-TeV hadrons in Cassiopeia A are dominated by heavy elements in the reverse shock region.
1 Introduction
Supernova remnants (SNRs) have long been considered to be the primary acceleration sites of cosmic-ray particles below the energy of the so-called knee in the cosmic ray spectrum, . The first evidence for multi-TeV acceleration was the discovery of synchrotron X-ray emission from the shell of the supernova remnant SN 1006 (Koyama et al., 1995). More direct evidence for the presence of multi-TeV particles (electrons and/or protons) inside supernova remnants was provided by CANGAROO’s discovery of TeV -rays from another and brighter shell-like SNR in TeV, RX J1713.73946 (Muraishi et al., 2000). Recent high quality morphological and spectral studies with the HESS TeV imager combined with the X-ray imager such as ASCA, found a good keV-TeV correlation from RX J1713.73946 (Aharonian et al. (2004)) and RXJ 0852.04622 (Aharonian et al. (2007)), indicating that both the X-rays and the TeV -rays are emitted by the TeV particles in the SNR shell. The extremely thin X-ray filaments with a 0.02pc width in SN 1006 (Bamba et al., 2003; Long et al., 2003), as well as the X-ray variability on time scales of a year from RX J1713.73946 (Uchiyama et al. (2007)) strongly support the efficient acceleration of particles by SNR shocks. Up to now, many observational results support that supernova remnants (SNRs) are major sources of galactic TeV cosmic rays.
The young ( old) supernova remnant Cassiopeia A is one of several SNRs from which non-thermal X-rays and TeV -rays have both been detected (X-rays:Allen et al. (1997); Uchiyama & Aharonian (2008), TeV:Aharonian et al. (2001); Albert et al. (2007)). In X-rays Cassiopeia A seems to consist of a number of thermal and non-thermal X-ray emitting knots/filaments (Hughes et al. (2000); Hwang et al. (2004); Bamba et al. (2005)). Although some non-thermal emission is associated with the forward shock, the dominant source of non-thermal emission may be identified with the reverse shock regions (Helder & Vink (2008) and references there in). It therefore is a unique object in which we can study the particle acceleration by the reverse shock, because for the other SNRs the acceleration seems to originate from the forward shock region only (e.g., Parizot et al. (2006)). The bulk of the composition of the high-energy cosmic rays ( PeV) might be made up of elements heavier than helium (Amenomiri et al. (2006) and reference there in). The study of the acceleration in the reverse shock is interesting since the ejecta is dominated by these heavy elements.
The overall X-ray spectra from Cassiopeia A are described by optically thin-thermal emission (line emission by highly ionized heavy elements and bremsstrahlung) accompanied by non-thermal emission extending beyond 10 keV (e.g., Serlemitsos et al. (1973); Pravdo & Smith (1979); Allen et al. (1997)). However, the basic characterization of the two continuum components—such as the total intensity, spectral shapes (temperature of thermal bremsstrahlung and the shape of synchrotron spectrum), and the emission sites—has been somewhat controversial. For example, Allen et al. (1997) fitted the broadband spectrum obtained with RXTE using thermal bremsstrahlung with keV and a broken power law with and with a break energy of 15.9 keV, while Favata et al. (1997) fitted the Beppo-SAX spectrum of Cassiopeia A with keV and a power law with (see also Vink & Laming (2003)).
In this paper, we present a Suzaku study of the X-ray emission from Cassiopeia A. The X-ray Imaging Spectrometer (XIS) enables us to make hard X-ray images and spectra up to . By combining the XIS with the companion instrument, Hard X-ray Detector (HXD), we present a wide-band continuum spectrum (3.4–40 keV).
2 Observation and Data Reduction
The Suzaku satellite (Mitsuda et al., 2007) has carried out three observations of Cassiopeia A, one in 2005 September, and two in 2006 February. The observation log is given in table 1. In all the three observations, Cassiopeia A was pointed at around the geometrical center of the XIS detector (the XIS nominal position).
| No. | Date | Exposure (ks) | XIS mode | |
|---|---|---|---|---|
| YYYY/MM/DD | XIS | HXD | Clock/Window/Burst/S-CIb | |
| 1st | 2005/09/01 | 30.3a | 20.5 | Normal/-/-/N |
| 2nd | 2006/02/02 | 0 | 8.6 | Normal/-/4sec/N |
| 3rd | 2006/02/17 | 7.1 | 17.1 | Normal/-/4sec/N |
: Only the data taken in segment B are available. Those in other segments (A,C,D) are mostly suffered with telemetry saturation.
: Clock/Window/Burst/S-CI are the options of the CCD clocking or editing modes. See Koyama et al. (2007a) for details.
Suzaku’s XIS (Koyama et al. (2007a)), consists of four X-ray CCD cameras each placed in the focal plane of the X-Ray Telescope (XRT: Serlemitsos et al. (2007)). All four XRT modules are co-aligned to image the same region of the sky, with a field of view of 18\arcmin18\arcmin. The point spread function has a half power diameter of 1\farcm9–2\farcm3. Three of the cameras (XIS 0, XIS 2, and XIS 3) have front-illuminated (FI) CCDs, sensitive in the 0.4–14 keV energy band, and the remaining one (XIS 1) has a back-illuminated (BI) CCD, which is sensitive down to 0.2 keV. For a broad band fitting of the continuum emission, we analyzed the FI CCDs (XIS 0 2 3), since the hard X-ray data above 8 keV is noisy in the BI CCD XIS 1. Combined with XRT, the total effective area per one XIS system is cm2 at 8 keV. Suzaku also has a non–imaging Hard X-ray Detector (HXD: Kokubun et al. (2007); Takahashi et al. (2007)). The HXD is comprised of Si PIN diodes (PIN) sensitive in the 15–80 keV range, and a GSO scintillator (GSO) sensitive in the 50–500 keV range. Both are located inside an active BGO shield. The PIN and GSO have a field of view (FOV) of 34\arcmin34\arcmin and 4\degree4\degree, respectively, with the lowest non–X-ray background ever achieved.
The XIS and the HXD data were processed with the Suzaku pipe-line software (version 2.1). The response functions were generated by using the CALDB 2008-07-09. We removed data taken during the South Atlantic Anomaly passages and data for which earth elevation angles were below 5\degree. For PIN and GSO data, we further excluded the events taken with cut-off rigidity less than 6 GV. We corrected for the dead time –8%) of the HXD using hxddtcor. The total net exposure time after this filtering is summarized in table 1. The exposure for the HXD (PIN and GSO) is ks. The exposure time for XIS is given below.
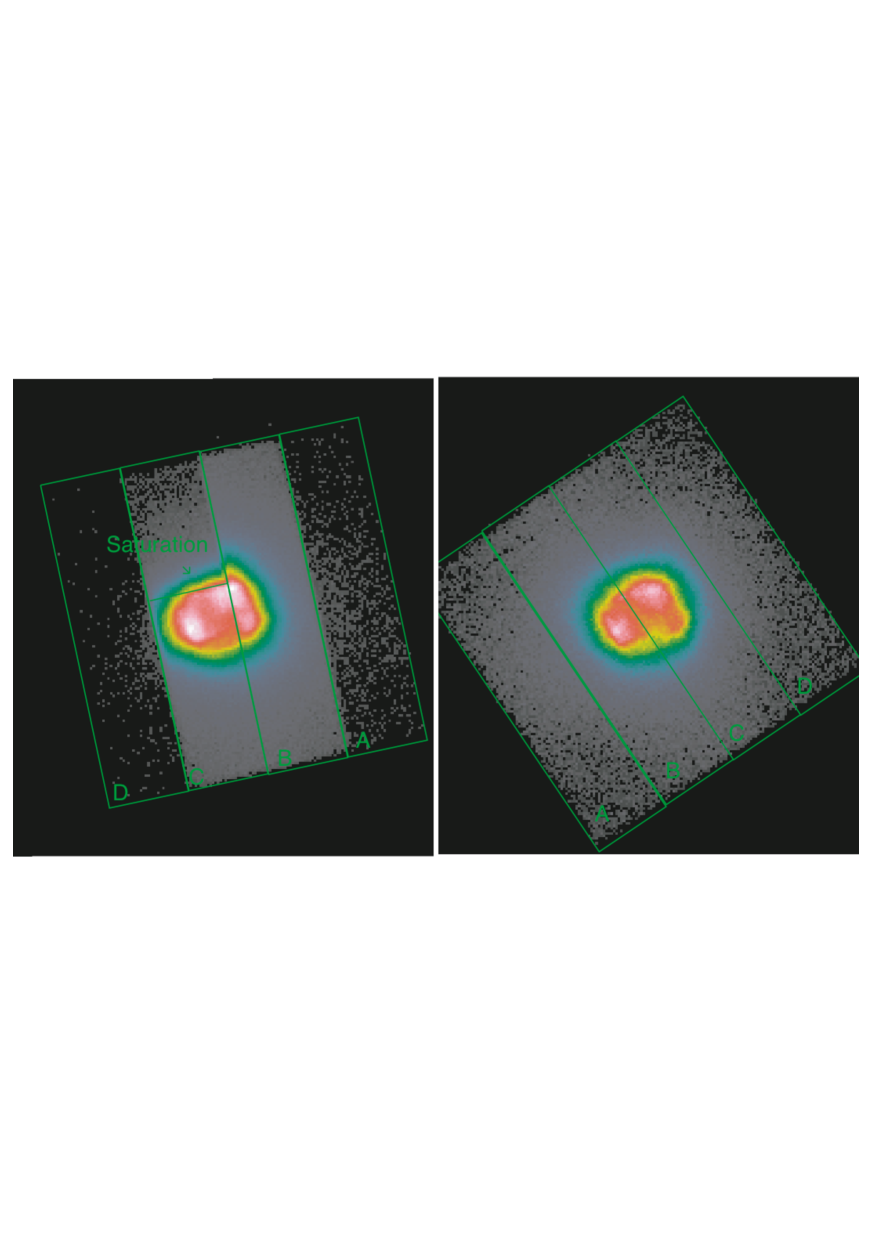
In figure 1, we show an example of the Cassiopeia A XIS-0 image taken at the 1st and 3rd observations. No XIS data are available at the 2nd observations because of an accident in the XIS operation. The image of the 1st observation is truncated at the south-east rim while that of the 3rd is not. The truncation is due to the data lost by the telemetry saturation. The location of the image truncation is different from detector to detector in order to its orientation (see Ishisaki et al. (2007)).
An amount of the events recorded in the XIS readout interval (8 second) is limited (Koyama et al. (2007a)). The event rate at the 1st observation was slightly above the telemetry limit. Consequently, a small fraction of the data were lost; 15% for the FI CCDs but varied from interval to interval. The larger fraction of the data (%) was lost in the BI CCD (XIS-1) than in the FI CCDs. The read-out of the CCD chip is separately made at each quarter called as ‘segment’. The data recording to the telemetry in the read-out interval is then made with a scheduled order of BCAD. The telemetry saturation for our data is usually occurred during the read-out of the data in the segment C in which roughly the half of the Cassiopeia A events are detected. All the data in the segment B containing another half of the Cassiopeia A image are fully recorded but is hardly in the D. It is in general impossible to recover the data lost by the telemetry saturation. We gave up to use the telemetry saturated data for the image analysis (Section 3.1). We also did not use them for the XIS-HXD combined analysis (Sections 3.2 and 3.3) for which their relative normalization is crucial. The XIS exposure for the non-telemetry-saturated data of the 3rd observations is only 7 ks long after being corrected for the dead-time effect discussed at the end of this section.
It is notable that a large fraction of the events from Cassiopeia A were recorded in the 1st observation. We therefore used the telemetry-saturated data for the Cr-K line analysis because an energy ratio or a flux ratio between the two lines are less dependent on the weak telemetry saturation. Since the exposure time of the 1st observations is 30 ksec long, their statistics are four times better than those of the 3rd. The spectra made with the high statistics of the 1st observation were used in section 3.4 and indeed help to restrict the line parameters precisely.
At the 3rd observation, the XIS detector was made with the 4-sec burst option. The burst option selects the exposure time arbitrarily (in 1/32s steps) within the readout interval of 8 s and provides a full-sized image. This option introduces an artificial dead time. For the 4-sec burst option, the exposure is 4 sec and a dead time of 4 sec is introduced every 8 sec. The amount of the events in the interval is reduced by a factor of two. The burst option also works to reduce the numbers of the pile-up events. The pile-up issue will be discussed in the section below.
1st 3rd
(135mm,135mm)figure2.ps
3 Analysis and Results
3.1 Images
Figure 2 shows the energy-resolved images with the XIS in 4.2–6, 6–7, 8–11 and 11–14 keV band, respectively. The images were made adding the XIS 0, 2 and 3 data taken at the third observations in 2006 February 17th. The images are not corrected for the exposure map, i.e., the vignetting function of the telescope. The exposure map in the sky region where Cassiopeia A was focused, is constant within 20% at any energy.
We first made smoothed images of the Suzaku XIS and Chandra ACIS in the 0.5–14 keV band. The Suzaku images were binned by pixels and were then smoothed with a Gaussian function with a sigma of 3 bins ( arcmin) . The ACIS image was downloaded from the supernova archive web site 111http://asc.harvard.edu. We then aligned the peak position at the south-east rim of the XIS image to that of the ACIS, since the Suzaku position has the systematic error of 20 arcsec (Uchiyama et al. (2008)). The image after the position correction was shown in figure 2. The XIS image is well matched with the ACIS contour.
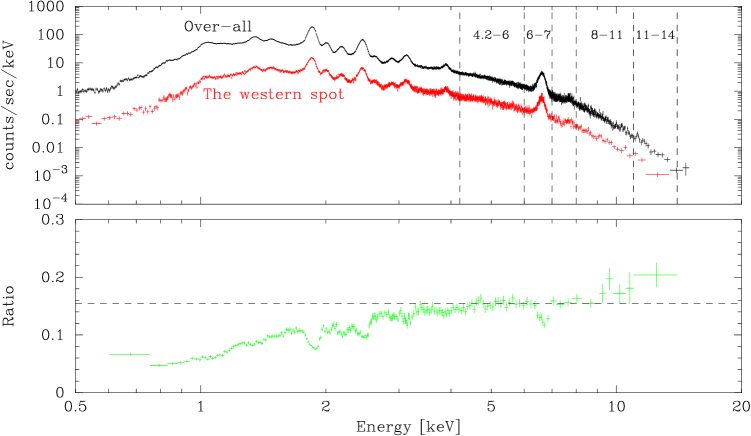
By referring to the XIS spectrum (figure 3), we confirmed that the 6–7 keV band is dominated by line emission from ionized iron, while the 4.2–6, 8–11 and 11-14 keV bands are dominated by continuum emission. The thermal-dominated 6–7 keV band image shows the brightest peak at the northern part, while others do at the western part. This view looks consistent with that given by Bleeker et al. (2001) using the XMM-Newton data. Above 4 keV the events are biased toward the soft energy border of a given energy band, due to the decline in the effective area and due to the fall-off in the source spectrum toward higher energies (figure 3). Therefore, the images in the 4.2–6, 8–11 and 11–14 keV bands can be eventually interpreted as images at 4.2, 8, and 11 keV, respectively.
There may be some concern that pile-up affects the images, since Cassiopeia A is known as a very bright X-ray source (118 c/s/FI). Pile-up results in the identification of two or more photons, as one photon with a higher energy. It therefore results in a hardening of a spectrum. The pileup is best visible in the 8-11 and 11-14 keV bands because of their intrinsically low count rates. We checked the hardening effect of the pile-up by comparing the spectra of the two observations taken with different modes: the normal and the 4-sec burst option. In the first observations, taken half a year before the third observation, the brightest spot at the inner western shell (hereafter the western spot) is located in segment B of the XIS 0 and 3 detectors. Since the data in the segment B did not suffer telemetry saturation, we can make a spectrum on the western spot with them. Table 2 summarized the count rate and the hardness ratio obtained with two observations.
The observation with the normal option is twice as sensitive to pile-up than those with the 4-sec burst option, because the exposure time per readout is two times longer. The pile-up events make a continuum-like spectrum. Therefore, the count rate of the energy band dominated by line emission , i.e., iron 6–7 keV band, is less increased by the pile-up, but that of the continuum is. A larger value of the hardness ratio to the Fe-line band, due to hardening, is expected for pile-up affected data. However, the hardness ratio shown in Table 2 is consistent with being constant for the two modes. This strongly indicates that the XIS data are not heavily piled-up and that the flux in the western spot is stable. We thus conclude that the XIS images are not affected by pile-up at any energy.
About 16% of counts in the 8–11 keV band are located in the region of the western spot. A similar fraction is obtained for the 4.2–6 and 11–14 keV bands (see also figure 3). This is roughly consistent with the Chandra ACIS data, for which we find that 19% of the counts in the 4.2–6 keV are located in this region. Therefore, one fifth of the 8–11 keV flux from Cassiopeia A likely originates from the western spot.
Figure 4 shows the 8–11 keV band image overlaid with the peak positions of the TeV -rays reported by HEGRA (Aharonian et al. (2001)) and MAGIC (Albert et al. (2007)). The confidence level of the error boxes is 1 sigma. The systematic position uncertainties (errors) are not included in the boxes, but are displayed at the top-left of the figure 4.
Since the other continuum bands of 4.2–6 and 11–14 keV show the image similar to the 8–11 keV band (Figure 2), the Suzaku image peak of the continuum emission is all shifted to the western part. The TeV peak measured by the two independent TeV telescopes (HEGRA and MAGIC) is also shifted to the western direction within its 1-sigma error. The facts give a hint of a possible keV-TeV correlation in Cassiopeia A.
| Energy band [keV] | 6-7 | 8-11/6-7 | 11-14/6–7 | |
|---|---|---|---|---|
| Detector | Observations | [c/s] | ||
| XIS 0 | ||||
| 1st (normal) | 0.280(3) | 0.24(1) | 0.020(2) | |
| 3rd (4sec burst) | 0.286(6) | 0.23(1) | 0.018(3) | |
| XIS 3 | ||||
| 1st (normal) | 0.263(3) | 0.24(1) | 0.022(2) | |
| 3rd (4sec burst) | 0.291(6) | 0.24(1) | 0.026(4) | |
One sigma Poisson errors are given in parentheses.
3.2 Spectra
Figure 5 shows the unfolded Suzaku XISHXD spectrum in the 1–500 keV band. The XIS spectrum was made by averaging the XIS 0, 2 and 3 data of the third observation. It was also extracted from the circular region with a radius of 4 arcmin that corresponds to the circle shown in figure 2. The background spectra were extracted from an annular region with inner and outer radii of 4 arcmin and 7 arcmin. Since the X-ray emission from Cassiopeia A is very strong, the background contribution is almost negligible. The background fraction is only 6 % above 10 keV, where the background count-rate is the highest. Therefore the XIS spectra are not sensitive to background subtraction at any energy range.
Since the HXD PIN and GSO have no imaging capability, we made the PIN and GSO spectrum by simply averaging the spectra of the three observations. We then applied the model background spectra ”tuned non-X-ray background” (ver 2.1) that are released for every observation 222http://www.astro.isas.jaxa.jp/suzaku/analysis/hxd/. The model background is dominated by the non X-ray background and does not take into account the cosmic X-ray background. However, the cosmic X-ray background is negligible for our spectral analysis (% of the source flux). The count rate after the background subtraction is reduced down to 38% and 1.2% for PIN (15–80 keV) and GSO (50–500 keV), respectively.
It is well known that the error of the HXD background model is dominated by systematics. For checking the systematic uncertainties, we usually compare the background model with data taken during the earth occultation. However, Cassiopeia A is located so far to the north that the occultation seldom happened during our observations. It is very difficult to estimate the systematic error for our particular background models.
We, therefore, refer to the reports on the systematic error based on other observations provided at the Suzaku web page. From Fukazawa et al. (2009), we adopted a systematic error of 3% for the PIN background spectra and 0.6% for the GSO (1), and applied them to our analysis. The systematic error is included in the error bar of each PIN spectral bin in Figures 5 and 6. The PIN spectrum is less sensitive to the systematic error of the background model.
After background subtraction, we found no GSO bins in the spectra with detections that are statistically significant. We thus display 5-sigma upper limits in figure 5. The 5- upper limit is erg/s/cm2 in the 150–500 keV band by assuming a photon index of unity. We did not use the GSO data for the spectral analysis discussed below.
The over-all spectra from Cassiopeia A consists of thermal and non-thermal components. In fact, the emission lines from the thermal component appear in the XIS band. The emission lines are known to show a variety of Doppler shifts and are difficult to be precisely modeled (Holt et al. (1994); Willingale et al. (2002)) . Since our paper mostly focuses on the non-thermal component, we ignored the energy band dominated by the line emission and limited our analysis to the continuum-dominated energy bands of 3.4–3.6 and 4.2–6 and 8–14 keV from the XIS spectra.
The S/N ratio of the HXD PIN spectra gradually drops at around 40 keV. The counts in all the PIN bins in the 15–40 keV band are three times or more as large as the systematic error of the background. Consequently, for the HXD PIN we limited our analysis to the 15-40 keV band, which we analyzed jointly with the continuum dominated bands 3.4–3.6, 4.2–6, and 8–14 keV of the XIS detectors.
Figure 6 shows the best-fit parameters of the model fitting. According to a recent calibration report, the PIN normalization of the Crab nebula is 15% higher than that for the XIS. 333http://www.astro.isas.jaxa.jp/suzaku/doc/suzakumemo/suzakumemo-2008-06.pdf. In our spectral fit we, therefore, multiply the normalization constant for the PIN by .
The PIN net count rate in the 15–40 keV band is 0.18 c/s that is 63% of the background. Since the systematic error of the PIN background is about 3%, the normalization uncertainty due to the background subtraction becomes as large as about 5%. The normalization error can give further uncertainty to the best-fit parameters of our model-fitting. We evaluated the uncertainty later in this section.
The continuum consists of both thermal and non-thermal components. We modeled the thermal component with a thermal bremsstrahlung emission. For the non-thermal component, we tested three models, 1) Power-law, 2) SRCut, and 3) Cut-off power-law. For the SRCut model, we fixed the spectral index at 1 GHz as 0.77 (see Green (2004)). All the three models show a similar reduced- value of 1.15 (table 3).
The best-fit temperature of the thermal component is keV for the power-law model, while it is keV for the SRCut and cut-off power-law models. The best-fit roll-off frequency of the SRCut model appears at around 0.9 keV, which is roughly consistent with that measured using the Beppo-SAX spectrum (1.2 keV; Vink & Laming (2003)). The best-fit flux ( Jy) at 1 GHz for the SRCut model exceeds the measured radio flux by almost 40% ( Jy: Green (2004)). The overestimate of the model might be due to the non-linear acceleration effects (Atoyan et al. (2000)). We adopted the best-fit parameters for the cut-off power-law model in the analysis below.
The best-fit values shown in Table 3 are dependent on the effective area and relative normalization factor that we adopted. To calculate the XIS effective area, we consider two cases for the angular extension : a point-like source and the Chandra 4–6 keV band image. For the two effective area, we further gave conservative uncertainty of about 10% (105–125%) on the normalization constant. In any case, the thermal-to-nonthermal fraction ranges from 0.1 to 0.2 for the cut-off power-law model. The and the cut-off energy is sensitive to the combination of the effective area and the normalization constant. If we make an assumption of , predicted by the classical diffusive shock acceleration (DSA) theory (see Uchiyama et al. (2007)), the best-fit cut-off energy always appears around 3 keV which is consistent with 1 keV. The conclusion of this paper does not depend on these uncertainties. We thus adopted the best-fit value shown in Table 3 in the discussion section.
One may be interested in the flux difference between the HXD PIN and the hard X-ray instruments onboard the other satellites. The HXD PIN flux is 107%, 126%, and 133% of those reported using the data of Rossi-XTE (Allen et al. (1997)), Beppo-SAX (Favata et al. (1997)), and Integral (Renaud et al. (2006)), respectively. To calculate the ratio, we set the relative normalization factor to the XIS as unity. We assumed the best-fit model published in each paper and fitted the HXD PIN data in the 15–40 keV band with the model but multiplied it by the ratio. The difference of the flux among the instruments will be due to the systematic uncertainty with unidentified reasons.
(125mm,125mm)figure3.ps
| Thermal model | Non-thermal model | /d.o.f. | ||||||
| Thermal bremsstrahlung + Power-law | ||||||||
| † | Norm | † | ||||||
| [ keV ] | [ erg/s/cm2 ] | [ ∗ ] | [ erg/s/cm2 ] | |||||
| 0.2 | 861.7/751 | |||||||
| Thermal bremsstrahlung + SRCut | ||||||||
| † | Roll-off | Norm | † | |||||
| [ keV ] | [ erg/s/cm2 ] | [ keV ] | [ Jy at 1 GHz ] | [ erg/s/cm2 ] | ||||
| (fix) | 0.1 | 857.8/751 | ||||||
| Thermal bremsstrahlung + Cut-off power-law | ||||||||
| † | Cut-off | Norm | † | |||||
| [ keV ] | [ erg/s/cm2 ] | [ keV ] | [ ∗ ] | [ erg/s/cm2 ] | ||||
| 0.1 | 861.1/750 | |||||||
|
The errors are at 90% confidence level.
Cut-off power-law model : Fit range: XIS: 3.4–3.6 and 4.2–6 and 8–14 keV, HXD: 15–40 keV. ∗∗{\ast}∗∗{\ast}footnotemark: ph keV-1 cm-2 at 1 keV ††\dagger††\daggerfootnotemark: ergs-1 s-1 cm-2 in the 4–10 keV ‡‡\ddagger‡‡\ddaggerfootnotemark: |
||||||||
(120mm,80mm)figure4.ps
(160mm,160mm)figure5.ps
3.3 K-shell transition lines from Iron (Fe K and K)
The line-flux ratio is sensitive to the electron temperature. Figure 7 shows the zoomed-up XIS spectrum in the 5-10 keV band. The strong line appears at 6.6 keV and is identified with Fe-K lines from highly ionized ions (helium-like or less ionized). We also identified a blend of the Ni-K and Fe-K lines at 7.6–7.9 keV and possibly the Fe-K line at keV. The blend appears as a broad line due to (1) the Doppler shift and broadening, (2) the multiple lines from ions at different ionization degrees (satellite lines), and (3) the limited energy resolution of the XIS detector.
In order to determine the line fluxes of the blend, we fixed the line energy of the Fe-K line to that of the Ni-K multiplied by a factor of 1.014 (e.g., Koyama et al. (2007b)). The best-fit parameters are also shown in Table 4. The upper and lower limits of the flux ratio of correspond to the case that the line complex at 7.6–7.9 keV is dominated by Fe-K and Ni-K, respectively.
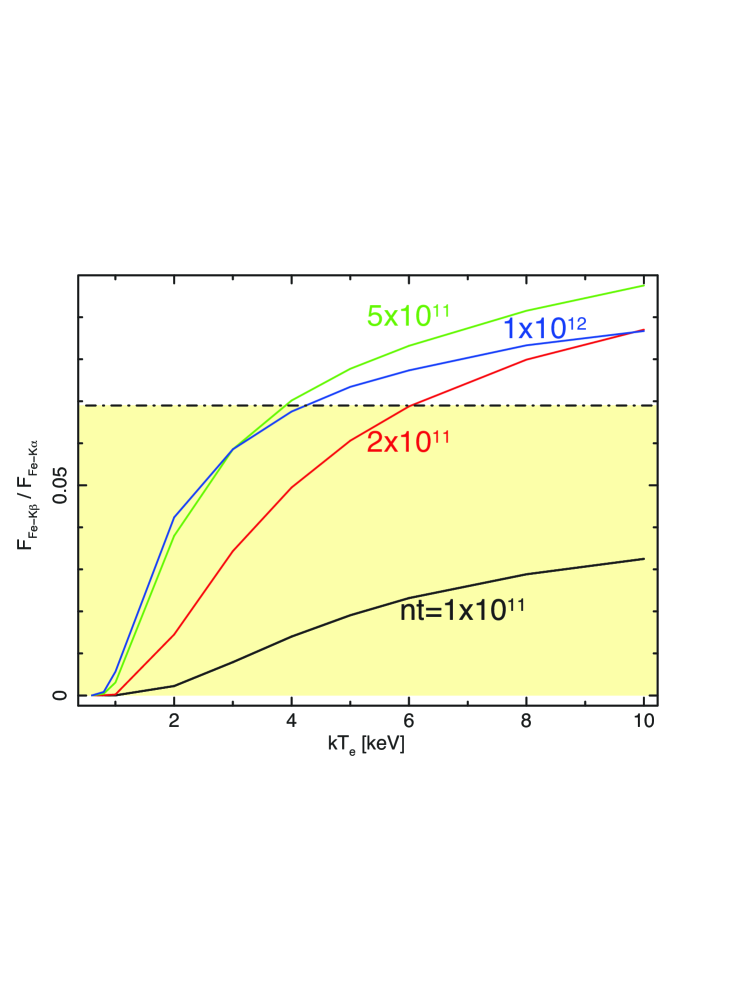
In Figure 7, we compared the best-fit flux ratio to those calculated at a given temperature using the optically thin-thermal plasma code in non-ionization equilibrium condition (the “nei” model in xspec fitting package). We faked the spectra for a pure-iron plasma with the temperature of 0.8, 1, 2, 3, 4, 5, 6, 8, 10 keV and determined the flux ratio by three-Gaussians with a thermal bremsstrahlung continuum. We linearly interpolate the ratio, and make the plot shown in Figure 8.
The best-fit KK flux ratio can be explained if the electron temperature is 1–4 keV in or near the collisional equilibrium ( s cm-3). For the case of the short ionization timescale of s cm-3, the wide range of electron temperature over 10 keV is acceptable. The electron temperature determined by the continuum modeling ranges from 1 to 5 keV for the three different models. We conclude that the temperature derived from the Fe-line ratio is not inconsistent with the temperature derived above from the continuum models (1–5 keV depending on the model chosen).
| [ keV ] | [ ph/s/cm2] | |
|---|---|---|
| Fe-K | ||
| Ni-K | ||
| Fe-K | ∗ | |
| Fe-K | 8.27(fix) |
The line energy of Fe-K is linked to 1.014 times as high as that of Ni-K.
Fit range: XIS: 3.4–3.6 and 4.2–14 keV, HXD: 15–40 keV.

3.4 K-shell transition line from Chromium (Cr K)
Figure 9 shows the zoomed-up XIS spectrum in the 5.0-7.0 keV band. The residuals in the fitted spectrum shows a signature of Cr K-shell emission. This weak signature was only found after the accumulation of all available data of the 1st and 3rd observations, and by adding up the data of four CCDs. Furthermore, in order to bring out the signal in Figure 9 we used a courser binning than in Figure 3.
Since the energy band below 5 keV may be affected by the group of Ca-K emission line, we selected the energy band (5-7 keV) to look for a weak emission line. We fitted the data in the 5–7 keV band by using a power law and Gaussian line for Fe-K profile. The residual indicates a weak line-like feature around 5.6 keV. We therefore introduce a Gaussian line around 5.6 keV that can be a Cr-K line. In this way, we modeled the continuum with a single cut-off power-law model and two lines with Gaussian functions: one for the possible Cr-K line and the other for the Fe-K line. Due to the limited statistics, we assumed the same line broadening, i.e., Gaussian sigma, for both lines. The best-fits and their residuals around the Cr-K band are shown in Figure 9. We found the F-test probability of non-presence of Cr-K is around 10-6. The best-fit Gaussian energies are keV for Cr-K and keV for Fe-K, respectively. 444 A systematic error due to the calibration uncertainties of the absolute energy gain is an order of 0.01 keV at 6 keV. In fact, the best-fit energy of the Fe-K line differs by 6 eV between the two different dataset (Tables 4 and 5). However, the discussion we made later is independent on the calibration error of the absolute energy scale.


4 Discussion
4.1 Non-thermal emission
We have obtained a 3.4–40 keV continuum spectrum summed over the entire remnant with Suzaku. It is now recognized that the continuum emission of Cassiopeia A in this bandpass is comprised mainly of the two components: (1) thermal bremsstrahlung by shock-heated electrons mostly in the reverse-shocked ejecta, and (2) synchrotron radiation produced by multi-TeV electrons. Recent studies emphasize that the synchrotron component also should originate predominantly in the reverse-shocked ejecta (Uchiyama & Aharonian (2008); Helder & Vink (2008)), suggesting an interesting possibility that multi-TeV particles can be accelerated in supernova reverse shocks.
Not only synchrotron radiation but also the non-thermal bremsstrahlung was proposed to contribute to the non-thermal compornent (Laming, 2001). However, recent studies reported facts against the non-thermal bremsstrahlung: the lack of line-emission in the continuum areas (Helder & Vink, 2008), Compton-cooling (Vink, 2008), and fast variability in the knots (Uchiyama & Aharonian, 2008). We think the contribution of the non-thermal bremsstrahlung is minor.
We confirm the hard X-ray enhancement in the west (”the western spot”) as shown in the 11–14 keV XIS image (Fig. 2e). The non-thermal continuum dominance in the west was previously reported by a 9–11 keV image made with Beppo-SAX (Helder & Vink (2008)) and a 8.1–15 keV image with XMM-Newton (Bleeker et al. (2001)). Helder & Vink (2008) argued that in the western part of Cassiopeia A most X-ray synchrotron originates in the reverse shocks, and identified the reason for the synchrotron enhancement as a locally higher reverse shock velocity of .
Interestingly, we found a hint that the peak of TeV -rays measured by HEGRA and MAGIC coincides with the location of the synchrotron-dominated western spot. This suggests that the TeV -rays also can originate from reverse-shocked ejecta. The possible coincidence of bright X-ray continuum emission with TeV emission reinforces the idea that the X-ray continuum in the west is indeed synchrotron radiation, irrespective of the TeV radiation mechanism. Atoyan et al. (2000),Vink & Laming (2003) and Berezhko & Völk (2004) argued that the multi-TeV emission is likely to have an hadronic origin. Our finding of a possible keV-TeV correlation suggests that the accelerated multi-TeV hadrons coul d be heavy elements (i.e., ejecta) accelerated by the reverse shock.
The spatially most detailed information about the X-ray continuum emission in Cassiopeia A came from Chandra observations. The superb angular resolution () of Chandra made it possible to fully resolve the arcsecond-scale filamentary or knotty structures as well as more diffuse emission. The extreme brightness of Cassiopeia A and long exposures allocated for the ACIS observations (Hwang et al. (2004)) allows for meaningful spectral fitting of arcsecond-scale pixels. Based on pixel-by-pixel photon indices determined for the 4.2–6 keV continuum band using a power-law fit in each pixel, Helder & Vink (2008) have derived the total contribution of the synchrotron component in the 4.2–6 keV band as %, on the assumption that the continuum shapes characterized by are of thermal origin. The synchrotron flux relative to thermal bremsstrahlung depends on the choice of . Using Figure 10 of Helder & Vink (2008), and translate in % and %, respectively. The difficulties in disentangling the two types of continuum emission stem from the tantalizing fact that they can be co-spatial, as well as from the projection effects. Moreover, the limited spectral coverage of Chandra ( keV) does not allow to perform spectral decoupling.
A complimentary approach, which the present work takes, is measuring a wide band X-ray spectrum extending to hard X-rays in order to break the degeneracy between the thermal bremsstrahlung and synchrotron components. A drawback of this approach is a lack of imaging capability above 15 keV to resolve the spatial structures of hard X-ray emission. We are bound to the analysis of a wide-band spectrum integrated over the entire face of the remnant with a loss of morphological information. Still, we would be able to obtain meaningful results since the variation of electron temperatures determined by line modeling seems reasonably small, ranging from 1–2 keV (e.g., Hwang & Laming (2003); Patnaude & Fesen (2007)). Though this issue should be examined using Chandra data in future work, we here assume that possible temperature distributions do not have a major impact on our discussion.
Our spectral modeling of the overall Suzaku XIS+PIN spectrum in 3.4–40 keV (excluding emission lines) with a bremsstrahlung+power law (BR+PL) model yielded the best-fit temperature of keV and photon index of with a thermal-to-nonthermal ratio of (see Table 3). Compared with previous results on the temperature obtained with Chandra, typically 1–2 keV, the BR+PL model gives a too-high temperature for bremsstrahlung. From Figure 2 of Stage et al. (2006), in line-dominated thermal inner ring in the north and east, thermal bremsstrahlung has a temperature keV in most cases. On the other hand, a bremsstrahlung+cut-off power-law (BR+CPL) model resulted in the best-fit cut-off energy of keV, with . Irrespective of the actual spectral shape, we can conclude that the synchrotron component (integrated over the remnant) in the X-ray band should be described by a convex-shaped continuum, not by a simple power law. This idea is independently supported by the photon index map given by Helder & Vink (2008). The derived cut-off energy (assuming ) of keV is consistent with that expected from shock acceleration theory (with Bohm diffusion) given a typical reverse shock speed of , as well as the X-ray variability of synchrotron filaments ( ; see Uchiyama et al. (2007)).
An interesting consequence of the spectral decomposition discussed above is a fairly small value of 0.1–0.2. This implies that even a 4–6 keV image made with Chandra should be dominated by the synchrotron component. The electron temperature of 1–2 keV corresponds to 6.1–3.8 in the 4.2–6 keV band. If we assume the filaments with 3.8, equivalent to keV, are occupied by the thermal emission, Figure 10 of Helder & Vink (2008) also shows a thermal-to-nonthermal ratio of , which is consistent with our value.
The small value of 0.1–0.2 means the equivalent widths after subtracting a synchrotron spectrum become quite large. In particular, the equivalent width of Fe-K should be as high as 7–14 keV, requiring iron-rich ejecta for Fe-K line emission. In the western regions, outside the bright ejecta ring, extreme iron-rich ejecta were found (iron composition by mass amounting to 90%), that likely originates from the -rich freezeout process, which occurred in the innermost ejecta layer (Hwang & Laming (2003)). The very large equivalent width (EW) of Fe-K inferred for the integrated Suzaku XIS spectrum may be understood if the Fe line comes in large part from -rich freezeout ejecta. Indeed, the presence of such -rich freezeout ejecta is required by the observed emission (Vink et al. (2001); Renaud et al. (2006)).
4.2 Cr-K line
| Cr | Fe | |||||
| Target | line energy | flux | line energy | reference (satellite) | ||
| (eV) | 10-5photons cm-2 s-1 | (eV) | ECr/EFe | |||
| W49B | 5685 | 30 | 6658 | 0.8540.004 | Hwang et al. (2000) (ASCA) | |
| 566010 | 254 | Miceli et al. (2006) (XMM-Newton) | ||||
| Tycho | 548020 | 2.45 | 64451 | 0.8500.004 | Tamagawa et al. (2008) (Suzaku) | |
| Cassiopeia A | 561116 | 0.90.1 | 66151 | 0.8480.002 | This work (Suzaku) | |
:the line energy ratio of Cr-K to Fe-K.
There are two reported SNRs from which the Cr line has been detected; W49B (Hwang et al. (2000); Miceli et al. (2006)) and Tycho (Tamagawa et al. (2008)). Cassiopeia A, reported here, is the third one. The line center energies are summarized in table 5 for Cr and Fe emission lines as well as the energy ratio, , between them. Emission lines in W49B are ionized to He-like ions while those in Tycho are in low ionization state.
If Cr and Fe are in neutral/He/H-like ion, is 0.845/0.848/0.851. is quite insensitive to the ionization state. The similar argument can be valid not only for , but also for the Doppler shifting. If the expanding speeds of Cr and Fe are the same, is not sensitive to their Doppler velocity at all.
According to the nucleosynthesis theory (Woosley et al. (1994); Woosley & Weaver (1995)), 50Cr is produced through explosive oxygen and silicon burning as itself, while the most abundant isotopes of chromium, 52Cr and 53Cr are produced through 52,53Fe decay. The most abundant isotope of iron, 56Fe is produced through 56Ni decay. They are generated in a similar location deep inside the star. Therefore, they must have been ejected with similar explosion speed and have experienced as similar ionization time scale. This is consistent with our results that the observed value of is identical to each SNR within statistical uncertainties (table 5).
After submitting our paper for publication, we became aware of an independent paper by Yang et al. (2009) on the same subject on the Cr-K line. Their conclusions are very similar to those presented here: Cr and Fe are colocated. The value of we measured with the Suzaku data for Cassiopeia A is in very good agreement with theirs of using the Chandra data.
5 Summary
-
1.
Suzaku observed the young supernova remnant Cassiopeia A, and detected the broadband continuum from 3.4 to 40 keV. The 5- upper limit in the 150–500 keV band is erg/s/cm2 by assuming the photon index of unity.
-
2.
The line-flux ratio , is consistent with the electron temperature measured with the continuum modelling, but within the large error.
-
3.
We modeled the X-ray continuum spectrum in the 3.4–40 keV band summed over the entire remnant. For a model, we assumed the simplest combination of the single thermal bremsstrahlung and the single non-thermal cut-off power-law models. We found that the X-ray continuum in the 3.4–40 keV band is dominated by non-thermal emission. The thermal-to-nonthermal fraction of the continuum flux in the 4–10 keV band is 0.1–0.2. The non-thermal continuum in the 3.4–40 keV band is reproduced with a cut-off power-law model with a cut-off energy of keV. The cut-off energy can be understood by the diffusive shock acceleration at a shock velocity of as high as km s-1.
-
4.
We report on the detection of Cr-K at 5.61 keV in Cassiopeia A. Cassiopeia A is the third object for which the Cr-K line emission has been detected. The elements Cr as well as Fe are consistent with being generated in the region deep inside the supernova, since they seem to have had similar ionization history.
-
5.
A hard X-ray image of the continuum emission was obtained with the XIS. Its brightest spot appears at the western part of the reverse shock. The XIS spectrum below 14 keV is smoothly connected to that of the non-imaging detector HXD covering the energy band above 15 keV. Therefore, the 10 keV band image of the XIS is likely the good approximation of the image above 10 keV.
-
6.
We also found a hint that the hard X-ray peak possibly coincides with the TeV peak detected by HEGRA and MAGIC. Since the TeV emission is likely to be hadronic origin, the possible keV-TeV correlation suggests that the TeV hadron could be presumably accelerated in a reverse shock. This is the first observational hint that the high-energy hadrons as well as leptons can be accelerated in the reverse shock in a supernova remnant. A tighter constaraint of the TeV position with deep exposures will be crutial to test this hint.
We would like to express our sincere thanks to Prof. Gerd Pühlhofer for his insightful comments. We thank Dr. Javier Rico and his MAGIC Collaborators who kindly provide the TeV data and technically guide us how to handle the data. Prof. Katsuji Koyama gave us very useful comments on line analysis. We also thank all members of the Suzaku team. EH and JV are supported by the Vidi grant of JV from the Netherlands Organization for Scientific Research (NWO). This work is partly supported by a Grant-in-Aid for Scientific Research by the Ministry of Education, Culture, Sports, Science and Technology (21018009 & 16002004).
References
- Aharonian et al. (2001) Aharonian, F., et al. 2001, A&A, 370, 112
- Aharonian et al. (2004) Aharonian, F. A., et al. 2004, Nature, 432, 75
- Aharonian et al. (2007) Aharonian, F., et al. 2007, ApJ, 661, 236
- Albert et al. (2007) Albert, J., et al. 2007, A&A, 474, 937
- Allen et al. (1997) Allen, G. E., et al. 1997, ApJ, 487, L97
- Amenomiri et al. (2006) Amenomiri, M., et al. (Tibet AS Collaboration) 2006, Physics Letters B, 632, 58
- Atoyan et al. (2000) Atoyan, A. M., Aharonian, F. A., Tuffs, R. J., Völk, H. J. 2000, A&A, 355, 211
- Bamba et al. (2003) Bamba, A., Yamazaki, R., Ueno, M., & Koyama, K. 2003, ApJ, 589, 827
- Bamba et al. (2005) Bamba, A., Yamazaki, R., Yoshida, T., Terasawa, T., & Koyama, K. 2005, ApJ, 621, 793
- Berezhko & Völk (2004) Berezhko, E. G., Völk, H. J. 2004, A&A, 419, L27
- Bleeker et al. (2001) Bleeker, J. A. M., Willingale, R., van der Heyden, K., Dennerl, K., Kaastra, J. S., Aschenbach, B., & Vink, J. 2001, A&A, 365, L225
- Favata et al. (1997) Favata, F., et al. 1997, A&A, 324, L49
- Fukazawa et al. (2009) Fukazawa, Y., et al. 2009, PASJ, 61, 17
- Green (2004) Green, D. A. 2004, A Catalogue of Galactic Supernova Remnants (2004 January version), (Cambridge, UK, Mullard Radio Astronomy Observatory) available on the WWW at http://www.mrao.cam.ac.uk/surveys/snrs/
- Helder & Vink (2008) Helder, E. A., & Vink, J. 2008, ApJ, 686, 1094
- Holt et al. (1994) Holt, S. S., Gotthelf, E. V., Tsunemi, H., & Negoro, H. 1994, PASJ, 46, L151
- Hughes et al. (2000) Hughes, J. P., Rakowski, C. E., Burrows, D. N., & Slane, P. O. 2000, ApJ, 528, L109
- Hwang et al. (2000) Hwang, U., Petre, R., Hughes, J. P. 2000, ApJ, 532, 970
- Hwang & Laming (2003) Hwang, U., & Laming, J. M. 2003, ApJ, 597, 362
- Hwang et al. (2004) Hwang, U., et al. 2004, ApJ, 615, L117
- Ishisaki et al. (2007) Ishisaki, Y., et al. 2007, PASJ, 59, S113
- Kokubun et al. (2007) Kokubun, M., et al. 2007, PASJ, 59, S53
- Koyama et al. (1995) Koyama, K., et al. 1995, Nature, 378, 255
- Koyama et al. (2007a) Koyama, K., et al. 2007, PASJ, 59, S23
- Koyama et al. (2007b) Koyama, K., et al. 2007, PASJ, 59, S245
- Laming (2001) Laming, J. M. 2001, ApJ, 546, 1149
- Laming & Hwang (2003) Laming, J. M., & Hwang, U. 2003, ApJ, 597, 347
- Long et al. (2003) Long, K. S., Reynolds, S. P., Raymond, J. C., Winkler, P. F., Dyer, K. K., & Petre, R. 2003, ApJ, 586, 1162
- Miceli et al. (2006) Miceli, M, et al. 2006, A&A, 453, 567
- Mitsuda et al. (2007) Mitsuda, K., et al. 2007, PASJ, 59, S1
- Muraishi et al. (2000) Muraishi, et al. (CANGAROO collaboration) 2000, A&A, 354, L57
- Parizot et al. (2006) Parizot, E., Marcowith, A., Ballet, J., & Gallant, Y. A. 2006, A&A, 453, 387
- Patnaude & Fesen (2007) Patnaude, D. J., & Fesen, R. A. 2007, AJ, 133, 147
- Pravdo & Smith (1979) Pravdo, S. H., & Smith, B. W. 1979, ApJ, 234, L195
- Renaud et al. (2006) Renaud, M., et al. 2006, ApJ, 647, L41
- Serlemitsos et al. (1973) Serlemitsos, P. J., Boldt, E. A., Holt, S. S., Ramaty, R., & Brisken, A. F. 1973, ApJ, 184, L1
- Serlemitsos et al. (2007) Serlemitsos, P., et al. 2007, PASJ, 59, S9
- Stage et al. (2006) Stage, M. D., Allen, G. E., Houck, J. C., & Davis, J. E. 2006, Nature Physics, 2, 614
- Takahashi et al. (2007) Takahashi, T., et al. 2007, PASJ, 59, S35
- Tamagawa et al. (2008) Tamagawa, T., et al. 2008, PASJ, accepted (arXiv:0805.3377)
- Uchiyama et al. (2007) Uchiyama, Y., Aharonian, F. A., Tanaka, T., Takahashi, T., & Maeda, Y. 2007, Nature, 449, 576
- Uchiyama & Aharonian (2008) Uchiyama, Y., & Aharonian, F. A. 2008, ApJ, 677, L105
- Uchiyama et al. (2008) Uchiyama, Y., et al. 2008, PASJ, 60, 35
- Vink et al. (2001) Vink, J., Laming, J. M., Kaastra, J. S., Bleeker, J. A. M., Bloemen, H., & Oberlack, U. 2001, ApJ, 560, L79
- Vink & Laming (2003) Vink, J., & Laming, J. M. 2003, ApJ, 584, 758
- Vink (2008) Vink, J. 2008, A&A, 486, 837
- Willingale et al. (2002) Willingale, R., Bleeker, J. A. M., van der Heyden, K. J., Kaastra, J. S., & Vink, J. 2002, A&A, 381, 1039
- Woosley et al. (1994) Woosley, S. E., Eastman, R. G., Weaver, T. A., & Pinto, P. A. 1994, ApJ, 429, 300
- Woosley & Weaver (1995) Woosley, S. E., & Weaver, T. A. 1995, ApJS, 101, 181
- Yang et al. (2009) Yang, X. J., Tsunemi, H., Lu, F. J., & Chen, L. 2009, ApJ, 692, 894