A study of the galaxy redshift distribution toward the cosmic microwave background cold spot in the Corona Borealis supercluster
Abstract
We present a study of the spatial and redshift distributions of Sloan Digital Sky Survey (SDSS) galaxies toward the position of CrB-H, a very deep and extended decrement in the Cosmic Microwave Background (CMB), located within the Corona Borealis supercluster (CrB-SC). It was found in a survey with the Very Small Array (VSA) interferometer at 33 GHz, with a peak negative brightness temperature of K, and deviates 4.4 from the Gaussian CMB (Génova-Santos et al.). Observations with the Millimeter and Infrared Testa Grigia Observatory (MITO) suggested that 25 of this decrement may be caused by the thermal Sunyaev-Zel’dovich (tSZ) effect (Battistelli et al.). Here we investigate whether the galaxy distribution could be tracing either a previously unnoticed galaxy cluster or a Warm/Hot Intergalactic Medium (WHIM) filament that could build up this tSZ effect.
We find that the projected density of galaxies outside Abell clusters and with redshifts at the position of CrB-H is the highest in the area encompassed by the CrB-SC. Most of these galaxies are located around redshifts and , but no clear connection in the form of a filamentary structure is appreciable in between. While the galaxy distribution at is sparse, we find evidence at of a galaxy group or a low-mass galaxy cluster. We estimate that this structure could produce a tSZ effect of K. The remaining VSA signal of K is still a significant 4.1 deviation from the Gaussian CMB. However, the MITO error bar allows for a larger tSZ effect, which could be produced by galaxy clusters or superclusters beyond the sensitivity of the SDSS. Contributions from other possible secondary anisotropies associated with these structures are also discussed.
Subject headings: galaxies: clusters: individual galaxies: distances and redshifts large-scale structure of universe surveys
1 Introduction
In a survey in the Corona Borealis supercluster (CrB-SC) performed with the Very Small Array (VSA) interferometer at 33 GHz and with an angular resolution of FWHM arcmin, Génova-Santos et al. (2005) discovered a remarkably large and deep decrement (the so-called CrB-H decrement) in the Cosmic Microwave Background (CMB), with a minimum brightness temperature of K, angular size of arcmin and coordinates RA=15h22m11.47s, Dec.=28∘54’06.2”. Subsequent observations with the VSA at the same frequency but with a finer angular resolution of FWHM arcmin (Génova-Santos et al., 2008), and with the Millimeter and Infrared Testa Grigia Observatory (MITO) telescope at 143, 214 and 272 GHz and FWHM arcmin (Battistelli et al., 2006), confirmed the presence of this feature. Statistical analyses based on Monte Carlo simulations indicated that this decrement is a significant deviation from the Gaussian CMB at the level of 4.4. An independent analysis based on smooth goodness-of-fit tests yielded a deviation with respect to Gaussianity of 99.8 per cent (Rubiño-Martín et al., 2006). A possible explanation for at least part of this decrement is the Sunyaev-Zel’dovich (SZ; Sunyaev & Zel’dovich 1972) effect, a secondary anisotropy in the CMB that generates temperature decrements at the VSA frequency. This effect is produced by the inverse Compton scattering of the CMB photons by hot electrons, and is split into two components: the thermal SZ (tSZ) effect, produced by the thermal motion of the electrons, and the kinematic SZ (kSZ) effect, due to the peculiar motion of the structure containing the scattering electrons. By considering the tSZ characteristic spectral dependency, together with the flat-spectrum of the primordial CMB, Battistelli et al. (2006) estimated from the MITO observations that 25% of the total observed decrement is compatible with a tSZ component. The tSZ occurs in the cores of rich galaxy clusters, where it has been extensively detected and studied (e.g. Lancaster et al. 2005). However, there are no Abell clusters at this position, nor significant X-ray emission in the ROSAT data (Génova-Santos et al., 2005), as it would be expected in the case of the presence of a nearby rich SZ cluster. For this reason, if the SZ effect is the responsible, at least partially, for the detected decrement, then it would have to arise from either a distant unknown cluster or a less hot and dense gas distribution with a weak X-ray emission. In fact, less hot and dense structures like superclusters of galaxies are predicted to build up detectable SZ signals thanks to the long paths of the CMB photons across them (Birkinshaw, 1999). Therefore, the CrB-H decrement could be indicative of the presence of a warm/hot gas distribution in the intercluster medium with a high elongation toward the line of sight. A confirmation of this hypothesis is in order, as structures like this one could provide the location for a significant fraction of the baryon content in the Local Universe. In fact, about half of the total baryonic matter at remains undetected by the usual observational methods (e.g. Fukugita et al. 1998). According to cosmological simulations (Cen & Ostriker, 1999; Davé et al., 2001), most of these “missing baryons” (30-50%) could be located in the so-called “warm/hot intergalactic medium” (WHIM) as a low-density plasma forming large-scale filamentary structures connecting galaxy clusters.
However, the temperature and baryon density of the hypothetical WHIM structure required to produce a tSZ signal like the detected decrement are in tension with the simulations, which predict baryon overdensities in the range and temperatures K. On the other hand, the possibility of a farther background galaxy cluster is difficult to reconcile with the large angular extension ( arcmin) of the decrement. For this reason, the idea of a combination between primordial CMB and a tSZ effect, which was supported by the MITO observations, seems the most plausible hypothesis to explain the observations without violating the results from the simulations. However, the uncertainty interval of MITO tSZ relative contribution would leave the primordial CMB component as a significant deviation from the concordance model. Recently, Flores-Cacho et al. (2009) analyzed regions similar to CrB-SC in the MareNostrum Universe 111http://astro.ft.uam.es/marenostrum/ simulation, and concluded that low dense WHIM regions can produce at most K SZ decrements, and that the CrB-H feature can most likely be generated by galaxy clusters. A detailed optical study of this region can help to discriminate between the WHIM and cluster hypotheses, as it could reveal the presence of either an sparse distribution of galaxies along the line of sight tracing a filamentary structure or of a farther galaxy cluster. Gal et al. (2003) and Koester et al. (2007) tentatively identified galaxy clusters near the coordinates of the decrement at and , by using galaxy catalogues from the Second Palomar Observatory Sky Survey and by applying the maxBCG red-sequence method to the Sloan Digital Sky Survey (SDSS), respectively. Padilla-Torres et al. (2009) carried out a photometric study of the spatial distribution of the objects in the data release six of the SDSS (SDSS-DR6), and found evidence of an overdensity in the region of the decrement which is intermediate between randomly selected intercluster regions and galaxy clusters in the CrB-SC. This overdensity stems chiefly from an excess of faint and red galaxies, which presents a radial profile extending up to arcmin, and could be due to a galaxy cluster with a lack of bright galaxies at the CrB-SC redshift () or, alternatively, to the brightest part of the luminosity function of a background cluster. Confirmation and delineation of such structures, and an estimation of the amplitude of the tSZ effect expected from them, could be achieved by an spectroscopic study.
This is addressed in the present paper by means of SDSS-DR7 spectroscopic data. In section 2 we describe the selection of galaxies in the SDSS-DR7, while in section 3 we present the analyses performed on these data intended at analysing whether there is a significant overdensity at the position of CrB-H in the form of either a collapsed structure or an elongated filament. In section 4 we make estimates of the tSZ effect and the X-ray flux from the gas distribution that the galaxies in that position could be tracing. In section 5 we consider other possible CMB secondary anisotropies arisen in more distant and yet undetected massive structures in the light of sight. Our main conclusions are drawn in section 6.
2 SDSS-DR7 data
With the SDSS-DR7, released in November 2008, the SDSS has obtained spectroscopic data over more than 1,6 million objects, including 930,000 galaxies, 120,000 quasars and 460,000 stars, with a magnitude limit and covering a total sky area of 9,380 square degrees (Abazajian et al., 2008). The region of the CrB-SC was fully covered after this release. We built a catalogue of galaxies with spectroscopic measurements in this region, encompassing equatorial coordinates , , from the data releases 4 to 7. To this aim, we downloaded from the SDSS website222http://www.sdss.org/ the fits files corresponding to these four data releases. To avoid redundancy, we cross-correlated the previous files and considered any pair of entries with coordinates separated by less than 0.1” to be the same object.
The final catalogue in the region of CrB-SC contains 11,842 galaxies with spectroscopy. From all the physical information available, we kept only that relevant to this study, i.e. the equatorial coordinates R.A. and Dec. (J2000), the photometric magnitudes in bands , , , and , and the spectroscopic redshift with its error.
3 Galaxy distribution toward CrB-H
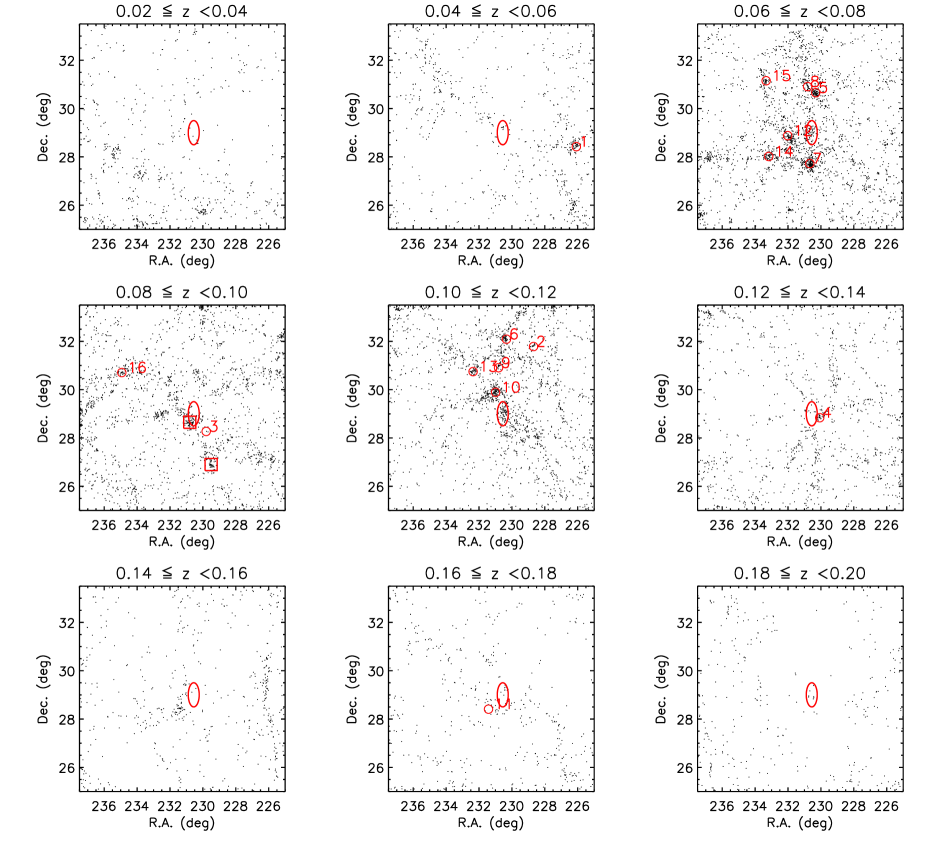
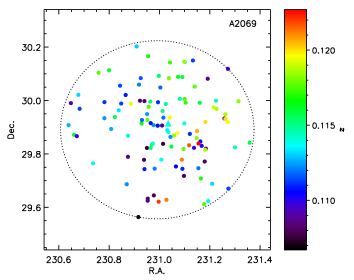
Figure 1 shows the spatial distribution of galaxies in the area of the sky covered by the CrB-SC in slices. A remarkable galaxy overdensity is visible at the redshift of the CrB-SC, . The galaxies belonging to the CrB-SC clusters A2061, A2065, A2067, A2079, A2089 and A2092 are clearly seen in this redshift interval. Also, a great concentration of galaxies is notable at , the redshift of the galaxy cluster A2069. Some authors (e.g. Postman et al. 1988) have previously noticed this galaxy overdensity, suggesting the existence of the so-called ‘A2069 supercluster’.
At the position of the decrement there is also a clear overdensity of galaxies in the bins and , but it does not hold at intermediate redshifts. Therefore, from these plots it is not evident the existence of a filamentary structure extended toward the line of sight at the position of the decrement.
3.1 Galaxy population
In order to assess how significant is the overdensity found at the position of the CrB-H decrement, we have gridded a volume of angular size R.A. by Dec. and depth into 2702 cells of size 3030 arcmin. In Table 1 we show the forty pixels with the highest number of SDSS-DR7 galaxies between and , together with the number of galaxies in each of the seven cells corresponding to each pixel. Numbers labelled with ‘c’ indicate galaxies belonging to any known Abell cluster. In the penultimate column we show the Abell clusters in the region with coordinates within each particular pixel, whereas in the last column we indicate other Abell clusters closer than 40’ to the pixel coordinates which are having an important contribution to the projected densities. The pixel corresponding to the CrB-H is the sixteenth pixel with the highest number of galaxies in the considered redshift range, most of which lie around redshifts and . Note that all pixels with a higher galaxy density are associated with known galaxy clusters. For instance, the pixel with the highest number of galaxies at , which has central coordinates R.A.=, Dec.=, has 70 galaxies in the cell centred at which belong mostly to the galaxy cluster A2069. The CrB-H pixel is therefore the densest outside Abell clusters. Remarkably, it presents notable overdensities at two distant redshifts; it has 18 galaxies in the cell centred at and 18 galaxies in the cell at . At these positions Gal et al. (2003) and Koester et al. (2007) found overdensities of galaxies in the Second Palomar Observatory Sky Survey and in the SDSS data respectively, and suggested the presence of candidate galaxy clusters. Note that such density of 18 galaxies per cell is rather uncommon outside Abell clusters. The same conclusion is drawn from Figure 2, where we show the distribution of number of galaxies per cell. In the redshift slices and only 2.6% and 2.3% of the cells are found with more than 18 galaxies, respectively. For most of the isolated peaks in the histogram with N are associated with the galaxy clusters A2065, A2061, A2089 and A2067, whereas for these peaks are associated with A2069 and A2062. It is then clear that the CrB-H cells are at the high density tail of the distribution of cells outside galaxy clusters.
In the table we found only eight cells with more than 18 galaxies outside Abell clusters. It is worth noting that two of these cells lie at the intermediate redshift . One of them is centred at R.A.=, Dec. and encloses 34 galaxies in the redshift bin , and the other is centred at R.A.=, Dec.=, right south of CrB-H, and contains 21 galaxies in the same redshift bin, with other 13 galaxies in the adjacent bin. These overdensities are noticeable in Figure 1, at positions (indicated by the two squares) close to the line connecting A2065, the most massive cluster in CrB-SC, and the large background overdensity around A2069. This could be an indication of a possible connection between these two structures. However, right at the position of CrB-H there is a lack of galaxies at intermediate redshifts.
| RA | Dec. | Ngal per interval | ||||||||
|---|---|---|---|---|---|---|---|---|---|---|
| 0.05-0.06 | 0.06-0.07 | 0.07-0.08 | 0.08-0.09 | 0.09-0.10 | 0.10-0.11 | 0.11-0.12 | ||||
| 231.06 | 30.00 | 0 | 5 | 7 | 3 | 0 | 13 | 70c | A2069 | |
| 230.56 | 27.50 | 0 | 22c | 52c | 2 | 0 | 1 | 6 | A2065 | |
| 230.56 | 28.00 | 0 | 15c | 41c | 3 | 0 | 5 | 10 | A2065 (18’) | |
| 230.06 | 30.50 | 0 | 5 | 44c | 13 | 0 | 0 | 4 | A2061 (16’) | |
| 230.56 | 30.50 | 0 | 0 | 44c | 11 | 2 | 0 | 4c | A2061 | A2067 (28’) |
| 232.06 | 29.00 | 0 | 46c | 1 | 10 | 1 | 0 | 3 | A2079 | |
| 231.56 | 29.50 | 7 | 4 | 3 | 16 | 0 | 9 | 21c | A2069 (38’) | |
| 230.56 | 31.00 | 0 | 0 | 30c | 6 | 1 | 2 | 17c | A2061 (24’), A2067 (14’) | |
| 226.06 | 28.50 | 37c | 13 | 1 | 2 | 0 | 1 | 1 | A2022 | |
| 230.56 | 32.00 | 0 | 1 | 3 | 0 | 5 | 8 | 37c | A2062 | |
| 232.56 | 29.00 | 1 | 13c | 1 | 33 | 1 | 0 | 5 | A2079 (29’) | |
| 231.56 | 30.00 | 2 | 5 | 2 | 13 | 0 | 3 | 24c | A2069 (30’) | |
| 233.06 | 28.00 | 0 | 6 | 41c | 1 | 0 | 0 | 1 | A2089 | |
| 233.56 | 31.50 | 1 | 20c | 2 | 6 | 1 | 13 | 5 | A2092 (24’) | |
| 233.56 | 31.00 | 4 | 33c | 0 | 1 | 6 | 2 | 2 | A2092 | |
| 230.56 | 29.00 | 4 | 1 | 18 | 5 | 0 | 1 | 18 | CrB-H | |
| 232.06 | 30.50 | 2 | 10 | 6 | 12 | 7 | 6 | 3c | A2083 (21’) | |
| 229.56 | 27.00 | 5 | 1 | 3 | 34 | 2 | 0 | 1 | ||
| 231.06 | 31.00 | 0 | 2 | 30c | 1 | 0 | 1 | 11c | A2067 | |
| 230.56 | 28.50 | 0 | 1 | 13 | 21 | 2 | 1 | 7 | ||
| 228.56 | 28.00 | 2 | 1 | 6 | 6 | 6 | 0 | 24 | ||
| 232.06 | 29.50 | 4 | 14c | 0 | 9 | 1 | 0 | 15 | A2079 (37’) | |
| 231.56 | 28.50 | 0 | 33c | 4 | 0 | 3 | 1 | 2 | A2079 (33’) | |
| 230.56 | 29.50 | 1 | 0 | 15 | 2 | 0 | 3 | 21c | A2069 (32’) | |
| 231.56 | 29.00 | 0 | 18c | 7c | 14 | 1 | 0 | 1 | A2079 (25’) | |
| 230.06 | 28.00 | 0 | 4 | 16c | 10c | 0 | 5 | 6 | A2065 (37’), A2056 (21’) | |
| 234.56 | 31.00 | 11 | 4 | 0 | 4 | 17c | 1 | 1 | A2110 (26’) | |
| 236.56 | 28.00 | 1 | 4 | 22 | 10 | 0 | 0 | 1 | ||
| 237.06 | 28.00 | 0 | 0 | 28 | 3 | 3 | 1 | 2 | ||
| 230.56 | 31.50 | 0 | 2 | 6c | 0 | 0 | 9 | 19c | A2067 (38’), A2062 (37’) | |
| 232.06 | 28.50 | 0 | 24c | 10c | 1 | 1 | 0 | 0 | A2079 (23’) | |
| 231.06 | 28.50 | 1 | 5 | 8 | 15 | 4 | 1 | 2 | ||
| 231.06 | 29.50 | 3 | 2 | 5 | 3 | 0 | 5 | 17 | A2069 (24’) | |
| 229.56 | 28.50 | 0 | 0 | 15 | 3c | 0 | 2 | 15 | A2056 | |
| 227.06 | 27.00 | 8 | 1 | 12 | 9 | 0 | 1 | 4 | ||
| 229.56 | 33.00 | 1 | 3 | 0 | 2 | 5 | 0 | 23 | ||
| 232.06 | 31.00 | 2 | 1 | 4 | 0 | 0 | 23 | 4 | A2083 (22’) | |
| 230.06 | 31.00 | 0 | 3 | 18c | 0 | 2 | 1 | 10c | A2061 (24’), A2067 (39’) | |
| 230.56 | 30.00 | 0 | 2 | 11 | 0 | 0 | 2 | 19c | A2069 (23’) | |
| 231.06 | 29.00 | 1 | 1 | 15 | 13 | 0 | 0 | 4 | ||
| Average | 1.38 | 2.50 | 3.74 | 3.05 | 1.58 | 1.56 | 3.31 | |||
| Average no clusters | 0.99 | 1.25 | 1.71 | 1.77 | 1.07 | 0.85 | 1.36 | |||


3.2 Redshift distribution
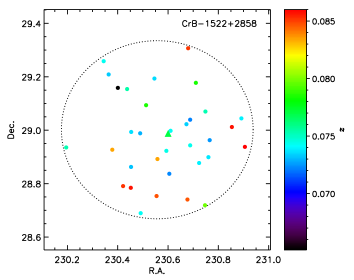
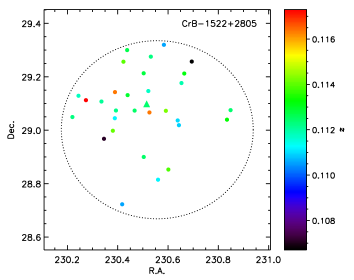
The redshift distribution of galaxies within 20’ of the CrB-H decrement is shown in Figure 3. There are two clear peaks in this distribution at and , which are indicative of the two overdensities found in the redshift bins and in Table 1. This histogram can be compared, in the same figure, with the redshift distribution of galaxies toward the direction of the two richest clusters in the region: A2065, which belongs to the CrB-SC, and the more distant cluster A2069. The mean redshift and standard deviations of all galaxies associated with the two peaks in the CrB-H decrement histogram, and with the single peaks in the A2065 and A2069 histograms, are shown in Table 2. We have identified respectively 33 and 30 galaxies within a radius of 20’ around the CrB-H decrement, and with redshifts and , which we associate with these galaxy overdensities. The centroid of these galaxies have coordinates RA=15h22m21s, Dec.=28∘58’32” and RA=15h22m00s, Dec.=28∘05’10” respectively, and therefore we name these overdensities as CrB-1522+2858 and CrB-1522+2805.
From the redshift dispersions (which have been estimated directly from the individual galaxy redshifts and not from the histogram), and from the mean error of the SDSS redshift estimates (), we have computed the radial velocity dispersions and their errors following the formalism described in Danese et al. (1980). We approximate the virial mass by , i.e. the mass within , the radius inside which the density is 200 times the critical density. By assuming virial equilibrium, and writing the 3D velocity dispersion as a function of the radial velocity dispersion, (Abell, 1977), we estimate and (see explicit equations for example in Finn et al. 2005 or in Díaz-Sánchez et al. 2007). We also compute the electron temperature of these structures, under the assumption that the intracluster gas shares the same dynamics as member galaxies (equation 3 of Rosati et al. 2002). In table 2 we show the radial velocity dispersions, masses and electron temperature for CrB-1522+2858, CrB-1522+2805, and for the galaxy clusters A2065 and A2069, which were computed using WMAP5 cosmology: , , (Dunkley et al., 2009). The values for A2065 and A2069 are consistent with other estimates. Struble & Rood (1999) give km s-1 for A2065. Reiprich & Böhringer (2002) and Brownstein & Moffat (2006) estimated masses for A2065 of M⊙ and M⊙, respectively. Small et al. (1998) found km s-1 and M⊙ for A2065. For the A2069 supercluster they give km s-1 and M⊙, but they consider a much wider volume than our, that encloses a total of 352 galaxies.
The values obtained for the velocity dispersion, mass and temperature of CrB-1522+2858 are so high that the hypothesis of a bound structure seems unrealistic. For the higher-redshift structure, CrB-1522+2805, the values are however within the range of typical galaxy clusters. In Figure 3 it is also evident that the CrB-1522+2805 peak is narrower and steeper, and more similar to galaxy cluster than the CrB-1522+2858 one. Therefore, according to this analysis, the higher-redshift structure could be virialized to some extent.


| Ngal | (km s-1) | (1015 M⊙) | (keV) | ||||
|---|---|---|---|---|---|---|---|
| CrB-1522+2858 | 0.06-0.10 | 33 | 0.0770 | 0.0054 | 1514∗ | 5.65 ∗ | 14.2 ∗ |
| CrB-1522+2805 | 0.10-0.12 | 30 | 0.1124 | 0.0022 | 599 | 0.35 | 2.2 |
| A2065 | 0.052-0.092 | 139 | 0.0722 | 0.0043 | 1199 | 2.81 | 8.9 |
| A2069 | 0.095-0.125 | 114 | 0.1140 | 0.0039 | 1061 | 1.91 | 7.0 |
∗ Note that these values are too high and meaningless, as they have been computed under the assumption of virial equilibrium. The galaxies in this case may not be gravitationally linked, and therefore the velocity dispersion calculated in these cases may be dominated by the Hubble flow rather than by peculiar velocities.
3.3 Radial distribution
We have analyzed the radial distribution of the galaxies belonging to the structures CrB-1522+2858 and CrB-1522+2805. We counted the number of objects lying in concentric rings of increasing radii around the centroid of each structure. The angular profile of CrB-1522+2805 is steeper than the CrB-1522+2858 one, but both are clearly flatter than those of A2065 and A2069 clusters, which present a much higher number of galaxies in the centre.
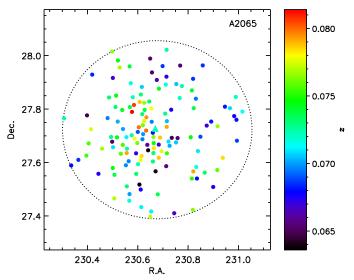
In Figure 4 we show the spatial distribution of the galaxies around both CrB structures and, for comparison, around A2065 and A2069. It is notable that the density of galaxies in the clusters peaks in the inner region, whereas in the CrB structures it is more uniform across the region. Similarly, in the galaxy clusters the redshift dispersion is higher in the centre than in the external parts, whereas in CrB-1522+2858 and CrB-1522+2805 the galaxy redshifts have similar scatter in the full region.
In order to quantify the degree of homogeneity of those samples, we have implemented the following statistical test, commonly known as “-test”. The idea is to use an statistic to test the null-hypothesis, which in this case would be that the two-dimensional distribution of galaxies in those regions is drawn from a uniform distribution. To this end, we calculate the distribution of values, where is defined as the angular distance of each galaxy to the centroid of the galaxies in a region of . In the case of a uniform distribution, the mean value should be , and the variance , being the number of galaxies in the region. Table 3 shows the results of this analysis when applied to all cases presented in Figure 4. When considering the two Abell clusters (A2065 and A2069), we find that in both cases the mean value of this statistic deviates significantly from the expected value for a uniform distribution. For A2065, we find a deviation, while for A2069, we have .
When applied to the CrB regions, we obtain a deviation for CrB-1522+2858, and for CrB-1522+2805. If we do not separate in redshift, and we study the two-dimension spatial distribution of all galaxies () in the region, we obtain a deviation of (case labelled as CrB-H in the table). In all these latter three cases, we obtain that the galaxy distribution is more concentrated than the uniform distribution. For the CrB-1522+2858, the distribution is still compatible with a uniform distribution, which supports the idea that this is a non-virialized object.
However, for the CrB-1522+2805 case, we find some evidence that this galaxy distribution might trace a virialized structure. It is important to note that in this case, the significance of the deviation is smaller than the one for the two clusters, but this is in part due to the fact that is much smaller here. The comparison of the actual deviation from the mean value shows that this CrB-1522+2805 region deviates in the same way and by a similar amount as galaxy clusters from the uniform distribution.
| Region | Significance | ||
|---|---|---|---|
| A2065 | 0.329 | -0.171 | -6.99 |
| A2069 | 0.339 | -0.161 | -5.97 |
| CrB-1522+2858 | 0.418 | -0.0820 | -1.63 |
| CrB-1522+2805 | 0.336 | -0.164 | -3.12 |
| CrB-H | 0.431 | -0.0688 | -2.08 |
4 SZ effect and X-ray emission toward CrB-H
The analyses presented in the previous section revealed the presence of CrB-1522+2805, a possible group or low-mass galaxy cluster located at . On the other hand, there is not any excess in this region of X-ray flux in the ROSAT-R6 (0.73-1.56 keV, Snowden et al. 1997) map. In this section we study whether the gas distribution associated with CrB-1522+2805 could give rise to a significant SZ signal without detectable X-ray emission.
4.1 SZ effect
4.1.1 tSZ effect
The tSZ temperature decrement produced by a galaxy cluster can be expressed as a function of its gas mass, as both are linearly dependent on the electron density, whose radial dependence can be modelled by a -profile (Cavaliere & Fusco-Femiano, 1976). The resulting equation is:
| (1) |
where (calculated from the solar abundances of Anders & Grevesse, 1989) is the mean baryonic mass fraction per electron, and are functions of and and is a function of the dimensionless frequency .
We estimate the expected minimum tSZ decrement of CrB-1522+2805 from the mass and electron temperature of Table 2. We fix the parameter at , and obtain the core radius and the gas fraction from the scaling relations of Chen et al. (2007) (see their Table 6) and Vikhlinin et al. (2009) (see their equation 9), respectively. These scaling relations are given as a function of . After rescaling this quantity from by assuming hydrostatic equilibrium, we get kpc and . Introducing these values into equation 1 we obtain a minimum temperature decrement at the VSA frequency of K.
Establishing a reliable comparison between this value and the minimum temperature of K found in the VSA map at the position of the CrB-H decrement (Génova-Santos et al., 2008), requires however taking into account the dilution introduced by the convolution with the synthesized beam of the VSA observation. This is attained by simulating the tSZ temperature profile of the cluster with the model parameters given in the previous paragraph, and convolving this map with the synthesized beam of the VSA observation. We obtain a minimum tSZ temperature decrement in the simulated map of K333Hereafter we will present always temperature decrements resulting from the convolution with the VSA beam..
The predicted tSZ effect from CrB-1522+2805 can be compared with that of a typical known galaxy cluster in the region, such as A2065. Brownstein & Moffat (2006) give for this cluster , kpc, Mpc, keV, M⊙ and M⊙. With these numbers we get a minimum decrement in the VSA map of K. In the initial survey of CrB-SC, with a previous configuration of the VSA having a coarser angular resolution, we found a temperature decrement of K (Génova-Santos et al., 2005) at the position of A2065, which is in good agreement with the previous estimate, despite the different angular resolutions.
4.1.2 kSZ effect
Coherent movement of the scattering electrons inside the supercluster can build up kSZ effects. At the VSA frequency, the ratio of the kSZ to the tSZ effect is given by
| (2) |
For and at the electron temperatures typical of galaxy clusters, KeV, the kSZ effect is an order of magnitude below the tSZ effect. A structure like CrB-1522+2805, with a receding peculiar velocity , would generate a kSZ effect in the VSA map of K. Therefore, if the gas in CrB-1522+2805 have similar properties to galaxy clusters or galaxy groups, the contribution from the kSZ effect is unimportant. However, had this structure more special characteristics, with a lower temperature typical of WHIM (0.1-1 keV), and a high coherent velocity, it could produce a kSZ signal comparable to the tSZ.
4.2 X-ray flux
If the electron density is expressed in terms of the gas mass fraction, the X-ray surface brightness from the centre of a galaxy cluster follows the scaling relation:
| (3) |
where is a function of and of and . Using this equation and rescaling to the flux in the ROSAT-R6 map at the position of A2065 we can derive the expected signal from CrB-1522+2805 in the same map. The peak flux toward A2065 is count s-1 arcmin-2, being the background level in this region count s-1 arcmin-2. For the sake of consistency, we will take, for A2065, , kpc, keV and from Brownstein & Moffat (2006).
Using these parameters for A2065 and those assumed for CrB-1522+2805 in the previous subsection, and considering their respective redshifts which are 0.0726 (Struble & Rood, 1999) and 0.112, equation 3 gives an X-ray flux for CrB-1522+2805 of count s-1 arcmin-2. This high value, which is significantly above the background level in the region, arises from the short core radius assumed, kpc. However, the scaling relation of Chen et al. (2007; see their Figure 4) allows significantly higher values of for the mass of CrB-1522+2805. As we will see in the next section, higher values of produce lower X-ray fluxes.
4.3 High SZ with low X-ray emission
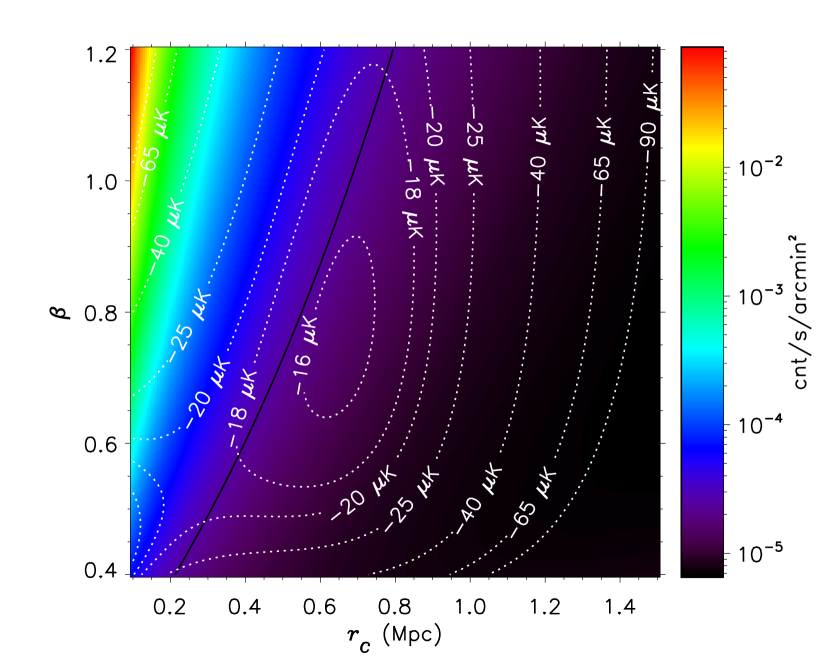
We now explore different combinations of and which could produce a significant tSZ flux with little X-ray emission. We initially fix the rest of parameters (, , and ) at the same values assumed in section 4.1. The predicted X-ray flux in ROSAT-R6 and tSZ effect in the VSA map in the parameter space are depicted in Figure 5. For core radii kpc, which are within the range allowed by the scaling relation, we see that the largest tSZ effect we can have without detectable X-ray emission is K. We have carried out the same analysis when is fixed at different values within the interval 0.08-0.12 (these values are allowed by the scaling relation of Vikhlinin et al. 2009; see their Figure 9), and the results are similar. The same occurs when we consider a similar hypothetical galaxy cluster at a higher redshift. In this case, the X-ray flux drops significantly, but so does the tSZ effect as a consequence of the higher beam dilution. Note that the value of the tSZ decrement is independent of redshift; however, for a higher redshift the angular size of the cluster is smaller and then the minimum tSZ decrement convolved with the fixed VSA synthesized beam decreases. We may therefore conclude that the strongest tSZ effect possible in the VSA map from a galaxy group or a galaxy cluster, at any redshift, with a velocity dispersion like the one estimated for CrB-1522+2805 and without detectable X-ray emission in ROSAT-R6, is K, which is 8% of the total observed decrement in the direction of CrB-H. This agrees with the value of % derived from MITO millimetric observations.
5 Other possible sources of CMB anisotropies toward CrB-H
As indicated in section 1, in Génova-Santos et al. (2008) we performed a study based on Monte Carlo simulations, including realizations of the primordial CMB Gaussian field, residual radio sources and thermal noise, and found the rms introduced by these three contributions to be K. The observed K temperature decrement is therefore a 4.4 deviation. When the possible K tSZ component is deducted from the CrB-H decrement, it still remains as significant 4.1 deviation. These results clearly show that the largest tSZ decrement expected from the galaxy group found in SDSS-DR7, or from any galaxy cluster without X-ray emission, in spite of being consistent with the MITO result, is unable to explain the total decrement in combination with a typical Gaussian primordial CMB anisotropy. Therefore, it is worthwhile to consider other sources of secondary CMB anisotropies produced by massive structures, like the Rees-Sciama (RS; Rees & Sciama 1968) effect or the lensing of the CMB.
The RS effect arises when CMB photons traverse time-varying gravitational potentials evolving in the non-linear regime. When a CMB photon passes through a collapsing (expanding) structure it experiences a net redshift (blueshift) due to the different potential wells it faces when falling in and climbing out. The RS effect is then expected to build up CMB temperature decrements (increments) in the direction of massive collapsing structures like galaxy clusters (cosmic voids). Theoretical estimates of the RS effect, carried out by means of the Swiss cheese (SC) model (e.g. Martinez-Gonzalez & Sanz 1990) or the Tolman-Bondi (TB) solution of the Einstein equations (e.g. Saez et al. 1993), give at most K in the direction of local large-scale structures like the Great Attractor.
Quilis et al. (1995) used the TB formalism to estimate the RS effect toward galaxy clusters. For a nearby typical cluster at they estimated a RS decrement of K, with an angular size of . An equivalent cluster at a farther distance would generate an effect of similar amplitude but smaller angular size. They remark however that this figure is a very soft upper limit, as their assumption of spherical symmetry leads to an excessively rapid evolution of the cluster, driven by too fast infalling motions which causes an overestimate of the CMB anisotropy. Conversely, in the case of a relaxed galaxy cluster which underwent virialization at , they obtained a more stringent upper limit of K.
Dabrowski et al. (1999) used the SC model to investigate possible combinations of the RS and SZ effect that could account for the intense microwave decrement toward the quasar pair PC 1643+4631 at discovered by Jones et al. (1997), without X-ray emission (Kneissl et al., 1998), and which they suggest could be the result of the SZ effect produced by an intervening galaxy cluster. They modelled primordial density perturbations of a pressureless field, whose evolution is governed by exact general-relativistic solutions of the Einstein equations. For a nearby cluster at they predicted a RS effect with a minimum decrement of K, extending up to , in agreement with Quilis et al. (1995). They also note that the spherical free-fall collapse model they used may not be reliable in the case of such low-redshift clusters which may be virialized. In a more realistic manner, they applied the same formalism to clusters at with different sizes and densities and obtained a much larger RS decrement of K, with an SZ of K. It seems therefore that distant galaxy clusters at , thanks to their more rapidly-varying gravitational potential, can build up RS effects of the same order as the SZ effect. For their different cluster models, they found that the ratio of the RS effect to the SZ effect varies from 0.61 to 0.16 (see their Table 4). Therefore, for the K SZ component inferred from the MITO observations by Battistelli et al. (2006) at CrB-H, we would expect at most a K RS decrement. We have estimated that such clusters would produce X-ray fluxes at the level of the ROSAT-R6 background.
Massive structures like the CrB-SC and its member galaxy clusters can lense the CMB photons, leading to temperature anisotropies. These distortions are usually small and even in the richest galaxy clusters are expected to be of the order of a few microkelvins, even though they extend out to angular sizes of a fraction of a degree, and can dominate over the SZ effect in the outer regions of clusters. Seljak & Zaldarriaga (2000) calculated this lensing effect produced in galaxy clusters, and estimated that its amplitude scales as 10K. According to this, and with the value of the velocity dispersion of Table 2, the CrB-1522+2805 group would produce an effect of K.
Apart from secondary anisotropies by massive structures, there are other sources of non-Gaussianities on the CMB of primordial nature. Textures are cosmic defects due to symmetry-breaking phase transitions in the early Universe that can produce negative and positive fluctuations of the CMB temperature (Turok & Spergel, 1990). Cruz et al. (2007) argued that this effect could be the cause of the 10 ‘cold spot’ detected in WMAP data by Vielva et al. (2004). The predicted number of textures is inversely proportional to their angular size squared, and therefore many more are expected with angular sizes similar to the CrB-H decrement. However, it is not clear whether textures of sub-degree angular scales really exist, as photon diffusion and other small-scale processes could smear them out and current simulations have not enough angular resolution to resolve these angular scales.
6 Conclusions
We have analyzed the spatial and redshift galaxy distribution in the SDSS-DR7 spectroscopic catalogue toward the CrB-H decrement, a very deep and extended negative feature in the CMB radiation found in a VSA survey of the CrB-SC toward a position with no known Abell galaxy clusters (Génova-Santos et al., 2005). We aimed to explore whether the galaxies trace a filament extended along the line of sight or a previously unnoticed galaxy cluster at this position, with a significant contribution to the total observed CMB decrement via the tSZ effect. We found remarkable galaxy overdensities around , the redshift of the CrB-SC, and , but no sign of a connection between these two regions. Therefore, the data does not provide indication of a filamentary structure connecting these two regions. In order to asses how significant are the CrB-1522+2858 (the lower-redshift one) and the CrB-1522+2805 (higher-redshift) overdensities, we have counted the number of galaxies in all the cells of arcmin2 and within an area of 94.8 deg2 in the region of CrB-SC and between and . We found respectively that only 2.6% and 2.3% of the cells at redshifts and are denser than those corresponding to CrB-1522+2858 and CrB-1522+2805. Furthermore, the majority of these 2.6% and 2.3% cells are associated with Abell galaxy clusters, indicating that CrB-1522+2858 and CrB-1522+2805 are in fact one of the most overdense intercluster regions.
For these two structures, we have analyzed the galaxy number density profiles in both longitudinal and transverse directions. Whereas CrB-1522+2858 presents a wide redshift distribution, CrB-1522+2805 is steeper and more similar to that of the nearby galaxy clusters A2065 and A2069. The radial galaxy number density distributions are flatter than in galaxy clusters in both cases, even though CrB-1522+2805 is steeper, with a slightly higher density toward the centre. This indicates that CrB-1522+2805 could be somewhat virialized, whereas this is rather implausible for CrB-1522+2858.
We have estimated the baryonic mass of the CrB-1522+2805 structure from its galaxy redshift dispersion. From this we calculated the tSZ effect and the X-ray flux imprinted by this hypothetical structure in the VSA and ROSAT-R6 maps, respectively. Considering the constraint set by the lack of detectable X-ray emission in ROSAT-R6, we found that the minimum negative tSZ effect CrB-1522+2805 could produce is K, which represents % of the VSA decrement. We have considered the possibility of a similar galaxy group at higher redshift, but the result is similar. An estimate of the SZ effect from the CrB-1522+2858 group is rather implausible, as this structure seems to be unvirialized, which makes difficult an estimate of its gas content. However, an effect of similar amplitude to CrB-1522+2805 cannot be ruled out. Our estimated amplitude for the tSZ effect is of the same order of the MITO result of 25% from a spectroscopic analysis of its three frequency channels. However, subtracting the possible K tSZ component, the total observed decrement would still remain a significant non-Gaussian deviation at the 4.1 level.
Therefore, the tSZ signal expected from the galaxy groups found in the SDSS-DR7 spectroscopic survey at the position of CrB-H can only have a minor contribution to the temperature decrement observed in the VSA map, which remains a very significant statistical deviation from the Gaussian CMB. Other scenarios have then to be considered. One interesting possibility is an intrinsic primordial anisotropy in the CMB, but before other mechanisms leading to secondary CMB anisotropies have to be studied. The lensing of CMB photons typically produces anisotropies with amplitudes of a few microkelvins in sub-degree angular scales. The RS effect in nearby clusters can build up decrements of at most K, and in a group of galaxies like CrB-1522+2805 it would be much lower. However, more distant and less relaxed clusters, with a faster non-linear variation of their gravitational potentials, could give rise to much larger RS signals. Farther rich clusters or groups of clusters not identified here could also build strong SZ effects, still compatible with the values allowed by the large error bars of the MITO estimate. For this reason, it would be very useful to obtain information of the matter distribution toward this position at higher redshifts, by either dedicated X-ray imaging or photometric redshift determinations.
Acknowledgments
We are thankful to Marco De Petris and Elia Battistelli for providing comments on this work, to Thomas Reiprich for his useful remark about the gas mass fraction in groups of galaxies, and to Juan Betancort for his discussion about the “-test”. RGS is funded by the project AYA2007-68058-C03-01 of the Spanish Ministry of Science and Innovation. JARM is a Ramón y Cajal Fellow of the Spanish Ministry of Science and Innovation.
The SDSS is managed by the Astrophysical Research Consortium for the Participating Institutions. The Participating Institutions are the American Museum of Natural History, Astrophysical Institute Potsdam, University of Basel, University of Cambridge, Case Western Reserve University, University of Chicago, Drexel University, Fermilab, the Institute for Advanced Study, the Japan Participation Group, Johns Hopkins University, the Joint Institute for Nuclear Astrophysics, the Kavli Institute for Particle Astrophysics and Cosmology, the Korean Scientist Group, the Chinese Academy of Sciences (LAMOST), Los Alamos National Laboratory, the Max-Planck-Institute for Astronomy (MPIA), the Max-Planck-Institute for Astrophysics (MPA), New Mexico State University, Ohio State University, University of Pittsburgh, University of Portsmouth, Princeton University, the United States Naval Observatory, and the University of Washington.
References
- (1)
- Abazajian et al. (2008) Abazajian, K., et al. 2008, arXiv:0812.0649, accepted in ApJS
- Abell (1977) Abell, G. O. 1977, ApJ, 213, 327
- Anders & Grevesse (1989) Anders, E., & Grevesse, N. 1989, GeCoA, 53, 197
- Battistelli et al. (2006) Battistelli, E. S., et al. 2006, ApJ, 645, 826
- Birkinshaw (1999) Birkinshaw, M. 1999, Phys. Rep., 310, 97
- Brownstein & Moffat (2006) Brownstein, J. R., & Moffat, J. W. 2006, MNRAS, 367, 527
- Cavaliere & Fusco-Femiano (1976) Cavaliere, A., & Fusco-Femiano, R. 1976, A&A, 49, 137
- Cen & Ostriker (1999) Cen, R., & Ostriker, J. P. 1999, ApJ, 514, 1
- Chen et al. (2007) Chen, Y., Reiprich, T. H., Böhringer, H., Ikebe, Y., & Zhang, Y.-Y. 2007, A&A, 466, 805
- Cruz et al. (2007) Cruz, M., Turok, N., Vielva, P., Martínez-González, E., & Hobson, M. 2007, Science, 318, 1612
- Dabrowski et al. (1999) Dabrowski, Y., Hobson, M. P., Lasenby, A. N., & Doran, C. 1999, MNRAS, 302, 757
- Danese et al. (1980) Danese, L., de Zotti, G., & di Tullio, G. 1980, A&A, 82, 322
- Davé et al. (2001) Davé, R., et al. 2001, ApJ, 552, 473
- Díaz-Sánchez et al. (2007) Díaz-Sánchez, A., Villo-Pérez, I., Pérez-Garrido, A., & Rebolo, R. 2007, MNRAS, 377, 516
- Dunkley et al. (2009) Dunkley, J., et al. 2009, ApJS, 180, 306
- Finn et al. (2005) Finn, R. A., et al. 2005, ApJ, 630, 206
- Flores-Cacho et al. (2009) Flores-Cacho, I., et al. 2009, arXiv:0908.2726, accepted for publication in MNRAS
- Fukugita et al. (1998) Fukugita, M., Hogan, C. J., & Peebles, P. J. E. 1998, ApJ, 503, 518
- Gal et al. (2003) Gal, R. R., de Carvalho, R. R., Lopes, P. A. A., Djorgovski, S. G., Brunner, R. J., Mahabal, A., & Odewahn, S. C. 2003, AJ, 125, 2064
- Génova-Santos et al. (2005) Génova-Santos, R., et al. 2005, MNRAS, 363, 79
- Génova-Santos et al. (2008) Génova-Santos, R., et al. 2008, MNRAS, 391, 1127
- Jones et al. (1997) Jones, M. E., et al. 1997, ApJ, 479, L1
- Kneissl et al. (1998) Kneissl, R., Sunyaev, R. A., & White, S. D. M. 1998, MNRAS, 297, L29
- Koester et al. (2007) Koester, B. P., et al. 2007, ApJ, 660, 239
- Lancaster et al. (2005) Lancaster, K., et al. 2005, MNRAS, 359, 16
- Martinez-Gonzalez & Sanz (1990) Martinez-Gonzalez, E., & Sanz, J. L. 1990, MNRAS, 247, 473
- Padilla-Torres et al. (2009) Padilla-Torres, C. P., Gutiérrez, C. M., Rebolo, R., Génova-Santos, R., & Rubiño-Martin, J. A. 2009, MNRAS, 396, 53
- Postman, Geller, & Huchra (1988) Postman, M., Geller, M. J., & Huchra, J. P. 1988, AJ, 95, 267
- Quilis et al. (1995) Quilis, V., Ibáñez, J. M., & Sáez, D. 1995, MNRAS, 277, 445
- Rees & Sciama (1968) Rees, M. J., & Sciama, D. W. 1968, Nature, 217, 511
- Reiprich & Böhringer (2002) Reiprich, T. H., Böhringer, H. 2002, ApJ, 567, 716
- Rosati et al. (2002) Rosati, P., Borgani, S., & Norman, C. 2002, ARA&A, 40, 539
- Rubiño-Martín et al. (2006) Rubiño-Martín, J. A., et al. 2006, MNRAS, 369, 909
- Saez et al. (1993) Saez, D., Arnau, J. V., & Fullana, M. J. 1993, MNRAS, 263, 681
- Seljak & Zaldarriaga (2000) Seljak, U., & Zaldarriaga, M. 2000, ApJ, 538, 57
- Small et al. (1998) Small, T. A., Ma, C.-P., Sargent, W. L. W., & Hamilton, D. 1998, ApJ, 492, 45
- Snowden et al. (1997) Snowden, S. L., et al. 1997, ApJ, 485, 125
- Struble & Rood (1999) Struble, M. F., & Rood, H. J. 1999, ApJS, 125, 35
- Sunyaev & Zeldovich (1972) Sunyaev, R. A., & Zeldovich, Y. B. 1972, Comments on Astrophysics and Space Physics, 4, 173
- Turok & Spergel (1990) Turok, N., & Spergel, D. 1990, Phys.Rev.Lett, 64, 2736
- Vielva et al. (2004) Vielva, P., Martínez-González, E., Barreiro, R. B., Sanz, J. L., & Cayón, L. 2004, ApJ, 609, 22
- Vikhlinin et al. (2009) Vikhlinin, A., et al. 2009, ApJ, 692, 1033